Introduction
The production of livestock feed in the USA is concentrated geographically. Corn grain and soybeans are produced primarily in Illinois, Indiana, Iowa, Minnesota and Nebraska (USDA NASS, 2007a), and grazed and cut forages are produced primarily in North Dakota, South Dakota, Wyoming Nebraska, Colorado, Kansas, Missouri, Oklahoma and Texas (USDA NASS, 2007b, c). Regional concentration of food production is characteristic of the entire agricultural sector (O'Donoghue et al., Reference O'Donoghue, Hoppe, Banker, Ebel, Fuglie, Korb, Livingston, Nickerson and Sandretto2011; MacDonald et al., Reference MacDonald, Korb and Hoppe2013), including livestock agriculture (MacDonald and McBride, Reference MacDonald and McBride2009). Increased specialization (at the farm and landscape levels) has been a key driver of efficiency gains (output per unit input) and increased total production (MacDonald and McBride, Reference MacDonald and McBride2009; O'Donoghue et al., Reference O'Donoghue, Hoppe, Banker, Ebel, Fuglie, Korb, Livingston, Nickerson and Sandretto2011), which has allowed the agricultural sector to meet nearly all domestic demand for meat, dairy and eggs (USDA ERS, 2009).
Yet this degree of specialization poses several risks. Extreme weather events and disease outbreaks in key production regions could reduce the availability of agricultural products nationwide. Altered temperature patterns, precipitation patterns (amount, intensity and form) and range and severity of pest outbreaks are projected to occur with climate change, with resultant disruptions to yield and quality of crops, pasture and dairy in some areas (Hatfield et al., Reference Hatfield, Boote, Kimball, Ziska, Izaurralde, Ort, Thomson and Wolfe2011; Malcolm et al., Reference Malcolm, Marshall, Aillery, Heisey, Livingston and Day-Rubenstein2012; Polley et al., Reference Polley, Briske, Morgan, Wolter, Bailey and Brown2013; Key et al., Reference Key, Sneeringer and Marquardt2014; Lengnick, Reference Lengnick2015). Greater variability in the productivity of land used for forages and pasture is projected at the national scale (Izaurralde et al., Reference Izaurralde, Thomson, Morgan, Fay, Polley and Hatfield2011). At the farm level, projected adaptations include shifts in land use from cropland to pastureland; thereby altering livestock feed production and the carrying capacity of certain livestock species, particularly in the Central states (Mu et al., Reference Mu, McCarl and Wein2013). Non-climate change related disasters can also reduce agricultural output, particularly when production systems are geographically concentrated, highly specialized and genetically homogeneous (Hendrickson, Reference Hendrickson2015). For example, the avian influenza outbreak in 2014–2015 affected nearly 50 million birds, most of which were in a single state (Iowa) (USDA APHIS, 2015). Finally, in areas where livestock and feed production are currently concentrated, flows of nutrients from farms (from synthetic fertilizers and manure) contribute to excessive nitrogen and phosphorous concentrations in soil and water bodies, thereby threatening environmental sustainability (Kellogg et al., Reference Kellogg, Lander, Moffitt and Gollehon2000; Weldon and Hornbuckle, Reference Weldon and Hornbuckle2006; Preston et al., Reference Preston, Alexander, Schwarz and Crawford2011; Bouwman et al., Reference Bouwman, Goldewijk, Van Der Hoek, Beusen, Van Vuuren, Willems, Rufino and Stehfest2013).
Geographic relocation of production systems has been proposed as a strategy to increase system resilience (Joyce et al., Reference Joyce, Briske, Brown, Polley, McCarl and Bailey2013). Given the aforementioned risks posed by concentrated livestock and feed production, and growing consumer demand for animal products with geographic attributes (i.e., locally or regionally sourced) (Martinez et al., Reference Martinez, Hand, Da Pra, Pollack, Ralston, Smith, Low and Newman2010), an improved understanding of regions’ food production relative to population demands for these foods is a critical first step for policy and planning purposes.
Two broad approaches have been used to estimate the production capacity for localized and regionalized livestock feed: (1) the finished animal approach: estimating the feed requirements of the finished market animal from which the end product was produced and (2) the herd approach: estimating the feed requirements of the finished animal in addition to the other animals (e.g., breeding animals, culled animals, replacement animals) that were necessarily part of the production system. Using the finished animal approach, Gerbens-Leenes et al. (Reference Gerbens-Leenes, Nonhebel and Ivens2002) estimated that, in the Netherlands, a per capita increase of only 10 g of meat per day would require a 3% increase in agricultural land requirements in the country. Using a complete diet framework, Peters et al. (Reference Peters, Wilkins and Fick2007) estimated that New York State could produce enough food to meet the demands of 21% of its population and that meat consumption was the primary determinant of agricultural land requirements. Peters et al. (Reference Peters, Bills, Lembo, Wilkins and Fick2009) used a spatial-optimization model to estimate the agricultural land use needs of New York State's population centers and found that, except for New York City, all population centers could meet all or nearly all of their food needs with existing agricultural land. Others (Hu et al., Reference Hu, Wang, Arendt and Boeckenstedt2011; Galzki et al., Reference Galzki, Mulla and Peters2015) have adopted the approach developed by Peters et al. (Reference Peters, Bills, Lembo, Wilkins and Fick2009) to estimate the agricultural land requirements of diet patterns in the Midwest USA and Southeastern Minnesota.
Wilkins et al. (Reference Wilkins, Peters, Hamm and Reinhardt2008) estimated the agricultural land requirements associated with finished animals and some of the associated breeding herds, and observed that the national agricultural land requirements of a low carbohydrate, high protein (and meat) diet would require nearly twice as much land area compared with a diet modeled after the Dietary Guidelines for Americans. Using a herd approach, Cowell and Parkinson (Reference Cowell and Parkinson2003) estimated that, in order to localize livestock production in the UK, nearly all agricultural land would need to be devoted to this purpose. Meeh et al. (Reference Meeh, Rowntree and Hamm2014) estimated that localized livestock production in Michigan would require 50 and 72% of total agricultural land under a confinement/grain-finished feeding system and a pasture-based system, respectively.
Examining the degree to which regions can meet their population's demand for meat, dairy and eggs is important because of the high land requirements associated with these products and because increased production may be needed in certain regions to reduce the risks posed by current levels of geographic concentration of production. In the present study, we estimate the degree to which the demand for meat, dairy and eggs in the Northeast region can be met with current levels of regional feed and livestock production. We focus on the Northeast because of its high population density (US Department of Commerce, 2010) and declining agricultural land base (USDA NASS, 1930–2007). Our objectives are to: (1) examine the types and amount of livestock feed produced in the region; (2) estimate the regional demand for livestock feed; and (3) analyze the relationship between regional feed output and the demand for meat, dairy and eggs.
Methods
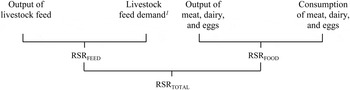
Regional self-reliance (RSR) is a metric that describes the amount of an agricultural product produced in a region out of the amount of that product that is consumed in the region (Griffin et al., Reference Griffin, Conrad, Peters, Ridberg and Tyler2014). Griffin et al. (Reference Griffin, Conrad, Peters, Ridberg and Tyler2014) reported the Northeast RSR for meat, dairy and eggs, and we refer to this as RSR FOOD (Fig. 1). We estimate the Northeast RSR for livestock feed (RSRFEED) by combining data on regional agricultural land use, food output and food consumption from Griffin et al. (Reference Griffin, Conrad, Peters, Ridberg and Tyler2014) with a livestock model (herd approach) developed by Peters et al. (Reference Peters, Picardy, Darrouzet-Nardi and Griffin2014) (hereafter referred to as the Livestock Model). We also combine RSRFOOD and RSRFEED into a single metric, which we term RSRTOTAL (see below). The Livestock Model was used to estimate the amount of livestock feed needed to produce the amount of chicken, turkey, beef, pork, dairy and eggs produced in the region, and was modified to reflect regional crop yields (Griffin et al., Reference Griffin, Conrad, Peters, Ridberg and Tyler2014). We define the Northeast region as including the following states, in order to be consistent with regional classifications used by USDA National Institute of Food and Agriculture (USDA NIFA): Connecticut, Delaware, Maine, Maryland, Massachusetts, New Hampshire, New Jersey, New York, Pennsylvania, Rhode Island, Vermont and West Virginia (data on agricultural land use and output in the District of Columbia were not available and thus were excluded from the analysis).
Regional self-reliance (RSR) categorization. 1 Amount of livestock feed needed to produce the regional output of meat, dairy and eggs.

Estimating land use and output of livestock feed
We refer to Griffin et al. (Reference Griffin, Conrad, Peters, Ridberg and Tyler2014) for a detailed description of the methods used to estimate regional land use and output of livestock feed, yet we provide a summary here. A review of data sources was completed in order to catalogue data on annual (2001–2010) land use, yield and output of livestock feed crops at the state level from 2001 to 2010. Data sources were reviewed in the following hierarchy of preference:
-
(1) USDA National Agricultural Statistics Service (NASS) State Surveys (USDA NASS, 2001–2010b);
-
(2) USDA NASS State Agricultural Censuses (USDA NASS, 2002, 2007d) and
-
(3) State Departments of Agriculture annual reports (USDA NASS, 2001–2010c, d, 2003–2010a, b, c, 2010b).
USDA NASS Surveys were the preferred data source because these provide data on an annual time-step, and data are provided in a regularly-maintained national database, which facilitates data collection. USDA NASS State Agricultural Censuses were preferred over state Departments of Agriculture annual reports because these data are provided on a greater number of agricultural commodities and not all state Departments of Agriculture publish annual reports. Data from state Departments of Agriculture annual reports were used to fill any data gaps. No noticeable differences were observed in cases where data availability overlapped between these sources. Regional yield data were used as a proxy for state-level yields in cases where state-level land use data were unavailable and agronomic conditions of the state are similar. Data on multi-use crops were adjusted for the amount associated with human consumption based on relative proportions provided by supply and utilization data (USDA ERS, 2001–2009a, b).
Due to a lack of availability of data on regional pasture output, we estimated pasture productivity by adjusting the yield of non-alfalfa hay for the proportion cut during harvest, the proportion lost during the process of field curing and the proportion of standing forage that is consumed by livestock under continuous grazing. Data on the regional mean (2001–2010) yield of non-alfalfa hay were collected from Griffin et al. (Reference Griffin, Conrad, Peters, Ridberg and Tyler2014) and were weighted by the land area of non-alfalfa hay in each state. We assumed the following: the cut portion represented 85% of standing forage (S. Green State Range Conservationist, personal communication, USDA NRCS, August 19, 2014), 20% of the cut material was lost in the process of field curing (USDA NRCS, 2003b) and the proportion of standing forage consumed by grazed animals under continuous grazing was 35% on grazed cropland and 30% on permanent pasture (USDA NRCS, 2003a). As a result, we estimated that the regional yield on permanent pastureland and grazed cropland was 1859 and 2169 kg ha−1, respectively.
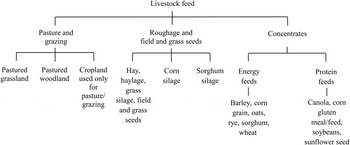
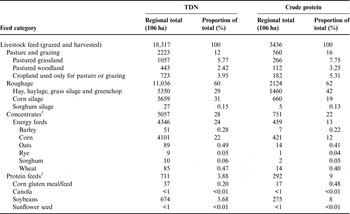
Data on the output (mass) of each type of livestock feed were adjusted for dry matter and converted to total digestible nutrients (TDN) and crude protein using the Interactive Feed Composition Libraries maintained by Dairy One (Dairy One Forage Lab, 2000–2014). Livestock feeds were grouped into three broad categories: pasture and grazing, roughage and concentrates (Fig. 2).
Livestock feed categorization.

Estimating output of meat, dairy and eggs
State level annual (2001–2010) data on slaughter inventory and carcass weights for chicken, turkey, cattle (steers, heifers, milking cows, dry cows, bulls and calves) and swine (boars, sows, barrows and gilts), as well as data on the output of dairy (fluid milk equivalents) and eggs were adopted from Griffin et al. (Reference Griffin, Conrad, Peters, Ridberg and Tyler2014). Data were converted to human-edible energy (kcal) and human-edible protein (grams) using the estimates provided by Peters et al. (Reference Peters, Picardy, Darrouzet-Nardi and Griffin2014), which were derived from the USDA Nutrient Database for Standard Reference, Release 23 (USDA ARS, 2015).
Estimating livestock feed demand
We used the Livestock Model to estimate livestock feed demand and output of meat, dairy and eggs based on the regional slaughter output from Griffin et al. (Reference Griffin, Conrad, Peters, Ridberg and Tyler2014). We refer to Peters et al. (Reference Peters, Picardy, Darrouzet-Nardi and Griffin2014) for a complete description of the methods used to develop the Livestock Model, but we review this process here. For each livestock class (layers, broilers, turkeys, dairy cattle, beef cattle and swine) the major life phases and the relationships between each phase were represented by a system of stocks and flows. Performance metrics, such as rates of reproduction and mortality, were used to compute the value of each stock and flow. Data on the nutritional needs of each livestock class during individual life phases were used to compute feed intake and ration composition. Total feed needs for each livestock class were computed by tabulating the estimated feed intake across life stages.
Several modifications were made to the Livestock Model to reflect the dairy and beef cattle production systems in the Northeast region; no modifications were needed for the other livestock classes because of their relative homogeneity across geographies. For the dairy system, the cow cull rate was increased from 22 to 28% to better account for the culling of mature cows and the proportion of replacement heifers that calve in an annual cycle (USDA NASS, 2001–2010a, b). The number of dairy bull calves per cow that are slaughtered for veal was increased from 0.104 to 0.268 based on the ratio of dairy cow inventories to calves slaughtered in the region (Griffin et al., Reference Griffin, Conrad, Peters, Ridberg and Tyler2014).
Livestock feed requirements represent the amount of feed needed to support the livestock that are associated with the regional output of meat, dairy and eggs. The Livestock Model estimates feed needs for each livestock class in terms of mass of feed (corn grain, corn silage, soybeans, hay, haylage, grazed forages and minerals) per mass of product produced (meat, dairy and eggs), given a certain nutrient content of the feed ration. Livestock feed requirements for each livestock class were converted from mass of feed to mass of TDN and crude protein using the Interactive Feed Composition Libraries maintained by Dairy One (Dairy One Forage Lab, 2000–2014), in order to present feed needs and feed output in identical units. Livestock feed requirements were summed across livestock classes and multiplied by the total amount of meat, dairy and eggs produced in the region (Griffin et al., Reference Griffin, Conrad, Peters, Ridberg and Tyler2014) to estimate the total regional livestock feed requirement.
Estimating consumption of meat, dairy and eggs
Annual (2001–2010) data on per capita availability of meat (chicken, turkey, beef and pork; carcass weight equivalent), dairy (total fluid milk equivalent) and eggs were collected from USDA ERS and used as a proxy for food consumption (Griffin et al., Reference Griffin, Conrad, Peters, Ridberg and Tyler2014; USDA ERS, 2001–2010). USDA ERS estimates annual per capita food availability by subtracting annual exports from the annual sum of beginning stocks, domestic production and imports of individual commodities, and dividing by the national population. Data on consumption of meat, dairy and eggs were converted to human-edible energy (kcal) and human-edible protein (grams) using the estimates provided by Peters et al. (Reference Peters, Picardy, Darrouzet-Nardi and Griffin2014), which were derived from the USDA Nutrient Database for Standard Reference, Release 23 (USDA ARS, 2015).
Estimating RSR
We computed RSR for feed (RSRFEED), for food (RSRFOOD), and for feed and food combined (RSRTOTAL) (Fig. 1). RSRFEED is the amount of livestock feed grown in the region as a proportion of the amount needed to produce all of the meat, dairy and eggs in the region, and is expressed in terms of TDN (t) and crude protein (c):
 $${\rm RS}{{\rm R}_{{\rm FEED},{\rm} t}}\, = \,{O_{{\rm FEED},{\rm} t}}{\rm /}{D_{{\rm FEED}}}_{,{\rm} t}, $$
and
 $${\rm RS}{{\rm R}_{{\rm FEED},{\rm} c}}\, = \,{\rm} {O_{{\rm FEED},{\rm} c}}{\rm /}{D_{{\rm FEED}}}_{,{\rm} c}, $$
where O is the regional output of TDN (t) or crude protein (c) from livestock feed (FEED) and D is the regional demand for TDN or crude protein from livestock feed. RSRFOOD is the amount of meat, dairy and eggs produced in the region as a proportion of the amount of meat, dairy and eggs consumed in the region, expressed in terms of human-edible energy (k) and human-edible protein (r):
 $${\rm RS}{{\rm R}_{{\rm FOOD},k}}\, = \,{O_{{\rm FOOD},{\rm} k}}{\rm /}{D_{{\rm FOOD}}}_{,k}, $$
and
 $${\rm RS}{{\rm R}_{{\rm FOOD},r}}\, = \,{O_{{\rm FOOD},{\rm} r}}/{D_{{\rm FOOD}}}_{,r}, $$
where O is the regional output of human-edible energy (k) or human-edible protein (r) from meat, dairy and eggs (FOOD), and D is the regional demand for human-edible energy or human-edible protein from meat, dairy and eggs. RSR TOTAL is the amount of energy (e) and protein (p) from livestock feed produced in the region as a proportion of the amount of energy and protein from meat, dairy and eggs consumed in the region:
 $${\rm RS}{{\rm R}_{{\rm TOTAL},{\rm} e}}\, = \,{\rm RS}{{\rm R}_{{\rm FEED},{\rm} t}} \times {\rm RS}{{\rm R}_{{\rm FOOD},{\rm} k}},$$
and
 $${\rm RS}{{\rm R}_{{\rm TOTAL},{\rm} p}}\, = \,{\rm RS}{{\rm R}_{{\rm FEED},{\rm} c}}\, \times \,{\rm RS}{{\rm R}_{{\rm FOOD},{\rm} r}}.$$
Results
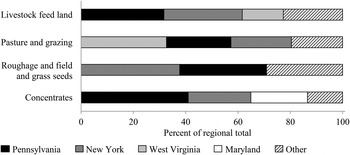
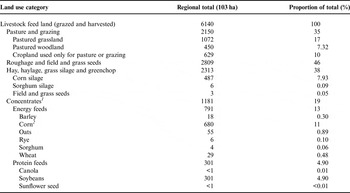
An annual mean of over 6.1 million ha of land in the Northeast was dedicated to livestock feed from 2001 to 2010 (Table 1). Land used for roughage and field and grass seeds represented the largest land use category in the region (46%), followed by land used for pasture and grazing (35%), and land used for concentrates (19%). Nearly 80% of land used for livestock feed from 2001 to 2010 was located in Pennsylvania, New York and West Virginia (Fig. 3). Three states accounted for 80% of the land used for pasture and grazing (Pennsylvania, New York and West Virginia), and nearly 90% of the land used for concentrates (Pennsylvania, New York and Maryland). New York and Pennsylvania accounted for over 70% of the land used for roughage and field and grass seeds. Annual mean feed output from 2001 to 2010 was over 18.3 billion kg of TDN and over 3.4 billion kg of crude protein (Table 2). Roughage accounted for the largest share of TDN and crude protein (60 and 62%, respectively), followed by concentrates (28 and 22%, respectively) and pasture and grazing (12 and 16%, respectively).
State concentration of livestock feed land in the Northeast region, 2001–2010.

Northeast regional mean livestock feed land area, 2001–2010.

1 Adjusted for human consumption.
2 Includes corn gluten meal/feed.
Northeast regional livestock feed output, 2001–2010.

TDN, total digestible nutrients.
1 Adjusted for human consumption.
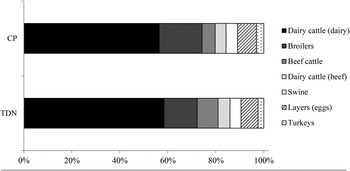
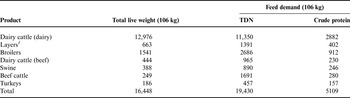
Annual (2001–2010) feed demand in the region was over 19.4 billion kg of TDN and 5.1 billion kg of crude protein (Table 3). Dairy cattle in the dairy production system accounted for the majority of the demand for TDN (58%) and crude protein (56%), followed by broilers (14% of TDN and 18% of crude protein, Fig. 4). Beef cattle, dairy cattle in the beef production system, swine, layers and turkeys each accounted for less than 10% of the demand for TDN and crude protein.
Northeast regional feed demand as a proportion of livestock category, 2001–2010. CP, crude protein; TDN, total digestible nutrients.

Northeast regional livestock feed demand, 2001–2010.

TDN, total digestible nutrients.
1 Weight is for eggs.
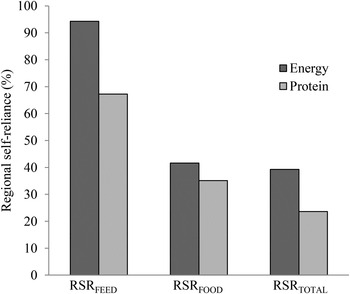
The region produced 94 and 67% of the amount of TDN and crude protein, respectively, needed to raise the livestock that were slaughtered for meat or produced eggs or dairy in the region from 2001 to 2010 (RSRFEED, Fig. 5). The production of meat, dairy and eggs in the region represented 42% of the human-edible energy and 35% of the human-edible protein consumed from meat, dairy and eggs in the region (RSRFOOD). All told, livestock feed production in the region accounted for 39 and 24% of the energy and protein, respectively, consumed via meat, dairy and eggs in the region (RSRTOTAL).
Northeast regional self-reliance (RSR) of livestock feed and animal-based foods, 2001–2010.

Discussion
The Northeast region was a net importer of livestock feed (in terms of total TDN and crude protein), as well as meat, dairy and eggs (in terms of human-edible energy and protein), from 2001 to 2010. This is the result of a confluence of long-term regional trends that include the movement of agricultural production out of the region with a concomitant increase in the regional population and an increase in the national demand for food products made from animals.
The Northeast region experienced a 60% decrease in land in farms from 1929 to 2012, compared with a national decrease of 7% (USDA NASS, 1930–2007). This is partly due to increased efficiency (output per unit input) of the agricultural sector but mostly to the movement of agricultural production out of the region to capture the comparative advantages of production in other regions (O'Donoghue et al., Reference O'Donoghue, Hoppe, Banker, Ebel, Fuglie, Korb, Livingston, Nickerson and Sandretto2011). Much of the land that was once used for agriculture in the Northeast has since been developed or reforested (USDA ERS, 1945–2007a b; Drummond and Loveland, Reference Drummond and Loveland2010; Mockrin et al., Reference Mockrin, Stewart, Radeloff, Hammer and Johnson2013). While urban land has increased by 213% in the Northeast compared with over 300% nationally, the current urban land base in the Northeast is 1.4–12 times higher than other regions in the country, representing 20% of the national urban land area (USDA ERS, 1945–2007a; US Department of Commerce, 2012) with only 6% of the total land base (US Department of Commerce, 2012). Nearly 7% of the total land area in the Northeast is urban, compared with just 1.7% nationally (USDA ERS, 1945–2007a).
Like many agricultural goods, the production of meat, dairy and eggs in the USA has experienced a long term trend toward geographic concentration, with many firms moving out of the Northeast region to capture economies of scale elsewhere (O'Donoghue et al., Reference O'Donoghue, Hoppe, Banker, Ebel, Fuglie, Korb, Livingston, Nickerson and Sandretto2011; Johnson et al., Reference Johnson, Marti and Gwin2012). Since 1950, the slaughter of cattle and calves (by weight) in the Northeast decreased by 39%, whereas it increased by 129% nationally (USDA NASS, 1950, 2010a). During this same time period hog slaughter decreased by 46% in the Northeast yet increased by 82% nationally. Although dairy production in the Northeast increased by 11% since 1962, it increased by 53% nationally and the regional share of national production decreased from 21% in 1962 to 15% in 2010 (USDA ERS, 1962, 2010).
While the agricultural sector in the Northeast was declining, population and demand for animal products was increasing. The population in the Northeast increased by 93% from 1929 to 2014, from just over 34 million to nearly 65.6 million (US Department of Commerce, 1929–2014). Although this was outpaced by national population growth (162%) during that time period, the Northeast region has approximately 3.7 times more people per square kilometer than the nation as a whole (US Department of Commerce, 1929–2014, 2012). Although per capita availability (by weight) of beef, eggs and pork declined by 30, 22 and 8%, respectively, from 1970 to 2010, the per capita availability of chicken, turkey and dairy increased by 112, 102 and 8%, respectively (USDA ERS, 1970–2010). Overall, per capita availability of animal products increased by 7% from 1970 to 2010.
The Northeast population is projected to expand by nearly 2.3 million (3%) from 2014 to 2030 (US Department of Commerce, 2014) and the decades-long increase in the per capita availability of animal products gives little indication of flattening out. Although local and regional food markets account for a small proportion of total food sales, consumer demand for these foods is increasing and the density and amount of local and regional food markets in the Northeast is among the highest in the country (Martinez et al., Reference Martinez, Hand, Da Pra, Pollack, Ralston, Smith, Low and Newman2010). Therefore, the Northeast region will have to experience a resurgence in agricultural production in order to help meet regional food demand in the future.
Drivers of RSRTOTAL of meat, dairy and eggs in the Northeast include the land area of feed crops, crop and animal productivity, consumer preferences and downstream supply chain barriers. Increasing the land area of livestock feed crops may not be feasible because former agricultural land is rarely reclaimed (O'Donoghue et al., Reference O'Donoghue, Hoppe, Banker, Ebel, Fuglie, Korb, Livingston, Nickerson and Sandretto2011) and in some cases this land may have been unproductive (Lubowski et al., Reference Lubowski, Bucholtz, Claassen, Roberts, Cooper, Gueorguieva and Johansson2006). Reclaiming forest land for cultivated farming would require deforestation and would likely result in a large carbon impact. Instead of clearing forests, silvopasture may provide a unique opportunity for the region to expand land available for grazing, but this has not been fully explored. Although some crops (notably corn and soybeans) and dairy (USDA NASS, 1970–2014) have exhibited long-term yield increases in the Northeast, these trends could be interrupted by the effects of climate change (Malcolm et al., Reference Malcolm, Marshall, Aillery, Heisey, Livingston and Day-Rubenstein2012; Key et al., Reference Key, Sneeringer and Marquardt2014) (for other crops, such as hay, long-term yield trajectories have been flat) (USDA NASS, 1970–2014). Furthermore, dramatic increases in milk productivity have meant that milk production can be maintained or enhanced with smaller herds. While this is more efficient from a milk output perspective, dairy is a multi-functional system, so that decreasing herd size also decreases the output of beef from the dairy system.
We showed that RSRTOTAL was limited more by RSRFOOD than by RSRFEED. Thus, reducing consumption of meat, dairy and eggs would have a greater positive impact on RSRTOTAL compared with the output of livestock feed. Reducing per capita consumption of animal-sourced foods could also enhance the health and environmental sustainability of many consumers’ diets (Macdiarmid et al., Reference Macdiarmid, Kyle, Horgan, Loe, Fyfe, Johnstone and McNeill2012; Westhoek et al., Reference Westhoek, Lesschen, Rood, Wagner, De Marco, Murphy-Bokern, Leip, van Grinsven, Sutton and Oenema2014; DGAC, 2015a, b). On the production side, Griffin et al. (Reference Griffin, Conrad, Peters, Ridberg and Tyler2014) demonstrated that the RSRFOOD of dairy and eggs was higher than that of meat products; therefore, a limiting factor to increasing RSRTOTAL is slaughter output. As we discussed above, livestock slaughter output in the Northeast has experienced a longstanding decline. In parts of the Northeast, producers do not have convenient access to slaughter and processing facilities (Johnson et al., Reference Johnson, Marti and Gwin2012). Although Lewis and Peters (Reference Lewis and Peters2012) reported that slaughter facilities in New England do not operate at full capacity, this is because of the inconsistent throughput over the course of a year, with low demand in the spring and winter. In the Northeast region, increased demand for regionally slaughtered meat could encourage improved efficiency and capacity of slaughter and processing firms in the region.
While the Livestock Model is a robust tool to facilitate RSR estimation, there are several limitations associated with this application. First, available data on cattle slaughter do not distinguish between cattle categories associated with the beef system and those associated with the dairy system, so several assumptions were made to partition cattle categories to the beef and dairy systems. We tested the effect of these assumptions on RSRTOTAL by conducting separate analyses for each assumption, and observed no meaningful difference in the results. Another potential limitation is that herd characteristics and performance were only modified from national estimates when high-quality, region-specific estimates were available, such as the dairy cow cull rate and the number of dairy bull calves slaughtered for veal. To test the effect of these regional estimates on RSRTOTAL, we conducted separate analyses using national and regional data, and observed no difference in RSRTOTAL for protein and a two percentage point increase (39–41%) in RSRTOTAL for energy when national estimates were used instead of regional estimates. A final limitation is that the Livestock Model does not account for the diversity of regional production systems within each livestock category, such as pasture-based systems; as such, it approximates dominant regional production systems. Future research should better characterize these systems and their implications for RSR.
In some areas in the Northeast it is common for land on which roughages were harvested to be subsequently grazed. Due to a lack of data on these dual use areas, this land was categorized as roughage rather than pasture (USDA NASS, 2007e), and this could have led to an underestimation of pasture output.
The concept of RSR does not imply that the foods that are produced in the region are also consumed in the region, or that the foods are available at the same time of year that consumers demand them. Rather, RSRFEED is a net balance of livestock feed production to the demand of livestock feed, and RSRFOOD is a net balance of the output of meat, dairy and eggs to the consumption (or availability) or these products. We used national per capita estimates of food consumption so these may not be representative of regional food demand.
Conclusion
We show that from 2001 to 2010, the Northeast region was a net importer of livestock feed and meat, dairy and eggs. This is the latest manifestation of a confluence of long-term trends in the region: decreasing land in farms and output of animal products, and increasing population and demand for animal products. Given the growth in demand for locally and regionally produced food in the Northeast, combined with the need to adapt to possible reductions in food output from other regions of the country, a reemergence of agricultural production in the region may be needed. Reduced consumption of animal products and/or increased meat production may be needed to increase the RSR for animal products.
Acknowledgements
The authors thank Ashley McCarthy, Research Assistant at the Friedman School of Nutrition Science and Policy, for her work on computing pasture yields. This study was supported by USDA-NIFA Grant No. 2011–68004-30057, enhancing the Food Security of Underserved Populations in the Northeast through Sustainable Regional Food Systems Development.