All representatives selected via democratic, direct elections hold office for a given period of time and must either retire or face the electorate again when their term comes to an end. These direct elections renew the link between represented and representatives, and induce the specific duration of term of office. Term length provides representatives with an all-important time horizon to achieve policy and political goals, and thus creates incentives that may fundamentally affect the political system, from individual behavior to collective outcomes.
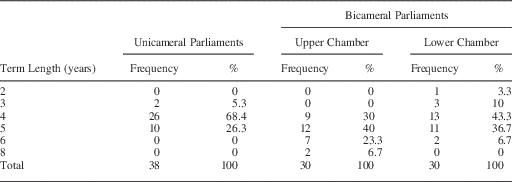
Despite its importance to the democratic process, the role of term duration has not typically been at the center of political science scholarship, and some have recently called for a more systematic study of this and other aspects of political time (Goetz and Meyer-Sahling Reference Goetz and Meyer-Sahling2009). By systematically examining legislative term length, scholars may be able to better explain patterns of legislative outcomes both within and between countries. Table 1 shows the distribution of term length in national parliaments in 70 democracies. Although the vast majority of democracies with unicameral parliaments have terms that last either four or five years, there is considerably more variation in bicameral systems, where term length varies from three to six years in lower chambers and from two to eight years in upper chambers. The differences in term length at subnational levels and the staggering of some chambers add further layers of temporal incentives in many countries.
Distribution of Term Length in National Parliaments

Note: countries with polity score≥8 for which term length information was available. Polity score obtained from the Polity IV Dataset (2013); term length information obtained from the Inter-Parliamentary Union (2014). In all, 70 countries were included. See section 2 in Supplemental Appendix for a disaggregated list of term length by country and chamber.
This article contributes to the understanding of the incentives created by term duration by studying subnational legislatures in the United States, a setting that is promising for at least two reasons. First, as legislative terms in the United States are fixed, term length can be perfectly anticipated and may therefore directly structure legislative behavior. Second, the random assignment of term length in three US states offers an opportunity to overcome important methodological challenges.
As of 2013, the average term length in US state legislatures’ upper chambers (the state senates) was 3.5 years, and the average term in the lower chambers (the state houses) was 2.2 years; however, legislators seem to believe that terms should be longer: since 2000, legislation seeking to extend term length has been introduced in at least 26 US states. So far, this widespread effort has been unsuccessful. When arguing for longer terms, some representatives have presented the proposal as a type of campaign reform that seeks to reduce the amount of time and money they spend campaigning, and relieve the state from the burden of election administration. The saved time and money, so the argument goes, will be put to better legislative use and voters will be better off, plus the influence of money in state politics will be reduced; however, advocates of longer terms have struggled with the negative image of the initiative, which critics portray as an effort to reduce electoral accountability.Footnote 1
The controversy surrounding the duration of legislative terms is nothing new. When designing the American Constitution, the Founding Fathers discussed at length the intrinsic tension in the role of term length to achieve representation. They believed that short appointments would result in greater dependence on the people (Federa list 57, 63, 71) and would protect them from the possible degeneracy of their leaders (Federalist 52); however, the Framers also noticed the risks associated with exceedingly short terms. In particular, they feared that short terms would result in undesirable outcomes because representatives might avoid pursuing unpopular but necessary policies (Federalist 63, 71), might fail to engage in policies with long-term benefits (Federalist 63, 71), and might lack the time to acquire enough expertise and information (Federalist 64, 53).
The debate has been filled by numerous arguments but little evidence,Footnote 2 perhaps because of the methodological challenges posed by the empirical study of term length effects. Legislators exhibit certain behavior while in office, but in order to learn whether their behavior is being affected by the duration of the term for which they were elected, one would have to know how legislators would have behaved if their term length had been shorter or longer. This is of course extremely difficult, as this counterfactual behavior is never observed. This paper avoids these methodological problems using a series of experiments that occur in the Arkansas, Illinois, and Texas Senates in the United States, where the length of terms is randomly assigned in the elections immediately following mandatory changes to district boundaries (a process referred to as redistricting). In these three states, all senate seats are up for election after district boundaries are changed, and senators are randomly assigned to serve either two-year or four-year terms immediately after. This random assignment makes senators assigned a four-year term a valid counterfactual group for senators assigned a two-year term. In particular, the research design compares both types of senators in the two years following an election where terms are randomized.
Using these experiments, I test several hypotheses regarding the relationship between term length and legislative behavior. As discussed below, developing these hypotheses requires an understanding of the cyclical nature of voters’ attention to politics and the role of elections in ensuring representation, including a distinction between the role of elections as an accountability versus a selection mechanism. In order to provide evidence on whether shorter terms generate an incentive for senators to change their ideological position, I analyze their NOMINATE scores and a rank-based measure of distance between each senator’s and his district’s position. In addition, senators up for reelection may need to devote a larger proportion of their time to campaign events, media exposure, and overall visibility, all of which could have an impact on legislative productivity. Moreover, the higher uncertainty about the future, and an increased awareness about the risk of taking controversial positions, may also alter legislative behavior. To establish whether term length affects legislative output, I also study abstention rates and bill sponsorship during the legislative session. Finally, I study whether senators whose term is shorter raise and spend significantly more money than their fellow senators who are serving longer terms.
All in all, the empirical evidence from these experiments seems to offer little in support of shorter terms. Although there are important differences across states, when considered together, the results show a generally consistent picture: senators serving two years abstain more often, introduce fewer bills, and do not seem to be more responsive to their constituents than senators serving four years. In addition, senators serving shorter terms raise and spend significantly more money, although in those states where candidates are allowed to spend and raise continuously throughout their terms, the differences arise only when the election is imminent. To the extent that the desired policy outcome is to increase legislative output and limit campaign expenditures and contributions, these results suggest that the policy recommendation should be to make legislative terms longer.
A note of caution, however, is in order. Even when the random assignment of term length has ideal properties for making inferences about the effects of short-term changes in term length on individual legislative behavior, this assignment is not immediately well suited to understanding the general consequences of an institutional change that permanently altered the duration of terms for all members of a legislative body. The reason is that an institutional change that affected every legislator’s term length may alter the current pattern of interdependence between legislators and introduce unforeseen outcomes. Thus, to know what would happen if all senators were to permanently face longer terms, one must make precise assumptions about how individual senators interact with one another in the legislature. I explore this issue further in the Supplemental Appendix. In particular, in light of theoretical results by Muthoo and Shepsle (Reference Muthoo and Shepsle2010), I consider whether some of the institutional features of the state senates considered here might induce senators to engage in intertemporal strategic behavior, which would induce a violation of the Stable Unit Treatment Value Assumption (SUTVA) and preclude a simple policy recommendation. Although in this supplementary analysis I do not find evidence that this assumption is violated, the discussion illustrates the important point that in the social sciences, the interpretation of results coming from natural or field experiments is limited by the institutional conditions in which these experiments are embedded. At a minimum, the analyses presented here are directly relevant to understand how individual legislators respond to term length incentives. In addition, these results could be used to learn how overall legislative behavior would change in a legislature that permanently changed the term length of all its members, but this broader goal could only be attained under specific assumptions about the nature of the strategic interactions between members.
The rest of this paper is organized as follows. The second section discusses the relationship between electoral accountability and term length under different notions of representation and the third section derives hypotheses about the particular effects of term length on legislative behavior and reviews previous findings. The fourth section describes the institutional details surrounding the random assignment of term length in the Arkansas, Illinois, and Texas Senates and the penultimate section presents the main empirical results. The last section discusses and concludes. The Supplemental Appendix provides additional information about term length in comparative perspective and about the empirical findings discussed, shows the results of power calculations, and discusses the plausibility of SUTVA in this institutional context.
Representation, Electoral Accountability, and Term Length
In representative democracies, popular elections are the mechanism that links citizens to those who rule them. At periodic intervals, citizens go to the polls and vote for the candidates they prefer; between elections, these elected representatives make decisions that affect policy outcomes. In general, elected officials are representative when they act in the best interest of citizens (Pitkin Reference Pitkin1967; Przeworski, Stokes and Manin Reference Przeworski, Stokes and Manin1999). This definition of representation is obviously broad, and scholars have offered different notions of representation that emphasize different mechanisms by which representation may be achieved.Footnote 3
Mandate representation occurs when the elected representative follows the preferences of her constituents—expressed either by means of voting for specific policy platforms or through signals such as opinion polls, demonstrations, and letters—and following these preferences is in the constituent’s best interest (Przeworski, Stokes and Manin Reference Przeworski, Stokes and Manin1999). Under this notion of representation, the role of elections is to punish (or reward) representatives for failing to act (or acting) according to the promises made at the time of the previous election—which will in turn reflect the preferences of the electorate.Footnote 4 In this sense, voting is retrospective, as voters make their decisions based on the representatives’ past behavior. Assuming representatives wish to be reelected, the anticipation of punishment in turn induces representatives to behave according to the wishes of their constituents.Footnote 5
The role of elections as an accountability mechanism that sanctions representatives’ behavior and the idea that voters incorporate politicians’ past actions into their voting decisions has been an undisputed assumption in most theoretical and empirical studies for the past decades (see review in Mansbridge Reference Mansbridge2009). Yet, for some forms of representation, elections need not function as an accountability mechanism. Under a gyroscopic representation model (Mansbridge Reference Mansbridge2003), voters choose politicians who when elected pursue the voters’ best interest, not because they want to please voters for fear of being sanctioned, but because of their own beliefs and principles. Under this notion of representation, the role of elections is not to affect the representative’s behavior but to select representatives of “good type,” who are principled and share the public’s preferences (Fearon Reference Fearon1999).Footnote 6
These competing views grant elections strikingly different roles. In the first view, elections serve to punish representatives’ behavior, which in turn induces reelection-seeking politicians to respect constituents’ preferences, whereas in the latter, the role of elections is simply to select good-type politicians. These two models, which Mansbridge (Reference Mansbridge2009) calls, respectively, the “sanctioning model” and the “selection model,” lead to different expectations about the role of term length. In a pure selection model, as elections serve the purpose of selecting representatives who are internally motivated to pursue the constituents’ best interest, the length of terms should be mostly inconsequential (at least in one direction as shown below), as the threat of punishment in upcoming elections is not what motivates politicians to act. Therefore, it should matter little whether representatives face the electorate every two or ten years, as they pursue similar policies in both scenarios.
But in a sanctioning model, the length of terms becomes crucial if the likelihood of being punished is connected to the proximity of the next election. In the extreme situation where terms were perpetual, the possibility of sanctioning would disappear. But if terms last a fixed period, as is the case for all elected legislators in the United States, the time until the next election may affect representatives’ behavior while they are in office. In order for this to be true, one needs to assume that voters’ interest in their representative’s behavior is highest shortly before the election, and lowest when the next election is in the distant future. This is indeed a common assumption in studies of legislative behavior and elections. For example, Weingast, Shepsle and Johnsen (Reference Weingast, Shepsle and Johnsen1981) introduced the “What have you done for me lately” (WHYDFML) principle, by which voters place more weight on the benefits received recently than on benefits received further in the past. This principle (in combination with retrospective voting) is also explicitly adopted in more recent formal models of legislative bargaining such as those in Muthoo and Shepsle (Reference Muthoo and Shepsle2010) and Shepsle et al. (Reference Shepsle, Van Houweling, Abrams and Hanson2009).Footnote 7 In addition to theoretical studies, empirical studies of electoral proximity on legislative behavior invariably make an assumption of voters’ attention waxing and waning over time,Footnote 8 an assumption that is empirically supported by, for example, Fenno (Reference Fenno1982) and Campbell (Reference Campbell1982).
This recency bias assumption was also held by the Framers, who, considering the term of the President, claimed that:
Between the commencement and termination of such a period, there would always be a considerable interval, in which the prospect of annihilation would be sufficiently remote, not to have an improper effect upon the conduct of a man indued with a tolerable portion of fortitude; and in which he might reasonably promise himself, that there would be time enough before it arrived, to make the community sensible of the propriety of the measures he might incline to pursue (Federalist 71).
Of course, the WHYDFML or recency bias assumption need not be strictly true in order to be empirically relevant, all that is needed is that politicians believe that voters’ attention to their actions is higher closer to election time.
Hypotheses and Previous Literature
Using the theoretical framework just introduced, I now discuss several hypotheses about term length effects. The sanctioning model, together with a (correct or incorrect) belief that voters exhibit some recency bias, leads to the conclusion that representatives’ behavior should change when the proximity of the next election varies. At the broadest level of generality, the hypothesis is as follows:
HYPOTHESIS 0: Legislative behavior will be affected by the temporal proximity of the next election.
More specifically, Hypothesis 0 can lead to two different kinds of hypotheses regarding term length effects on legislative behavior. First, keeping term length constant, Hypothesis 0 implies that legislators should exhibit a particular pattern of behavior early in their terms when voters’ attention is lowest, and a different pattern later in their terms when attention is highest. This hypothesis has been explored by several US scholars, most of which focused on the US SenateFootnote 9 where six-year terms were hypothesized to induce temporal variations in behavior. Some scholars studied hypotheses about responsiveness based on spatial arguments of moderation and convergence, specifically the hypothesis that the longer the remaining time in office, the less responsive representatives are to constituents’ preferences (Amacher and Boyes Reference Amacher and Boyes1978; Glazer and Robbins Reference Glazer and Robbins1985; Bernstein Reference Bernstein1991; Levitt Reference Levitt1996). Others ignored constituency preferences and simply focused on the effects of election proximity on senator ideology (Elling Reference Elling1982; Thomas Reference Thomas1985; Wright and Berkman Reference Wright and Berkman1986; Ahuja Reference Ahuja1994; Bernhard and Sala Reference Bernhard and Sala2006), studying whether senators become more ideologically moderate as elections approach.
Second, Hypothesis 0 also implies that varying term length should lead legislators to change their behavior. This question has been studied much less frequently, simply because there are very rare occasions when different legislators in the same legislative body are elected simultaneously for terms of different duration. The assignment of terms in the Arkansas, Illinois, and Texas Senates immediately after redistricting provides an ideal design to study this issue, because senators are elected in the same election to serve either two-year or four-year terms, and the assignment of term length among senators is decided randomly. A similar kind of experiment is studied by Dal Bo and Rossi (Reference Dal Bo and Rossi2011), who analyze the effect of term length on the behavior of senators in Argentina, where the duration of terms was randomly assigned at the level of legislator groups. The authors provide evidence that various measures of legislative effort such as bill introduction and floor attendance are higher when terms are longer.
Note that this is different and preferable to a strategy that uses the staggered structure of terms to compare the behavior of senators in different classes who are up for reelection at different elections and thus have different time horizons but terms of same length, a strategy used to analyze legislative behavior in the US Senate (Amacher and Boyes Reference Amacher and Boyes1978; Kuklinski Reference Kuklinski1978; Elling Reference Elling1982; Ahuja Reference Ahuja1994; Bernhard and Sala Reference Bernhard and Sala2006). As this strategy uses senators in one class as counterfactuals for senators in another, it suffers from the inferential problem that senators in different classes may be subject to different political forces as a consequence of having been elected in different elections.Footnote 10, Footnote 11 Moreover, the inferential problems will be as serious if the election proximity effect is inferred from legislative behavior in two different legislative chambers, such as a comparison of house and senate members in a given state.Footnote 12
I study four manifestations of legislative activity: responsiveness, abstention rates, bill introduction, and campaign expenditures and contributions, leading to specific hypotheses (details about the specific measures used are provided in the Empirical Results section). First, following previous evidence and the expectations of the sanctioning model plus a recency bias assumption, shorter terms should lead to an increase in responsiveness, that is, a decrease in the distance between senators’ roll-call votes and the preferences or ideological position of constituents, as this might increase the chances of reelection. This leads to the first specific hypothesis:
HYPOTHESIS 1: In the first two years after the election, senators serving two-year terms will exhibit higher responsiveness than senators serving four-year terms.
Second, I study abstention rates to establish whether term length affects participation in roll-call votes. An increase in constituents’ attention to recent legislative action may be an added incentive to increase legislative effort and minimize the number of missed votes. Moreover, roll-call voting may provide useful opportunities to engage in position taking, which can then be used to reap electoral benefits (Mayhew Reference Mayhew1974), leading to the next hypothesis:
HYPOTHESIS 2: In the first two years after the election, senators serving two-year terms will exhibit lower abstention rates than senators serving four-year terms.
Third, I analyze bill introduction, an important part of individual legislative activity that may be missed by looking at roll-call votes. Unlike roll-call voting, individual senators have full control over the legislation they introduce, making bill sponsorship an important source of information about legislative behavior (Schiller Reference Schiller1995). Introducing bills may bring a number of benefits, including the opportunity of directly influencing public policy, acquiring publicity, and sending signals to constituents about policy priorities, and creating a reputation for expertise in a certain policy area. As a result, bill sponsorship can provide concrete benefits and increase the prospects of reelection, which leads to the following hypothesis:
HYPOTHESIS 3: In the first two years after the election, senators serving two-year terms will introduce more bills than senators serving four-year terms.
Finally, the need to run a campaign in order to get reelected may result in different patterns of expenditures and contributions. In particular, senators for whom reelection is impending will have a greater need to raise funds and make campaign-related expenditures. This leads to the last hypothesis:
HYPOTHESIS 4: In the first two years after the election, senators serving two-year terms will raise and spend more money than senators serving four-year terms.
There are important differences between these hypotheses. Hypothesis 1 states that responsiveness increases with shorter terms, and follows directly from a sanctioning model; under a selection model, however, the effect of term length on responsiveness should be null. Moreover, there is no reason to expect that a more proximate election will result in less responsiveness. It follows that, although beyond the scope of this paper, hypotheses about responsiveness such as Hypothesis 1 could in principle distinguish between the sanctioning and the selection model. Hypothesis 4 states that shorter terms will lead to greater campaign expenditures and contributions, and once again there are no reasons to expect that a more proximate election will result in less campaign expenditures. Moreover, as campaigns are necessary in both a selection and a sanctioning model, Hypothesis 4 is expected to hold under either model.
On the other hand, senators up for reelection need to devote a larger proportion of their time to campaign events, media exposure, fundraising, and overall visibility, all of which could have an impact on legislative productivity. Thus, it is possible that the time and resources spent campaigning prevent senators serving two-year terms from performing legislative tasks to the level of their peers who have an additional two years in their term. Thus, the alternative hypotheses to Hypotheses 2 and 3 are as follows:
HYPOTHESIS 2': In the first two years after the election, senators serving two-year terms will exhibit higher abstention rates than senators serving four-year terms.
HYPOTHESIS 3': In the first two years after the election, senators serving two-year terms will introduce less bills than senators serving four-year terms.
Again, as the mechanism leading to Hypotheses 2' and 3' is the various costs of campaigning, and campaigning is necessary in both a sanctioning and a selection model, evidence in support of Hypotheses 2' and 3' cannot provide information about what model of representation holds.
Research Design: Random Assignment of Term Length in State Senates
The hypotheses discussed above are tested using a series of randomized natural experiments in the Arkansas, Illinois, and Texas upper legislative chambers, where the duration of terms was randomly assigned to be two or four years. Although some specifics are different, the reasons why term length is randomly assigned is common to the three states. In all US states, state senate districts are redrawn following each federal census to ensure that the state population is distributed approximately equally between districts. In a minority of states, the state Constitution mandates that in the election immediately after reapportionment all senate seats be up for election. The purpose of this provision is to allow all senate districts to choose a new representative in the first election under the new district plan, to ensure that after redistricting all sitting senators have been elected by the new constituencies. In the cases where senators’ terms are staggered, this post-reapportionment provision brakes this staggered structure. In Arkansas, Illinois, and Texas, the procedure used to recover the staggered structure of the terms is random assignment. In all three states, the random assignment of term lengths is at the senate district level and not at the senator level, so that if a senator decides not to run for reelection his successor must respect the term length that was assigned to the seat after the last reapportionment.
Arkansas
The Arkansas Senate has 35 members serving four-year terms. In all general elections that do not occur immediately after a redistricting plan has been implemented, half of the senate seats are up for election. Senators are therefore staggered, with half of them running for election every two years. When all senate seats are up for election, the staggered structure of senators’ terms is broken; the way in which it is restored is the random assignment of term lengths. Section 6, Amendment 23 of the Arkansas Constitution requires that senators be randomly divided into two roughly equally sized classes after each reapportionment. Senators in the class of size 18 serve a two-year term immediately following redistricting and a four-year term thereafter, whereas senators in the class of size 17 serve two successive four-year terms immediately following redistricting and a two-year term at the end of the decade. The Arkansas Constitution mandates that senators draw lots in the first legislative session immediately after reapportionment to determine the composition of each group.
Arkansas state senators are term limited; as of 1992, they can serve a maximum of eight years in their lifetime. The Arkansas State Legislature is a medium-sized legislature relative to other legislatures in the United States (see classification by the National Conference of State Legislatures). The regular session meets for ~60 days in every odd-numbered year, and thus members are generally part-time legislators.
The analysis includes senators serving in Arkansas 84th Legislative Session, which met between January and May of 2003. The assignment of terms was performed on December 2, 2002, before the beginning of the 2003 regular session and after the November 2002 election, ensuring that during the campaign senators ignored the duration of the term for which they would be elected.
Texas
The Texas Senate has 31 members serving four-year terms. As in Arkansas, in all general elections that do not occur immediately after redistricting, half of the senate seats are up for election. Senators are therefore staggered, with half of them running for election every two years. Section 3, Article III of the Texas Constitution mandates that an entirely new senate be chosen following each reapportionment. This breaks the staggered structure of terms, which is recovered by random assignment. Each senate seat is randomly assigned to one of two classes of size 15 and 16, respectively. Senators whose seats belong to the class of size 15 serve a two-year term immediately following redistricting and a four-year term thereafter, whereas senators whose seats belong to the class of size 16 serve two successive four-year terms immediately following redistricting and a two-year term at the end of the decade.
The Texas Constitution requires that state senate districts be redrawn following publication of the decennial census. Normally, new districts are redrawn in the two years following the beginning of each decade, so that in the general election years ending in two (e.g., 1992, 2002, etc.), all state senate seats are up for election.
However, there were three instances of random assignment of Texas senators’ terms between 1993 and 2003: once after the redistricting plans that followed each decennial census, and one additional time in 1995 because of the fact that senate districts were again redrawn between the 1992 and the 1994 general elections. In 1993, term lengths were assigned at the end of March, whereas the senate convened at the beginning of January. Thus, between January and March, each individual senator was unsure as to whether she/he would have to run for reelection in 1994. Senators knew that eventually term length would be assigned randomly, and that each of them would run for reelection in 1994 with probability 15/31, but they had no way of anticipating who in particular would be assigned two-year terms. This allows for a crucial placebo test in the Empirical Results section, because the assignment of different term lengths should have no effect in the behavior of senators before this assignment was actually performed. In addition, in section 5 of the Supplemental Appendix I use this “placebo period” to provide indirect evidence about the plausibility of SUTVA in the context of state legislatures.
The Texas State Legislature is also a medium-sized legislature relative to other legislatures in the United States (see classification by the National Conference of State Legislatures). As in Arkansas, the regular session meets for ~60 days in every odd-numbered year, and thus members are generally part-time legislators. Members are not term limited.
The analysis includes senators serving in Texas 73rd, 74th, and 78th Legislature, whose regular session met between January and May of 1993, 1995, and 2003, respectively. In all cases, terms were randomly assigned after the election, when the respective regular session convened. Terms in the 73rd Senate were assigned on March 25, 1993; terms in the 74th Senate were assigned on January 11, 1995; terms in the 78th Senate were assigned on January 14, 2003. As in Arkansas, this implies that during the campaign senators ignored the duration of the term for which they would be elected.
Illinois
The Illinois Senate is significantly more professionalized than both the Arkansas and the Texas Senates. It has 59 members, almost twice the size of the senates in the other two states, and its regular session meets every year for ~160 days. Because members must devote a significant part of their time to the legislature every year, they have larger staffs and most of them are full-time legislators. Members are not term limited.
State senators generally serve four years, and they are staggered so that every two years a third of the senate seats is up for election. Once again, after each reapportionment all senate seats are up for election to ensure that the new electorate in each district is adequately represented, and the staggered structure is broken. Section 2.a, Article IV of the Illinois Constitution mandates that after each reapportionment senate districts be divided into three classes according to their term structure in the following ten years: class I serves four years, four years, and two years; class II serves four years, two years, and four years; and class III serves two years, four years, and four years. Article 29c in Illinois Election Code requires that senators be assigned to classes randomly.
The random assignment mechanism is different from that of Arkansas and Texas, as it is stratified by groups, which are predetermined. Districts are divided into three groups, and after each reapportionment, each group is randomly assigned to exactly one of the classes mentioned above.Footnote 13 Thus, the assignment of term lengths is done at the group level and not at the senate district level. The current division of districts into groups was established by law in 1992, respecting Section 2 of Article IV of the Illinois Constitution, which mandates that districts in each group “shall be distributed substantially equally over the State.” As a consequence, the current groups are not geographically clustered, and all of them contain districts throughout the state.
The fact that term length in Illinois is assigned at the level of groups, not senate districts, means that the analysis for Illinois requires an additional assumption. Ideally, all inferences in this state would be carried out at the group level, because the same treatment status is simultaneously assigned to all districts in each group. Unfortunately, the total number of groups is only three, which means that the exact significance level is at most one-third and there is not enough statistical power to reject the null hypothesis; however, inferences could be made at the level of senate district under the assumption that districts were randomly assigned to groups. As mentioned above, as districts were divided into groups according to a principle of equal distribution over the state, this assumption might not be a bad approximation for the true assignment. Thus, the inferences for Illinois presented below make the assumption that this procedure for dividing districts into groups gave each district an equal probability of being assigned to each of the three groups.Footnote 14 Note that a similar assumption is needed by Dal Bo and Rossi (Reference Dal Bo and Rossi2011), as the assignments they consider are at the level of groups, not individual senators.
Another difference between Illinois and Arkansas and Texas is that the random assignment of district groups to different classes is done after redistricting but before the election, so that senators do know whether they will be serving a two-year or a four-year term before the election. The analysis includes senators serving in Illinois 93rd General Assembly, which met between January of 2003 and December of 2004.
Empirical Results
In this section, I describe my data sources, provide evidence about the validity of the randomization procedures employed in each state, and test empirically the hypotheses discussed in the Empirical Results section.
Data Sources
Data were collected from a variety of sources. Census data were obtained from the US Census Bureau for all states. Roll-call votes and information on bills introduced during the legislative session were obtained from the Arkansas Legislative Digest for Arkansas and from Telicon for Texas, two local companies that provide an array of legislative information and services. In both cases, roll-call votes were randomly checked against records in the Arkansas and Texas Senate Journals. Arkansas Legislative Digest and Telicon also provided demographic and biographical information for incumbents. Roll-call data for Illinois was provided by the Representation in America’s Legislatures project.Footnote 15 For Illinois, bill information and incumbents’ characteristics were obtained from the Illinois General Assembly. Election returns were obtained from the Texas Legislative Council, the Arkansas’ Secretary of State, and the Illinois State Board of Elections.
Data on campaign expenditures and contributions for Arkansas were obtained from the Arkansas’ Secretary of State Financial Disclosure search engine, and several rules about campaign disclosure were checked via personal communications with the Arkansas Ethics Commission. Contributions and expenditures for Texas were obtained from the Texas Ethics Commission. For Illinois, campaign finance data were obtained via a special request to the Illinois State Board of Elections.
Testing the Randomization
The validity of the randomization was tested in two steps. First, I established that the random assignment of term lengths was implemented as described in the states’ Constitutions and election codes. In personal communications with staff members of the Arkansas, Illinois and Texas Senates, I inquired about the implementation of the randomization and was assured that no exceptions were made. Moreover, I obtained details about the random mechanism used in each case.
Second, I tested covariate balance. The random assignment of treatment implies that the distributions of all variables not affected by treatment (including baseline covariates) are identical between treatment and control groups. However, in a given sample, the empirical distribution of baseline covariates may be significantly different between both groups. As covariate imbalance may lead to incorrect inferences, testing whether randomization produced similar empirical distributions across groups is crucial. Equally important, covariate balance gives more confidence in validity of the experiments, as deviations from a clean random assignment of terms would likely result in significant differences in observable characteristics.
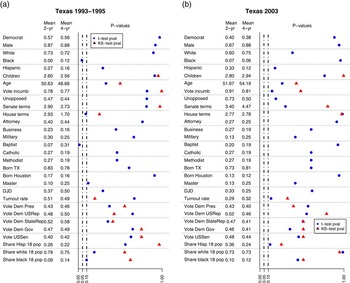
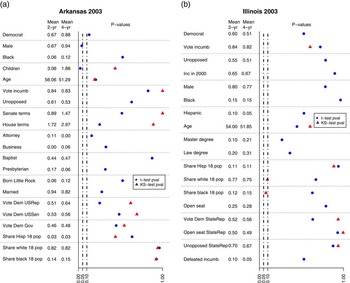
Figures 1 and 2 show the results of balance tests for all the senate sessions analyzed. Each legislative session in 2003 is analyzed separately, whereas the 1993 and 1995 Texas Legislative Sessions are combined. In all figures, the columns show the mean of each covariate and the graphs show the p-values corresponding to the test of the null hypothesis that the treatment is without effect, using both a t-test for the difference in means and a Kolmogorov–Smirnov for differences in the overall distribution. Figure 1 presents the results for Texas, with Figure 1(a) showing the results for the 1993 and 1995 legislative sessions, and Figure 1(b) the results for the 2003 session. In both cases, the covariates are very well balanced between both groups. Senators are similar in terms of their demographics, and districts are similar in terms of their partisanship, as measured by the Democratic vote share for several state-wide and national offices, and their demographic characteristics. The exceptions are the indicators for whether the incumbent is black and of Baptist religion in the 1993–1995 sample, both of which are significant at 5 percent.Footnote 16Figure 2(a) presents the results for Arkansas. Again, balance is excellent across a wide range of district and senator-level characteristics, with the exception of gender and number of children.Footnote 17 Finally, Figure 2(b) presents the results for Illinois. The covariates include incumbent characteristics, district characteristics, and characteristics of the state house districts exactly contained in each senate district. Covariates are very well balanced, and point estimates are remarkably similar between both groups.
Balance tests for Texas (a) Texas 1993–1995 (b) Texas 2003

Balance tests for Arkansas and Illinois (a) Arkansas 2003 (b) Illinois 2003

In addition, omnibus tests of balance performed in each of the four samples fail to reject the null hypothesis of no differences between the groups.Footnote 18 In sum, these findings provide strong evidence that the randomization of term length occurred as described, and that treatment and control groups are similar in terms of a wide range of potential confounders.
The Effects of Term Length on the Behavior of State Senators
I now present the estimated effects of term length on campaign finance, abstention rates, bill introduction, and responsiveness for Arkansas, Illinois and Texas senators, in order to test the hypotheses discussed above. As mentioned above, for Texas, I analyze the 1993 and 1995 legislative sessions together, whereas the 2003 session is reported individually to aid the comparability with the results from Arkansas and Illinois, which also correspond to the 2003 session. Campaign contributions and expenditures are measured at the senator level in nominal dollars and are presented in six-month intervals to provide a more detailed account of their cyclicality. Abstention rates are defined for every senator as the proportion of roll-call votes in which he voted neither “Yea” nor “Nay.” The measure of bill introduction is the number of bills introduced by every senator during the legislative session.
Responsiveness measures were constructed in two different ways. Measuring responsiveness poses well-known challenges, as representatives’ positions and constituency preferences are not measured in the same scale, which complicates evaluating their “distance” except under very strong assumptions. A common approach is to use public opinion data to measure constituency preferences and roll-call vote data to measure the positions of representatives (e.g., Erikson, Wright and McIver Reference Erikson, Wright and McIver1993), and make assumptions about the comparability of both variables. As public opinion data is not available at the level of state senate district and given the difficulties of comparing different scales, I take a different approach.
I use two measures of responsiveness, one for Arkansas and Texas and another for Illinois, both of which are based on differences in the rankings of senators’ and districts’ positions. In both measures, I calculate an order of senators in a liberal–conservative dimension by ranking them according to their W-NOMINATE scoresFootnote 19; the two measures differ only in how senate districts are ranked. The measure employed in Texas and Arkansas ranks senate districts according to the average of Democratic vote shares for state-wide offices in the general election.Footnote 20 The district with the highest Democratic share is ranked as the most liberal. The measure employed in Illinois ranks each senate district according to the W-NOMINATE scores of the state house members whose districts overlap with it (Levitt Reference Levitt1996)—in Illinois, each senate district contains exactly two whole state house districts. Finally, the two responsiveness measures were constructed subtracting each district’s vote-share rank or house-representative rank from its corresponding senator’s rank, and taking the absolute value.Footnote 21 In addition, I report the absolute value of senators’ W-NOMINATE scores to test whether senators serving shorter terms exhibit a more moderate voting behavior. This simplistic measure does not take into account constituency preferences; nonetheless, it avoids the most serious measurement problems and contributes to a more complete characterization of the effects of term length on senators’ positions.
For every outcome considered, I use a simple t-test to test the hypothesis that the mean difference between senators serving two-year terms and senators serving four-year terms is equal to 0. I report the results graphically, plotting 95 percent confidence intervals for the difference in means (all tests are against a two-sided alternative); each graph also has two left columns showing the mean outcome for senators serving two-year and four-year terms, respectively.
A natural concern is that the small sample sizes used for analysis will not provide enough statistical power to reject the null hypothesis that term length is without effect. From a practical point of view, the results presented below show that statistical significance is achieved in many cases, which implies that in these samples statistical significance can be achieved. This is reassuring, as it suggests that insignificant results are more likely to stem from a true lack of effect than from a lack of power. More formally, in section 4 of the Supplemental Appendix I show power calculations based on a two-sample t-test and standard deviations for various outcomes estimated from the data in each session. These calculations show that, although there is low power to detect small effects, there seems to be acceptable power to reject effect sizes >0.6 or 0.7 SDs of the outcome.
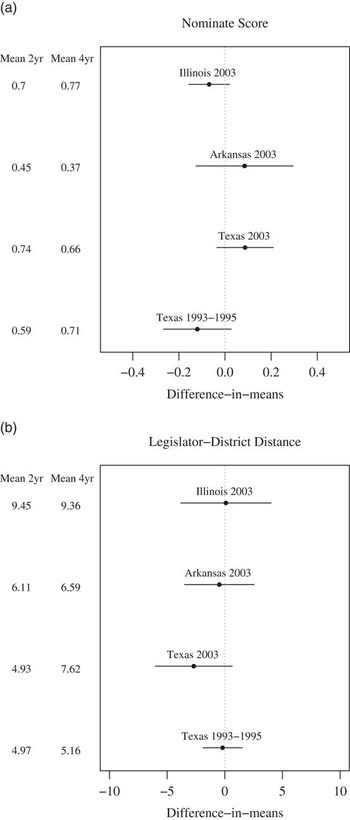
Figure 3 shows the results on the two measures of ideological positioning. Figure 3(a) plots the effects of term length on the absolute value of the senators’ W-NOMINATE scores. The results are insignificant at 5 percent in all cases, and the point estimates vary widely, from positive for Arkansas and Texas in 2003 to negative for Texas and Illinois in 1993–1995. The responsiveness measures based on distance between senators’ and districts’ rankings are also insignificant in all cases; however, in contrast to Figure 3(a), the point estimates are remarkably consistent: with the exception of Texas in 2003, all point estimates are remarkably close to 0, suggesting that, at least based on these measures of distance, term length seems to have no effect on legislators’ responsiveness. These results show little support for Hypothesis 1, according to which shorter-term length was expected to increase responsiveness (and perhaps induce moderation).
Effect of term length on ideological position measures (a) NOMINATE score (b) Legislator−district distance Note: difference in means between senators serving a two-year term and senators serving four-year terms. Bars are 95 percent confidence intervals, and left columns present mean values for senators serving two-year and four-year terms.

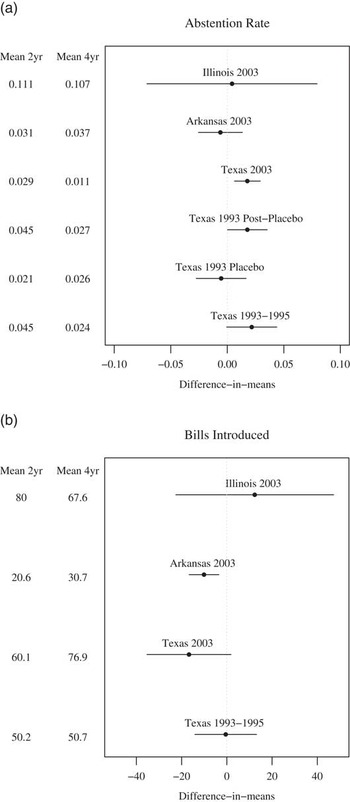
Figure 4 shows the results for abstention rates and bill introduction. Figure 4(a) shows the results for abstention rates, including abstention rates for the placebo period in the 1993 legislative session Texas; as explained above, in this period senators had not yet been assigned the length of their terms. As shown in the figure, whereas during the Texas 1993 placebo period there is no significant difference between the groups that will be later assigned to different term lengths, the difference becomes large and significant in the post-placebo period—which lasts from the end of March 1993 until the end of the legislative session. Moreover, the results are positive in all other sessions: senators whose reelection is two years away have significantly higher abstention rates in both the 1993–1995 session (excluding the placebo period) and the 2003 session. The differences are large, with the average abstention rate among two-year senators being almost twice as large as the average rate among four-year senators in 1993–1995, and more than twice in 2003, both significant at 5 percent. In contrast, in the placebo period mean abstention rates are, respectively, 2.1 and 2.6 percent, a small and insignificant difference. These findings give confidence in the validity of the experiment, as no differences in abstention rates (or any other outcome) should be seen before terms are assigned. In contrast, term length seems to have no effect on abstention rates in Illinois and Arkansas. Thus, there is no support from any state for Hypothesis 2, according to which term length decreases abstentions. Instead, the results from Texas empirically support Hypothesis 2, as term length increases abstention rates.
Effect of term length on abstentions and bill introduction (a) Abstention rate (b) Bills introduced Note: difference in means between senators serving a two-year term and senators serving four-year terms. Bars are 95 percent confidence intervals, and left columns present mean values separately for senators serving two-year and four-year terms.

Figure 4(b) shows the results for number of bills introduced. In Arkansas, senators serving two years introduce significantly fewer bills than senators serving four years. The mean number of bills introduced by four-year senators is 30.7, about 50 percent higher than the average 20.6 bills introduced by two-year senators, a difference highly significant. A negative effect of term length on bill introduction is also observed in Texas in 2003, where two-year senators introduce 17 less bills on average (this difference is significant at 10 percent, with p-value of 0.087). In contrast, there seems to be no effect on bill introduction in Illinois and in Texas in 1993–1995. Analogously to the case of abstentions, these results offer no support for Hypothesis 3, as there is no evidence from any state showing that term length leads to higher numbers of bills introduced. The results from Texas and Arkansas in 2003 instead give support to Hypothesis 3, with term length decreasing bill introduction.
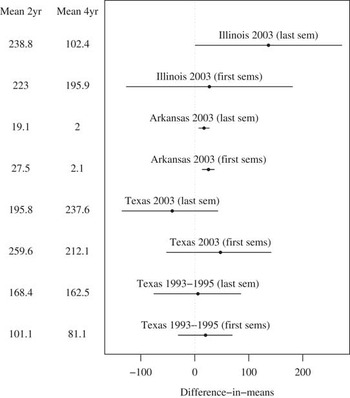
Finally, Figures 5 and 6 present campaign contributions and expenditures, respectively. For Illinois, Arkansas, and Texas in 2003, I include contributions and expenditures collected between January of 2003 and December of 2004 (the beginning and end of the legislative session, respectively). The analysis of Texas’ earlier sessions includes only contributions and expenditures collected during the 1995 legislative session, between January 1995 and December 1996.Footnote 22 For all sessions, the results are reported for two separate periods: effects labeled “first sems” correspond to contributions and expenditures that occur in the first three semesters after the general election (e.g., for a 2003 session, this includes the period from January 2003 to June 2004); effects labeled “last sem” correspond to the last semester of the legislative session, which is the period when senators serving two-year terms are up for reelection (i.e., from July to December 2004).Footnote 23
Effect of term length on campaign contributions Note: difference in means between senators serving a two-year term and senators serving four-year terms. Bars are 95 percent confidence intervals, and left columns present mean values separately for senators serving two-year and four-year terms. Contributions are measured in thousands of dollars. “First sems” corresponds to contributions collected in the first three semesters of the two-year legislative session. “Last sem” corresponds to contributions collected in the last semester (July–December) of the legislative session, this is the semester when senators serving two years face reelection (in November).

Effect of term length on campaign expenditures Note: difference in means between senators serving a two-year term and senators serving four-year terms. Bars are 95 percent confidence intervals, and left column presents mean value for senators serving four-year terms. Expenditures are measured in thousands of dollars. “First sems” corresponds to expenditures incurred in the first three semesters of the two-year legislative session. “Last sem” corresponds to expenditures incurred in the last semester (July–December) of the legislative session, this is the semester when senators serving two years face reelection (in November).

In terms of effect size and statistical significance, the results are strongest in Arkansas, where both contributions and expenditures are between ten and five times larger in the two-year group than in the four-year group. These extraordinarily large effects are caused by Arkansas’ specific rules. Under Arkansas law, a candidate may not solicit or accept campaign contributions more than two years before an election at which he seeks nomination or election, which explains the low funds among four-year senators. These restrictions on campaign contributions induce indeed a very large difference in the patterns of contributions and expenditures on election year, both in the first three semesters combined and in the last semester. Roughly, Arkansas senators serving two years spend and raise an average of 20,000 dollars in the last semester of their reelection, whereas senators serving four years raise and spend an average of 2000 dollars in the same period.
In Illinois, Figure 5 shows that campaign contributions are statistically indistinguishable between both groups of senators in the first three semesters after they are elected, but the difference becomes much larger and statistically significant in the semester of the election. In the last months before the election, two-year senators receive more than twice as much money as four-year senators (238,800 dollars versus 102,400 dollars). Figure 6 shows a similar pattern for expenditures: although the difference is almost zero in the first three-quarters of the session, it becomes large and statistically significant (though at 10 percent) for the semester of the election, with two-year senators spending on average about 160,000 dollars more than senators who are not up for reelection.
For Texas, the results are somewhat unexpected. Despite not being up for reelection until two years later, senators serving four-year terms seem to spend and collect money at the same rate as their fellow senators serving two-year terms. Figure 5 shows that all differences in contributions for Texas are insignificant, and a similar pattern is observed for expenditures in Figure 6. Unlike Illinois and Arkansas, differences are not bigger and are not closer to significance in the semester of the election. Interestingly, these null results do not seem to occur because senators who are up for reelection receive little money but rather because both two-year and four-year senators receive and spend large sums of money. For example, the average contribution in the second half of 2004 is about 196,000 dollars for two-year senators and 238,000 dollars for four-year senators (p-value 0.33). All in all, the evidence on campaign contributions and expenditures supports Hypothesis 4. This was fully expected, although, as discussed below, the marked cyclicality of these differences and the large amounts of money collected by senators serving longer terms are somewhat surprising.
Discussion
Drawing general conclusions from the results presented above is no easy task, particularly as not all effects are observed in all states and years. Nonetheless, there are some generalities that seem to suggest a common pattern underneath the idiosyncrasies of each legislative session. Regarding campaign contributions, a comparison of Texas and Illinois (where senators are free to raise and spend money at any point during their terms) with Arkansas (where senators are not allowed to raise money more than two years before their reelection) suggests that although senators tend to concentrate a larger proportion of their expenditures and contributions in their last semester in office, in the absence of campaign finance restrictions senators serving longer terms still raise and spend considerable amounts of money years before their reelection. Imposing limits on campaign finance activities seems to be a more effective way of reducing campaign expenditures and contributions than increasing term length.
In terms of legislative output, Texas senators serving two years abstain twice as often as senators serving four years, and this occurs in all sessions considered. In Arkansas, senators serving two years introduce about 33 percent less bills than senators serving four years, an effect also present in Texas in 2003,Footnote 24 where two-year senators introduce 20 percent less bills than their fellow senators serving four-year terms. In Illinois, both groups of senators abstain and introduce bills at the same rate. Furthermore, shorter terms do not seem to result in increased responsiveness in any of the legislative sessions analyzed, at least not according to the rank-based measures considered here.
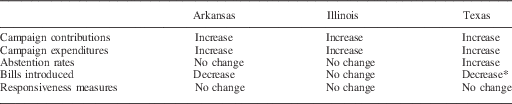
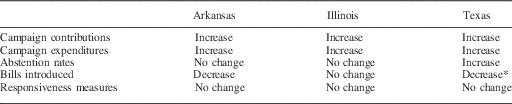
Although all statistically significant results show that shorter terms decrease legislative output, these negative effects appear in some states and some years, but not in all of them. Table 2 presents a summary of the results for the three states, which suggests that despite the mixed results, there is a pattern when the evidence is analyzed in the context of the specific hypotheses derived previously: in no state or year do the results support any of the Hypotheses 1–3, according to which reducing term length would have the desirable effect of increasing responsiveness and improving legislative output as measured by a decrease in abstention rates and an increase in the number of bills introduced. Instead, the evidence supports Hypotheses 2' and 3' predicting negative effects of shorter terms on legislative output.
A natural question is whether the mechanisms that result in these negative effects can be characterized. A full answer to this question is behind the scope of this paper, but it likely includes a number of different phenomena. First, longer terms may provide greater incentives to invest in complex long-term policies. This argument was first advanced by the Framers (see e.g., Federalist 63), and a version of it was also developed by Dal Bo and Rossi (Reference Dal Bo and Rossi2011) to explain the negative effects of short terms on legislative output observed in Argentina. In addition, if legislators believe that voters exhibit the kind of recency bias described above, those facing an imminent election may be reluctant to take controversial positions, a phenomenon which may both lead to an increase in abstentions and a decrease in bill introduction in topics perceived as polarizing or unpopular. Finally, legislators serving shorter terms may simply have less available time for legislating, given the need to engage in campaign activities to ensure their reelection. Interestingly, the analysis of campaign expenditures and contributions shows that the differences between two-year and four-year senators arise only in the last semester of the two-year period after the election, if they arise at all. But in Texas and Arkansas, the effects on abstention rates and bill introduction are naturally seen during the time when the legislature actually meets, which is typically the first few months of the first year after the election, long before the semester when senators face reelection. This suggests that if campaigning has an adverse effect on measures of legislative activity, it is likely through channels other than fundraising, such as trips to the district, public speeches, interactions with the media, etc., all of which are likely to occur while the legislature is in session.
Moreover, the summary of results in Table 2 shows that the only effect observed in Illinois is an increase in campaign expenditures and contributions in the semester of the election. Notably, the negative effects in legislative output observed in Arkansas and Texas are absent in Illinois. Why are there no term length effects in Illinois? A speculative answer centers on the different degrees of professionalism of the legislatures analyzed. Illinois is the most professionalized legislature of the three considered, being the eighth most professionalized state legislature in the United States in 2003 according to the Squire Legislative Professionalism Index (Squire Reference Squire2007). In contrast, Texas and Arkansas ranked 15th and 41st, respectively.
Although Arkansas is significantly less professionalized than Texas according to this ranking, one of the components of this ranking is identical between Texas and Arkansas: both legislatures’ regular sessions meet every other year, whereas the Illinois Legislature is a full-time legislature that meets every year. As a result, Arkansas’ and Texas’ senators are forced to concentrate their legislative activities in a much shorter span of time, which may put higher demands on their time—demands they must meet with less staff and resources than their fellow Illinois senators. In Illinois, where the legislature meets every year, the legislative demands faced by senators and the opportunities to engage in visible activities are much less concentrated. This larger time budget might allow Illinois senators to balance the competing demands of legislative tasks and campaign activities more efficiently, particularly given their greater staff. This suggests the need to expand studies of term length in more professionalized settings, to provide more evidence about the interaction of term length incentives, and the amount of available legislative resources.
Finally, the methodological and substantive issues explored here may inform the analysis of term length in other contexts. From a comparative perspective, the role of term length is likely to differ between presidential democracies, where executive and legislative terms have fixed duration, and parliamentary democracies, where terms are capped at a maximum length but are potentially variable. The relative uncertainty surrounding the exact timing of future elections in parliamentary systems might cause individual and collective legislative behavior to respond less closely to term length, in contrast to other contexts, such as the one analyzed here, where the end of terms can be perfectly anticipated. This suggests that policy reforms that increase the predictability of the timing of parliamentary elections, such as the one introduced in the United Kingdom with the Fixed-term Parliaments Act of 2011, will likely accentuate the effects of term length on legislative behavior. Policies like this one could be used to isolate potentially exogenous variation in time horizons, expanding our understanding of term length incentives in different democratic systems.
Supplementary Material
To view supplementary material for this article, please visit http://dx.doi.org/10.1017/psrm.2015.20