Introduction
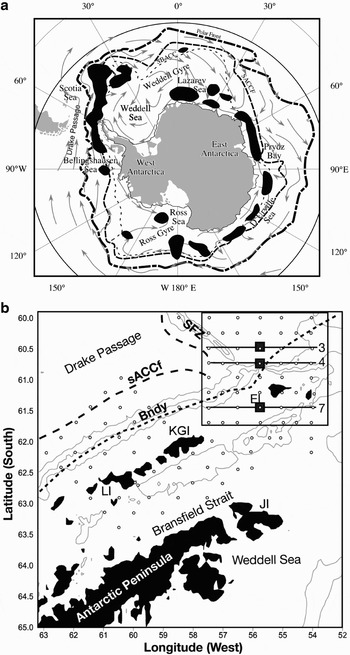
The Drake Passage region off the West Antarctic Peninsula is a major source of Antarctic krill (Euphausia superba Dana), the keystone species in the Southern Ocean (Spiridonov Reference Spiridonov1996, Atkinson et al. Reference Atkinson, Siegel, Pakhomov and Rothery2004, Siegel Reference Siegel2005) and therefore plays a vital role in the krill-based food web. In particular the South Shetland–Elephant Island and Bransfield Strait area (Fig. 1) is an important krill spawning and nursery ground (Spiridonov Reference Spiridonov1996, Atkinson et al. Reference Atkinson, Siegel, Pakhomov and Rothery2004), as well as an important area for the commercial krill fishery (Siegel Reference Siegel2005). Krill reproductive success, population size and supply to dependent predator populations here and in downstream areas are all highly variable on interannual and longer time scales (Priddle et al. Reference Priddle, Croxall, Everson, Heywood, Murphy, Prince, Sear and Sahrhage1988, Siegel & Loeb Reference Siegel and Loeb1995, Loeb et al. Reference Loeb, Siegel, Holm-Hansen, Hewitt, Fraser, Trivelpiece and Trivelpiece1997). Datasets collected in the Elephant Island area between 1980–1996 by German surveys and the US Antarctic Marine Living Resources (AMLR) Program revealed interannual fluctuations of krill reproductive success and salp (Salpa thompsoni (Foxton)) abundance that were significantly correlated with sea ice extent the previous winter (Siegel & Loeb Reference Siegel and Loeb1995, Loeb et al. Reference Loeb, Siegel, Holm-Hansen, Hewitt, Fraser, Trivelpiece and Trivelpiece1997). Early seasonal spawning and recruitment success of krill followed extensive sea ice development, presumably due to favourable feeding conditions associated with spring sea ice retreat and extensive winter sea ice cover. Massive salp blooms and poor krill recruitment success followed winters with low sea ice extent, characterized by lower productivity conditions favourable to salps (Atkinson et al. Reference Atkinson, Siegel, Pakhomov and Rothery2004). A significant relationship between krill density and sea ice was later demonstrated for the entire south-west Atlantic sector, reflecting the importance of sea ice in the major spawning and nursery areas (Atkinson et al. Reference Atkinson, Siegel, Pakhomov and Rothery2004).
a. Major regions of high krill concentrations (black areas) in the Southern Ocean relative to general hydrographic circulation (arrows), the Polar Front (PF), Southern Antarctic Circumpolar Current Front (sACCf, long dashes) and Boundary (Bndy, short dashes) modified from Spiridonov (Reference Spiridonov1996). b. US AMLR survey area in the Antarctic Peninsula region. Place names: EI = Elephant Island, KGI = King George Island, LI = Livingston Island, JI = Joinville Island, SFZ = Shackleton Fracture Zone. Included are the AMLR survey station grid (open circles) and Elephant Island region (boxed area) used for long-term data analyses relative to the climatic location of the sACCf and Bndy. Numbered lines (3, 4 and 7) are reference west–east transects used for isotherm variability relative to fixed points (black boxes).

Since the original studies linking Antarctic ecosystem variability to annual sea ice extent (Siegel & Loeb Reference Siegel and Loeb1995, Loeb et al. Reference Loeb, Siegel, Holm-Hansen, Hewitt, Fraser, Trivelpiece and Trivelpiece1997) major advances have been made in understanding circulation-climate variations and coupled ocean-atmospheric processes that influence the Southern Ocean (Carleton Reference Carleton2003). It now has been established that the coupled tropical ocean-atmosphere system known as El Niño–Southern Oscillation (ENSO) drives interannual cycles of sea ice extent around the Antarctic Continent, with alternating periods of more (La Niña) and less (El Niño) extensive sea ice (Karoly Reference Karoly1989, White et al. Reference White, Chen, Allan and Stone2002, Carleton Reference Carleton2003, Yuan Reference Yuan2004), and thus is a contributor to ecosystem variability. Tropical ENSO exerts a dominant influence that is most strongly expressed in the Pacific sector of the Southern Ocean. Other coupled ocean-atmospheric processes associated with ENSO underlie Southern Ocean ecosystem variability, particularly in the Antarctic Peninsula region most directly impacted by ENSO variability (Yuan Reference Yuan2004, Martinson et al. Reference Martinson, Stammerjohn, Iannuzzi, Smith and Vernet2008). However, identification of such processes is made difficult by the hydrographic and ecological complexity of this region (Makarov et al. Reference Makarov, Maslennikov, Solyankin, Spiridonov, Yakovlev and Sahrhage1988).
Hydrographic and ecological variability in the South Shetland–Elephant Island area is in large part due to variability of the location of the southern frontal systems of the Antarctic Circumpolar Current (ACC). These are the Southern Antarctic Circumpolar Current Front (sACCf), which is the southernmost current core of the ACC that carries waters with circumpolar characteristics, and the Southern Boundary (Bndy), which is the southern limit of the ACC (Orsi et al. Reference Orsi, Whitworth and Nowlin1995, Pollard et al. Reference Pollard, Lucas and Read2002), both of which approach the Antarctic continent within the confines of Drake Passage (Fig. 1). These circulation features affect the Southern Ocean ecosystem by providing macronutrients essential to support elevated primary and secondary production and a circumpolar transport mechanism for primary and secondary productivity, including krill (Spirodonov 1996, Tynan Reference Tynan1998, Ward et al. Reference Ward, Whitehouse, Brandon, Shreeve and Wood-Walker2003, Murphy et al. Reference Murphy, Watkins, Meredith, Ward, Trathan and Thorpe2004). In Drake Passage the sACCf and Bndy flow along the Antarctic Peninsula continental shelf until the sACCf is deflected northward by topography of the Shackleton Fracture Zone (Orsi et al. Reference Orsi, Whitworth and Nowlin1995; Fig. 1b). These features, bringing warm Upper Circumpolar Deep Water (UCDW) to krill spawning and nursery grounds in the Antarctic Peninsula region. North eastward flow of the ACC along the Antarctic Peninsula continental shelf in conjunction with clockwise circulation of the coastal Weddell Sea Gyre, comprise an essential part of the coupled advective-retentive circulation system critical for maintaining both local populations and the circumpolar distribution of krill (Spiridonov Reference Spiridonov1996).
Adding to complexity in the South Shetland Island and Bransfield Strait areas, ACC-derived water meets water from the western Weddell Sea continental shelf, as well as locally formed and coastal waters, resulting in heterogeneous coastal environments (Makarov et al. Reference Makarov, Maslennikov, Solyankin, Spiridonov, Yakovlev and Sahrhage1988, Whitworth et al. Reference Whitworth, Nowlin, Orsi, Locarnini and Smith1994). Here the continental shelf and coastal environments, like those along the West Antarctic Peninsula, support episodic spring/summer phytoplankton blooms and greatly elevated primary production relative to offshore waters and therefore can support abundant krill populations. However, massive phytoplankton blooms and primary production, hence food supply to krill populations, also exhibit a great degree of spatial and interannual variability probably due to climate and coupled ocean-atmosphere processes (Smith et al. Reference Smith, Dierssen and Vernet1996).
Climatic variability and population biology linkages are best established with consistent datasets collected at regular frequencies across large spatial scales and mulitdecadal time scales (McGowan Reference McGowan and Martinson1995). The long-term AMLR Program dataset (Fig. 2) is unique among Southern Ocean studies in having these characteristics and allows statistical verification of physical-biological relationships. Here we augment the 1980–1996 dataset utilized to demonstrate the relationship between annual sea ice extent, salp abundance and krill recruitment success (Loeb et al. Reference Loeb, Siegel, Holm-Hansen, Hewitt, Fraser, Trivelpiece and Trivelpiece1997) with hydrographic, primary productivity and zooplankton data collected during 1990–2004 AMLR surveys in order to examine ecosystem variability in relation to ENSO over a two decade time span. The objectives of this study are as follows:
• statistically link interannual variability of sea ice extent, chlorophyll a (chl a) concentrations, krill, salp and copepod abundance to ENSO forcing using the 1980–2004 Elephant Island dataset;
• elucidate hydrographic conditions associated with ENSO-driven ecosystem variability;
• relate interannual and longer-term variations in hydrographic conditions and ecosystem structure to dynamics of large-scale coupled atmospheric-oceanic processes driven by ENSO.
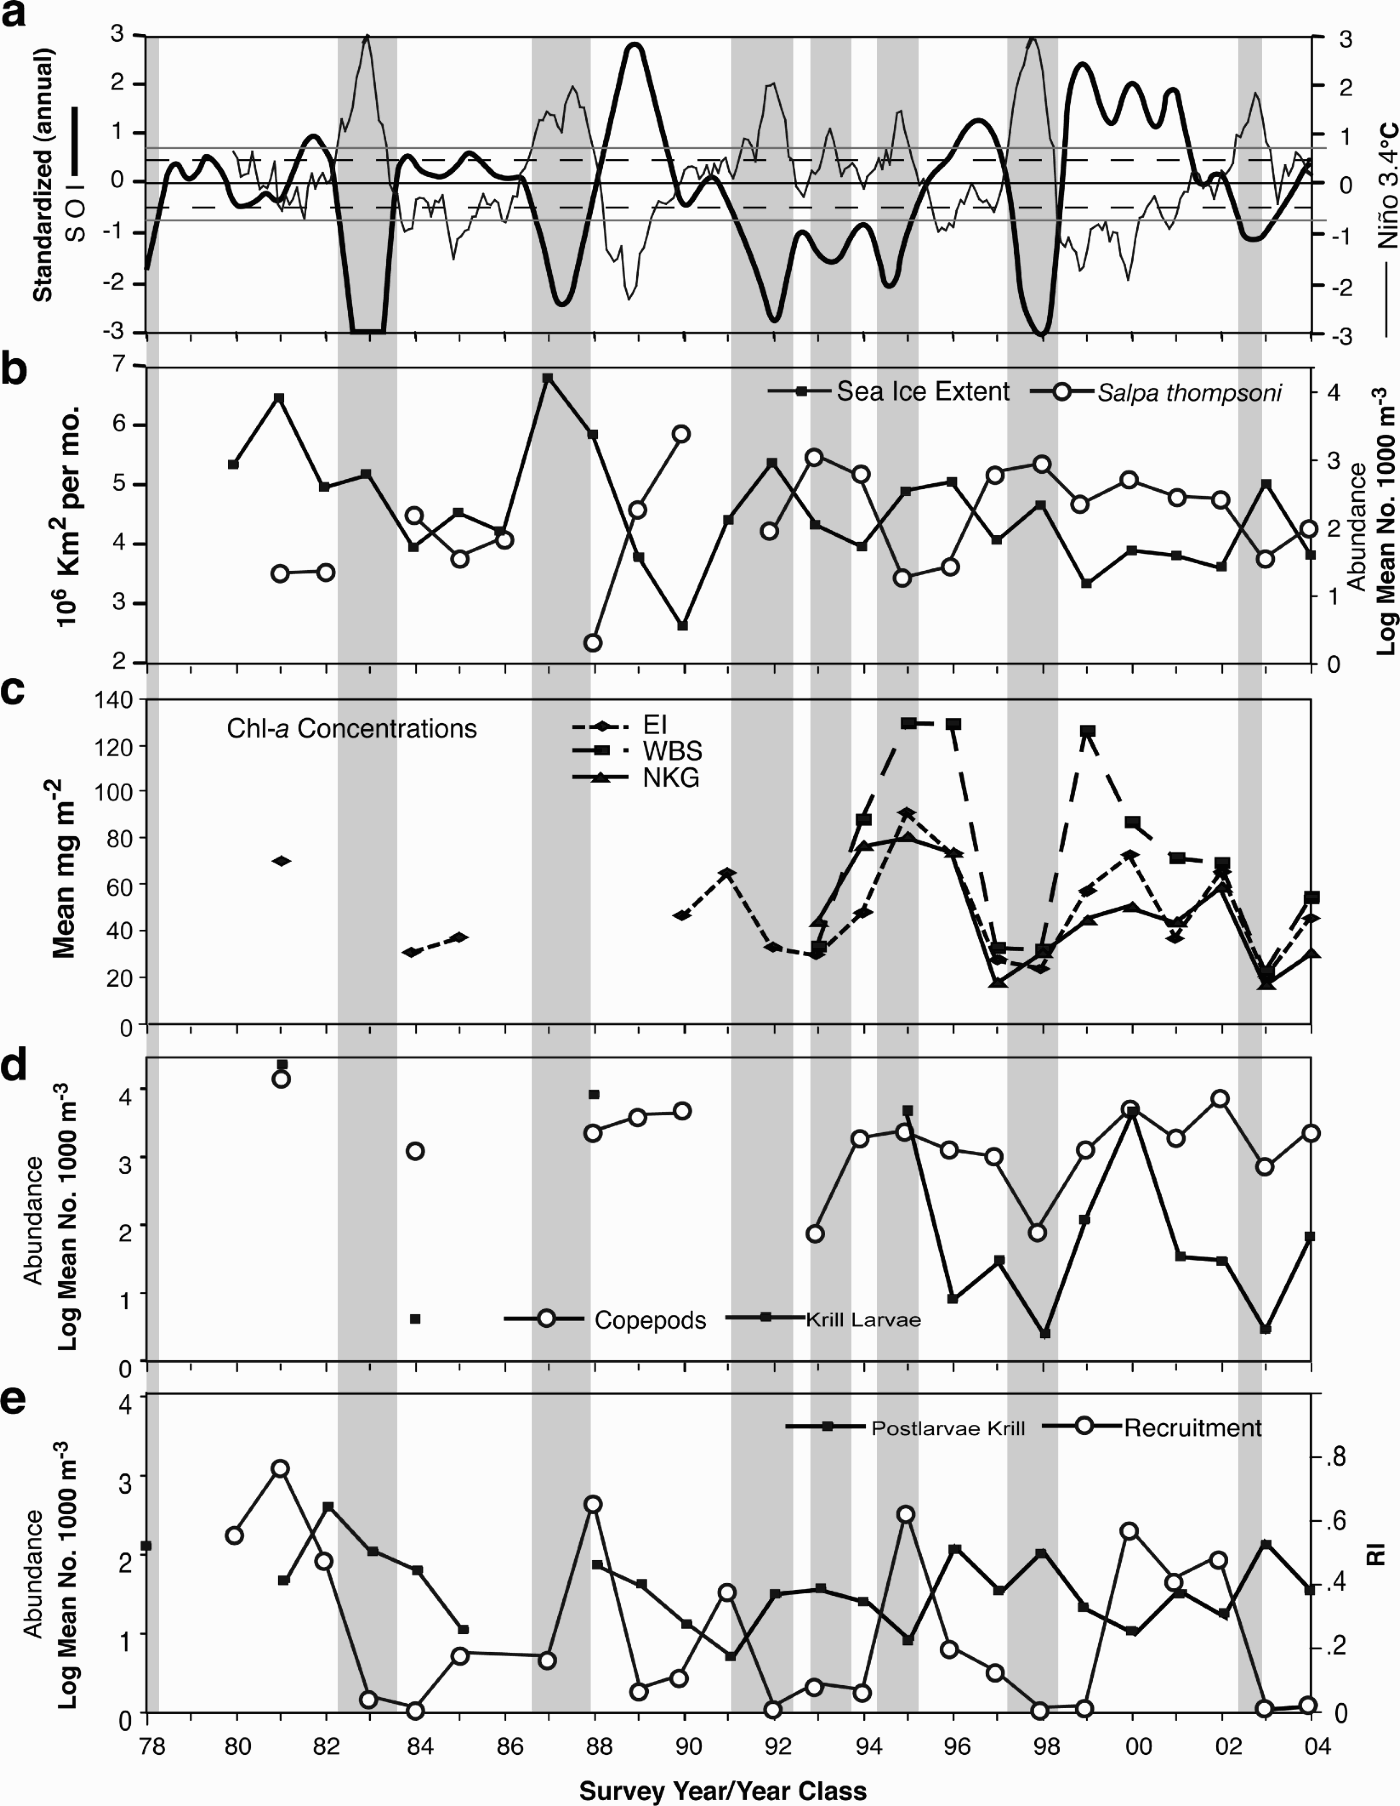
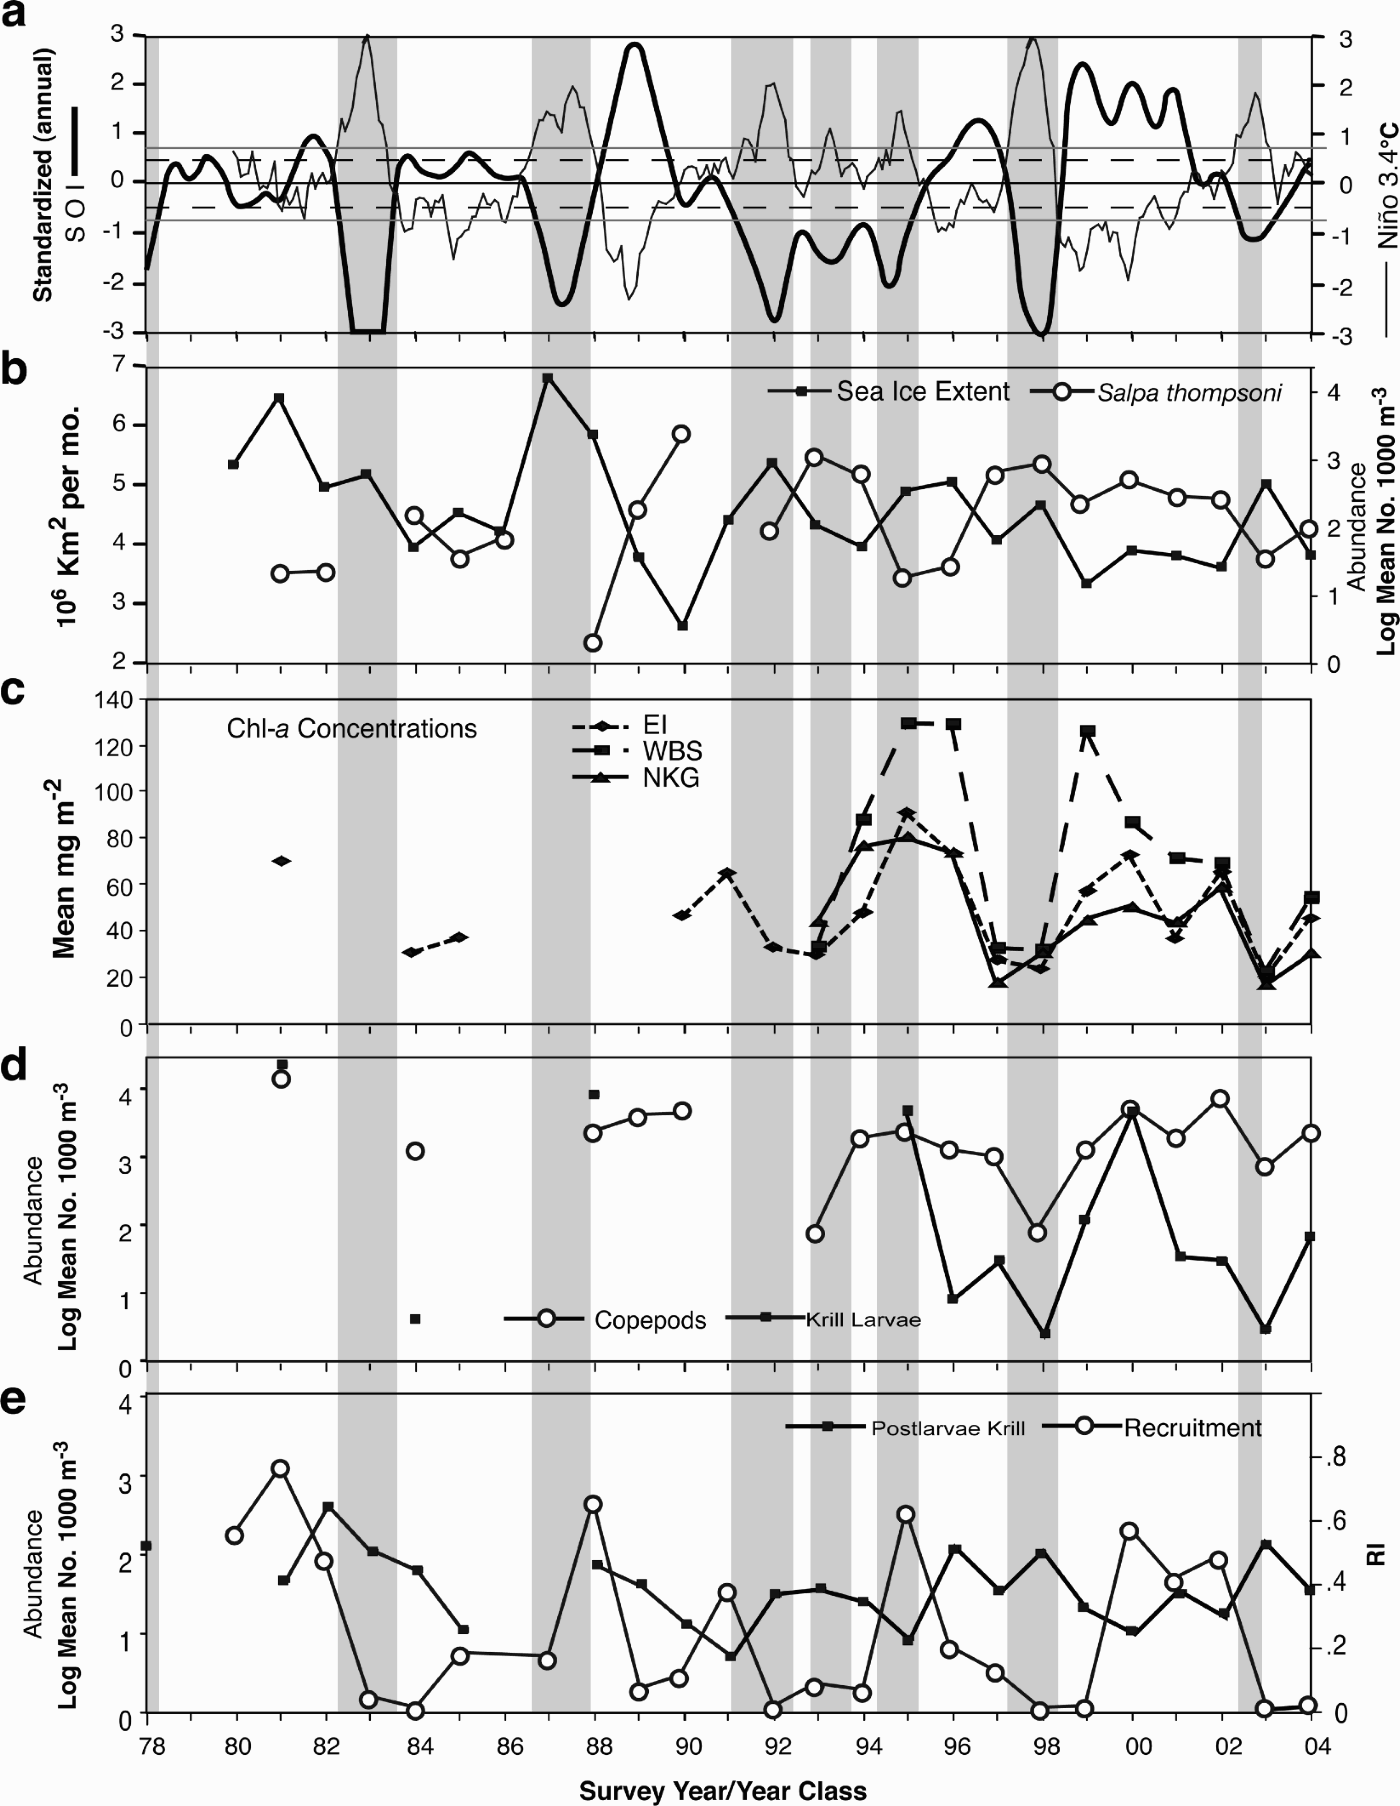
Time series in support of, or constructed from, observations made in the Elephant Island region showing fluctuations of: a. the 1979–2004 Southern Oscillation Index (SOI) and Niño 3.4 Index, b. sea ice extent and Salpa thompsoni abundance, c. integrated 0–100 m chl a concentrations (including West Bransfield Strait (WBS), and North King George Island (NKG) areas), d. copepod and larval krill abundance, e. postlarval krill abundance and recruitment (R1) of the previous year class. Shaded bars indicate El Niño events.
Materials and methods
AMLR survey programme overview
Standardized surveys, initiated around Elephant Island in 1989 by the AMLR programme, were conducted along north–south transects with stations spaced at c. 55 km intervals (Fig. 1b). The survey was extended westward in 1993 to include King George Island and again in 1997 to include the area around Livingston Island. A further extension into the Joinville Island area occurred in 2002. The AMLR field seasons generally include two month-long summer surveys during January–February and February–March of each year. The original Elephant Island area has been regularly surveyed to maintain coherency of a long-term data base extending from the mid-1970s to present (Siegel & Loeb Reference Siegel and Loeb1995, Loeb et al. Reference Loeb, Siegel, Holm-Hansen, Hewitt, Fraser, Trivelpiece and Trivelpiece1997). Between 40–70 and 19–50 stations were occupied in the Elephant Island and South Shetland–Joinville Island areas, respectively, during each survey that took place from 1993–2004. Sampling was limited to 18 net tows during March 1997 and no survey was done in this region during January 2000.
Hydrography
Hydrographic sampling at each survey station was done with a Sea-Bird SBE-9/11 CTD system mounted on a General Oceanics 12-bottle Rosette, or a Sea-Bird SBE32 Carousel sampler (Holm-Hansen et al. Reference Holm-Hansen, Hewes, Villafañe, Helbling, Silva and Amos1997, Amos Reference Amos2001). The CTD profiles extended from the surface to 750 m or to within 10 m of the bottom at sites where the bottom was shallower than 750 m. The CTD measurements were processed using standard procedures and algorithms. Vertical profiles of temperature and salinity are available for all cruises except March 1997. Details of the CTD data collection and processing are given in Amos (Reference Amos2001).
Phytoplankton
Water samples were obtained on each vertical profile from 10-litre Niskin bottles mounted on the Rosette. Samples were taken at standard depths of 5, 10, 15, 20, 30, 40, 50, 75, 100, 200 and 750 m or within 10 m of the bottom at shallow stations. Estimates of phytoplankton biomass were obtained by measuring chl a concentrations in all samples collected between the surface and 200 m. Water samples were filtered with Whatman GF/F filters, extracted in absolute methanol in the dark for four hours and fluorescence measured with a Turner Designs fluorometer. The 0–100 m integrated chl a values (mean mg-2 from all surveys each summer) are used in this study; these are directly related to primary production rates. Detailed descriptions of the chlorophyll sampling and analysis techniques are given in Holm-Hansen et al. (Reference Holm-Hansen, Hewes, Villafañe, Helbling, Silva and Amos1997, Reference Holm-Hansen, Amos and Hewes2000).
Krill and zooplankton
Beginning in 1993 zooplankton was sampled with a 1.8 m Isaacs-Kidd Midwater Trawl fitted with 505 µm mesh plankton net and a calibrated General Oceanics flow meter. All tows were fished obliquely from 170 m or c. 10 m above bottom in shallow waters, monitored with a real-time depth recorder. Tows were usually at 2 knots, for 20–30 minutes, and filtered c. 2500–4000 m3. Zooplankton samples were processed onboard within two hours of net retrieval. All postlarval krill and salps were removed and enumerated from samples ≤ 2 litre for larger catches, abundance estimates were based on 1 to 2 litre subsamples. All postlarval krill in samples with < 100 individuals were measured, sexed and staged according to Makarov & Denys (Reference Makarov and Denys1981); in larger samples at least 100 krill were analysed. For clarification, postlarval krill include all size/age/maturity categories from one-year old juvenile and immature stages on through reproductively mature stages; larval krill represent krill reproductive effort during each summer field season. Other taxa were identified to species when possible and enumerated. Abundant and/or frequent taxa include large copepods (notably Metridia gerlachei Giesbrecht, Calanus propinquus Brady, Calanoides acutus Giesbrecht and Rhincalanus gigas Brady), salps (Salpa thompsoni and, after 1997, Ihlea racovitzai (van Beneden)), larval and postlarval stages of Euphausia superba (Antarctic krill) and other euphausiids (Thysanoessa macrura Sars and E. frigida Hansen) chaetognaths, amphipods (Themisto gaudichaudii Guerin, Vibilia antarctica Stebbing, Cyllopus magellanicus Dana, C. lucasii Bate and Primno macropa Guerin-Meneville) and pteropods (Limacina helicina (Phipps), Clio pyramidata Linn. and Spongiobranchia australis d'Orbigny). These taxa comprise > 90% of zooplankton biomass in the Antarctic Peninsula region (Schnack-Schiel & Mujica Reference Schnack-Schiel, Mujica and El-Sayed1994). Mean concentrations (numbers 1000 m-3) from each summer survey are treated here.
Prior to 1993, AMLR zooplankton samples were collected using 0.60 m diameter bongo nets fitted with 333 and 505 µm mesh. The datasets obtained from these net samples include only abundance of three biomass-dominant copepod species (Calanoides acutus, Calanus propinquus, Metridia gerlachei), Salpa thompsoni, larval and postlarval krill, and postlarval Thysanoessa macrura and E. frigida. Although limited, these data are adequate to demonstrate fluctuations between major zooplankton components.
Additional krill, salp and copepod abundance data from the Elephant Island area for 1980–1993 were taken from the datasets reported in Shulenberger et al. (Reference Shulenberger, Wormuth and Loeb1984), Loeb & Shulenberger (Reference Loeb and Shulenberger1987), Park & Wormuth (Reference Park and Wormuth1993), Siegel & Loeb (Reference Siegel and Loeb1995), Loeb et al. (Reference Loeb, Siegel, Holm-Hansen, Hewitt, Fraser, Trivelpiece and Trivelpiece1997). Proportional krill recruitment indices for 1980–2003 were obtained from Siegel et al. (Reference Siegel, Bergström, Mühlenhardt-Siegel and Thomasson2002) and Siegel (personal communication 2007, based on AMLR krill length-frequency and abundance data). Recruitment indices provide a measure of success for a given Antarctic krill year class (Siegel et al. Reference Siegel, Bergström, Mühlenhardt-Siegel and Thomasson2002). Proportional recruitment (R1 and R2) values are derived from the ratio of numbers of individuals in age class 1 (one year old) and age class 2 (two year old), respectively, to the total number of krill collected each season. When more than one survey is available for a season, the values represent the inverse variance weighted mean recruitment for that season (Siegel et al. Reference Siegel, Bergström, Mühlenhardt-Siegel and Thomasson2002). Primarily R1 indices are utilized here. Because of interannual latitudinal shifts in the distribution patterns of one year old krill these are conservative values that may sometimes underestimate actual recruitment (Siegel et al. Reference Siegel, Bergström, Mühlenhardt-Siegel and Thomasson2002).
Sea ice indices
Sea ice indices representing spatial and temporal extent were derived for an area measuring 1.25 × 10⁶ km2 off the north-western side of the Antarctic Peninsula using satellite images of sea ice concentrations (passive microwave radiometer data) published electronically by the National Sea and Ice Data Center (http://nsidc.org/data/seaice_index). This index was developed and described by Hewitt (Reference Hewitt1997) for use in initial analyses of krill recruitment success (Siegel & Loeb Reference Siegel and Loeb1995) and has been maintained since for internal consistency. For this study, annual anomalies were obtained by subtracting the long-term 1978–2003 mean value. These indices are derived from the same source as, and are consistent with, other sea ice indices developed for less and more extensive regions off the West Antarctic Peninsula (Hewitt Reference Hewitt1997).
Other data sources
Chlorophyll a values measured during the First International BIOMASS Experiment (FIBEX), which took place in 1981, and the Second International BIOMASS Experiment (SIBEX), which took place in 1984 and 1985, were obtained from median integrated 0–50 m values in the South Shetland Island area (Priddle et al. Reference Priddle, Brandini, Lipski, Thorley and El-Sayed1994). These values, reported to be statistically similar to the means were doubled to approximate 0–100 m concentrations, as prescribed by Priddle et al. (Reference Priddle, Brandini, Lipski, Thorley and El-Sayed1994). Although statistical analyses utilize only Elephant Island area chl a values, chl a values from other AMLR survey areas in western Bransfield Strait and north of King George Island are presented in Fig. 2c to demonstrate similar interannual variations in primary production across the region (n = 14, r 2 = 0.62–0.72, P < 0.001).
The Southern Oscillation Index (SOI) and Niño 3.4 index are measures of large-scale atmospheric and oceanic fluctuations associated with warm El Niño and cold La Niña episodes (Carleton Reference Carleton2003). The SOI, which is the difference in air pressure anomaly between Tahiti and Darwin, Australia, is a measure of large-scale fluctuations in air pressure occurring between the Western and Eastern Tropical Pacific during ENSO events. The negative phase of the SOI represents below-average air pressure at Tahiti and above-average air pressure at Darwin. Prolonged periods of negative SOI values coincide with unusually warm ocean water across the Eastern Tropical Pacific typical of El Niño episodes. Prolonged periods of positive SOI values coincide with unusually cold ocean water across the Eastern Tropical Pacific typical of La Niña episodes. The Niño 3.4 index reflects departures of sea surface temperatures from the long-term mean value in the Eastern Tropical Pacific between 5°N–5°S and 170°W–120°W. Time series of the SOI and Niño 3.4 index were obtained from the US National Weather Service Climate Prediction Center and used here to indicate ENSO events for the time covered by the AMLR datasets.
Data analyses
Relationships between plankton assemblages, environmental conditions, and ENSO indices were examined by computing cross correlations between the mean summer concentrations of postlarval krill, copepods, salps (Salpa thompsoni), larval krill and chl a; sea ice extent from the previous fall-winter-spring; krill recruitment success from the previous years' spawn (R1); and monthly values of the SOI and Niño 3.4 indices. Correlations were computed for zero-lag and a one-year lag. Zero-lag correlations of krill recruitment success (R1) are based on the proportions of juveniles to total krill collected each year and reflect the population impact of individuals spawned the previous summer. In contrast, as indicated in Fig. 2e, the one-year lag correlations reflect conditions associated with reproductive and recruitment success from the previous summer. Significance levels reported here are one-tailed to demonstrate coherency between relationships in the zero- and one-year lagged correlations however most of these are significant at P < 0.05 (two-tailed).
The dominant frequencies of individual time series were determined using wavelet analysis (Torrence & Compo Reference Torrence and Compo1998). Wavelet analysis resolves localized variations in the strength of a signal (i.e. the wave) within a time series. The original time series is decomposed into a time-frequency space, which allows identification of the dominant components (i.e. the wavelets) that make up the wave. The analysis used here is based on Morlet wavelets (Combes et al. Reference Combes, Grossmann and Tchamitchian1990), which give good frequency resolution but smear dominant signals in the time domain. Cross-wavelet analyses were also done on combinations of individual time series to determine correlations between different environmental and biological processes.
Two-way ANOVA applied to individual sample data for abundant and/or frequently collected zooplankton taxa in the Elephant Island area during each survey conducted in 1992–1998 and 1999–2004 were used to determine significant seasonal (January, February–March) and between-period variability. Results significant at P < 0.05 for the combined effects of these (period + season) were considered sufficient evidence for an ecological change between the two six-year periods.
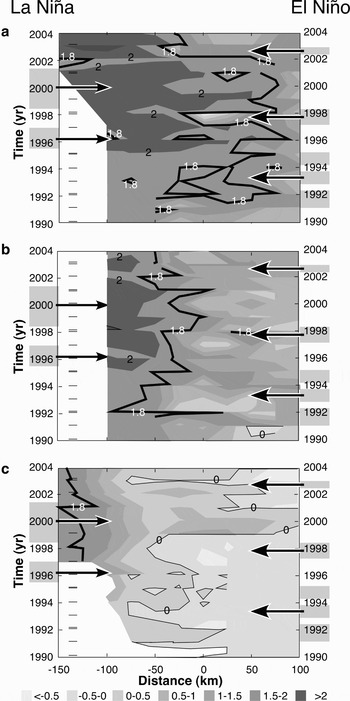
Space-time diagrams of temperature variability for 1990–2004 were constructed using temperatures at 350 m depth along three east–west lines across the Elephant Island area that were generally sampled during each survey (Fig. 1b). Temperature variability at 350 m in this region is reflective of changes in the sACCf and Bndy. Temperatures of 2°C correspond to oceanic Upper Circumpolar Deep Water (UCDW), 1.8°C to the sACCf and 0°C to the Bndy. The isotherm locations along these lines were determined as distances east (+) and west (-) of a reference point (0) at the centre of the transect, as indicated by black boxes in Fig. 1b.
Results
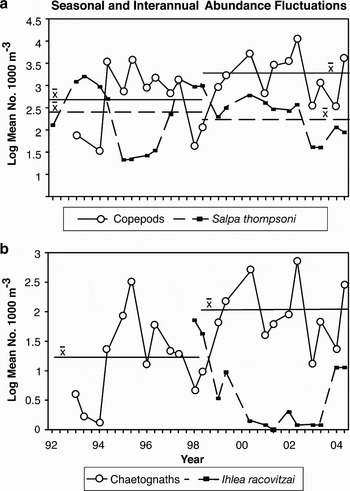
The 25-year Elephant Island dataset (Fig. 2) includes krill abundance and recruitment success over six-to-seven ENSO cycles. It also includes hydrographic, chl a and zooplankton net sample measurements spanning this period but with greatest representation from 1990–2004 (Figs 2 & 3). Within the latter period, copepods typically demonstrate two-to-three fold seasonal abundance increases each summer, but fluctuations of one-to-two orders of magnitude (Fig. 3) are accompanied by abundance changes in zooplankton taxa representative of rich “copepod years” (Calanoides acutus, Rhincalanus gigas, and Calanus propinquus; chaetognaths; pteropods) and depauperate “salp years” (S. thompsoni, krill and the euphausiid Thysanoessa macrura). These conform to variable representation of copepod-dominated assemblages of the ice free oceanic zone (the “West Wind Drift”) and of the coastal seasonal sea ice zone (the “East Wind Drift”) summarized by Jażdżewski et al. Reference Jażdżewski, Kittel and Lotocki1982, Schnack-Schiel & Mujica (Reference Schnack-Schiel, Mujica and El-Sayed1994).
Seasonal and interannual abundance fluctuations of a. copepods and Salpa thompsoni, and b. chaetognaths and Ihlea racovitzai. Horizontal lines indicate mean abundance based on all surveys conducted during the 1992–1998 and 1999–2004 periods. Copepods and chaetognaths are most abundant in oceanic water; the salp I. racovitzai is a marker for Weddell Sea water.

The transition between salp and copepod dominance, and zooplankton-poor and -rich assemblages, can be abrupt, taking place within a period of less than two months (e.g. 1994, 1997 and 2004; Fig. 3), and can separate multiyear sequences of “salp years” and “copepod years”. Sequences of “copepod years” also appear favourable to krill reproductive success and recruitment while those of “salp years” do not (Fig. 2). The rapidity and magnitude of these ecosystem changes indicate that the underlying cause is physical in origin rather than biological (Makarov et al. Reference Makarov, Maslennikov, Solyankin, Spiridonov, Yakovlev and Sahrhage1988). Furthermore, the three-to-five year quasi-periodicity of salp and copepod abundance fluctuations and krill recruitment success from 1980–2004 indicates persistent underlying changes in the environment consistent with the timing of ENSO (Fig. 2).
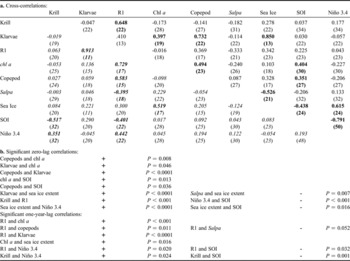
Cross correlations based on the SOI, Niño 3.4 Index, sea ice extent, chl a concentrations, copepod and salp abundance, and abundance of krill larvae and postlarvae and krill recruitment show statistically significant relationships (Table I). The zero-lag results show significant correlations among and between biological and environmental factors: copepod and krill larvae concentrations are positively correlated with chl a concentrations and with each other; copepod and chl a concentrations are positively correlated with SOI; krill larvae concentrations are positively correlated with sea ice extent; sea ice extent is positively correlated with the Niño 3.4 index; S. thompsoni concentrations and sea ice extent are negatively correlated with SOI; the SOI and Nino 3.4 index are negatively correlated. Furthermore, krill abundance is positively correlated with recruitment success (R1). The significant one-year lag correlations are primarily with the environmental and biological factors that affect krill reproductive success and recruitment: good recruitment success follows summers with elevated concentrations of chl a, copepods and krill larvae. Additionally, krill concentrations are negatively correlated with SOI the preceding summer. The periodicity associated with variability in postlarval krill abundance, krill recruitment and salp time series obtained using Morelet wavelet analysis showed significant peaks (P < 0.05) at three-to-four years, which corresponds to ENSO-scale environmental variability.
a. Cross correlation coefficients (r 2) between indicated time series, 1980–2004. (N) is number of common data points in the two time series. Klarvae are krill larvae, representative of reproductive effort each year; R1 is proportional recruitment of each year class, proportions of one-year-old to total krill measured the following year. Zero-lag cross-correlations are above the diagonal; one-year-lag correlations are in italics below the diagonal. Significant correlations are indicated by bold type. b. Summary of significant correlations between the time series (probability levels for one-sided tests; double these for two-sided tests).

Temperature time series (Fig. 4) along east–west sections across the Elephant Island area provide insight into hydrographic processes that underlie the statistically significant associations between interannual variations in zooplankton assemblages, chl a and climate off the West Antarctic Peninsula. Temperatures of 2°C correspond to oceanic UCDW, 1.8°C to the sACCf and 0°C to the Bndy (Orsi et al. Reference Orsi, Whitworth and Nowlin1995). Absence of the 2°C isotherm within 100 km of the reference point on lines 3 and 4 during 1990–1994 was coincident with westward displacement of the 1.8°C and 0°C isotherms along lines 4 and 7, indicating that the sACCf and Bndy were located in the north-western part of the AMLR study region. This corresponded to a prolonged El Niño event and negative SOI (Fig. 2a). The switch to La Niña conditions and positive SOI in 1996 coincided with appearance of the 2°C isotherm and eastward shifts of the 1.8°C and 0°C isotherms, indicating eastward movement of the sACCf and Bndy. The 60 km displacement of the 1.8°C isotherm between 1992 and 1995 is within observed variability of the sACCf location (Sprintall Reference Sprintall2003; Fig. 5a). In 1998 westward movement of the 2.0°C, 1.8°C and 0°C isotherms were associated with an extension of colder water into the western part of the study region. During this time the high latitude salp Ihlea racovitzai, a marker of Weddell Sea water (Foxton Reference Foxton1971), was quite abundant in the survey area (Fig. 3b). This coincided with a strong El Niño event with extremely low SOI (Fig. 2a). From 1999–2004 the isotherm pattern was relatively stable with reduced presence of 0°C water in the eastern part of the study region. This period was generally characterized by positive SOI and La Niña or neutral conditions. The exception was 2003 when a westward extension of cold water between Elephant and King George Islands (Fig. 4c) was associated with negative SOI (Fig. 2a); increased I. racovitzai abundance occurred the following summer (Fig. 3b).
Time series of temperature (°C) variability at 350 m from 1990–2004, computed relative to the centre of three west–east transects shown on Fig. 1b: a. line 3, b. line 4, and c. line 7. Temperatures of 2°C correspond to oceanic UCDW, 1.8°C to the sACCf and 0°C to the Bndy. Bars on the Y-axis indicate the numbers of temperature measurements (i.e. surveys) used to construct each time series. White areas indicate times when no measurements were made along the individual transects. Arrows are at midpoints of La Niña and El Niño periods as indicated in Fig. 2a. Eastward extension of warmer temperatures toward and beyond the reference point (0 and + km) on each line occurs when the sACCf and Bndy move into the Elephant Island area. These coincide with La Niña events. Westward extension of colder temperatures toward and beyond the reference point (0 and - km) on each line occurs when the sACCf and Bndy retract and coastal waters prevail across the area. These coincide with El Niño events.

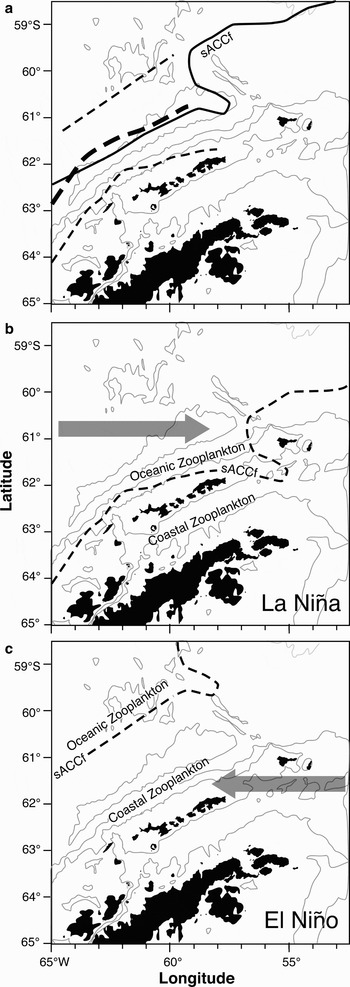
Depictions of how variable representation of oceanic and coastal zooplankton assemblages may result from movements of the sACCf. a. Solid line is the generalized location of the sACCf along the continental slope region of the Antarctic Peninsula (Orsi et al. Reference Orsi, Whitworth and Nowlin1995). Thin dashed lines indicate equatorward and poleward displacements of the sACCf in Drake Passage relative to its climatological location (heavy dashed line) according to Sprintall (Reference Sprintall2003). b. Poleward movement of the sACCf during La Niña brings zooplankton characteristic of oceanic Drake Passage waters south-eastward to the South Shetland Island shelf regions. c. Equatorward movement of the sACCf and enhanced flow from the clockwise Weddell gyre can promote north-westward transport of coastal zooplankton onto the northern island shelf regions and beyond.

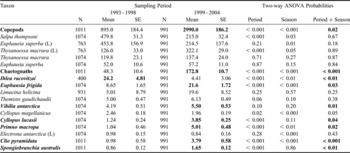
The changes in climatic and hydrographic conditions indicated here (Figs 2a & 4) were also associated with changes in the absolute and relative abundance of dominant and frequent zooplankton taxa (Table II, Fig. 3). Two-way ANOVA indicate that copepods and chaetognaths, along with Euphausia frigida, amphipods Vibilia antarctica, Cyllopus lucasii and Primno macropa, pteropods Clio pyramidata and Spongiobranchia australis, demonstrated significant period + season abundance increases after the 1998 El Niño (P < 0.05) that are consistent with the increased influence of oceanic ACC waters. Between-period abundance decreases after 1998 were significant for both S. thompsoni and I. racovitzai (P < 0.001).
Mean and standard error of abundance for frequently occurring zooplankton taxa in the Elephant Island area during 1993–1998 and 1999–2004 sampling periods. (L) Denotes larval stages. Probabilities derived from two-way ANOVA of (N) sample abundance values (No. 1000 m-3) for seasons (January and February–March surveys) and sampling periods. Significant abundance differences (bold) between the two six year periods are based on combined period and season P < 0.05.

Discussion and summary
Our results show that krill recruitment success and population size in this season are associated with elevated primary production, larval production and copepod abundance the previous summer. Furthermore, copepod abundance and krill reproductive effort (larval abundance) during summer are directly linked to primary production (chl a) and all of these are positively correlated with the ambient SOI conditions. In contrast, salp abundance is related to sea ice extent the previous winter, which is negatively correlated with SOI and positively correlated with the Niño 3.4 index. Furthermore, the temperature time series indicates shifts in the location of the southern front and boundary of the Antarctic Circumpolar Current, and variable influence of oceanic UCDW and Weddell Sea shelf water, coincidental with changes in the SOI and La Niña and El Niño conditions. These results highlight the importance of climate and coupled atmospheric-oceanic-sea ice processes underlying ecosystem variability in the Antarctic Peninsula region.
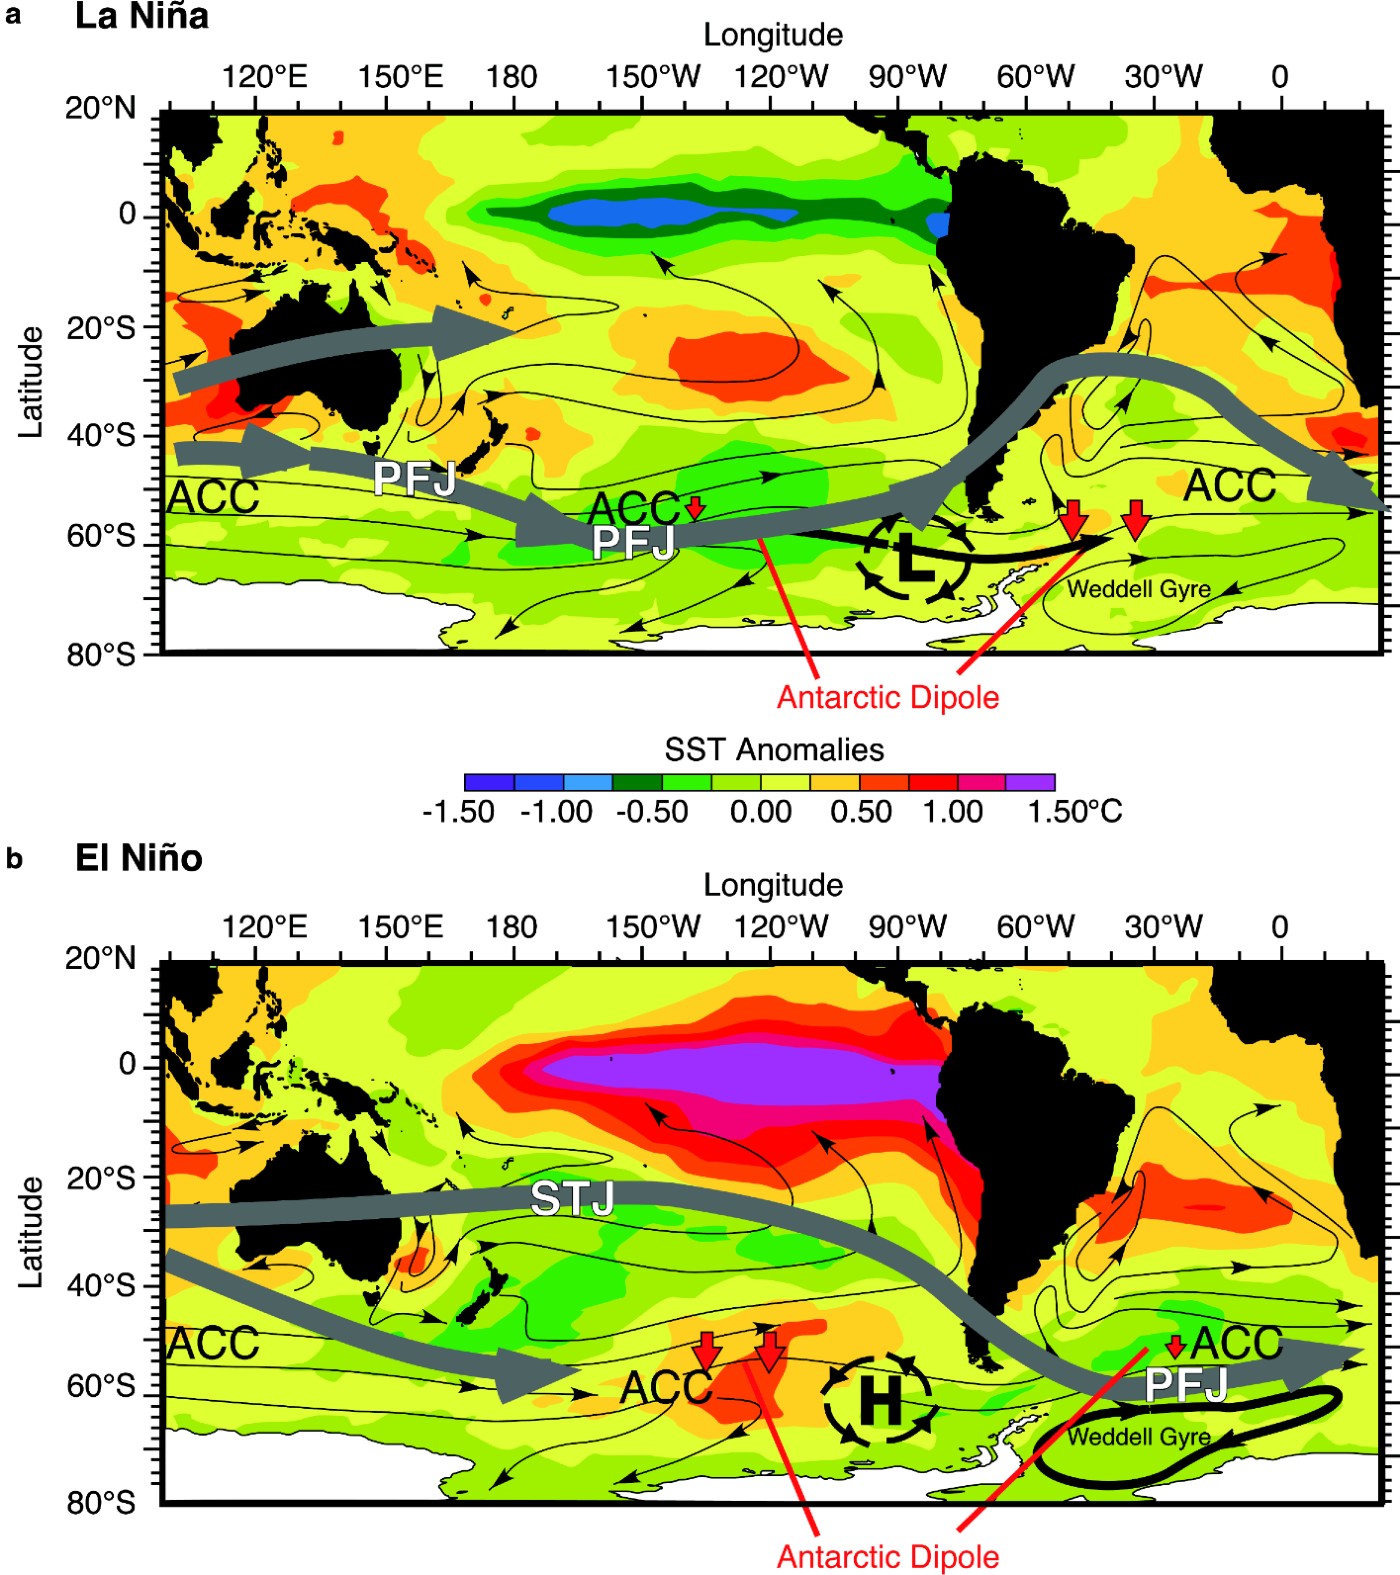
The climate system in the eastern Pacific and western Atlantic sectors of the Southern Ocean, including Drake Passage, is strongly impacted by meridional (southward) atmosphere teleconnections instigated in the western tropical Pacific Ocean by ENSO variability (Karoly Reference Karoly1989, Carleton Reference Carleton2003, Yuan Reference Yuan2004). In response to this external forcing, the high-latitude Pacific South America (PSA) pattern of Sea Level Pressure (SLP) variability, and corresponding Antarctic Dipole pattern of sea surface temperature (SST) variability, fluctuate nearly one-to-one with tropical ENSO variability (Yuan Reference Yuan2004). This ENSO signal is subsequently propagated eastward around the remainder of the Southern Ocean (White et al. Reference White, Chen, Allan and Stone2002). These PSA and Antarctic dipole patterns of basin-scale climate variability influence regional climatic conditions in the vicinity of the West Antarctic Peninsula (Fig. 6), with warm SST anomalies, strong northwesterly wind anomalies and expanded sea ice extent fluctuating in phase with tropical La Niña and cool SST anomalies, weak northwesterly wind anomalies and retracted sea ice extent fluctuating in phase with tropical El Niño (Gloerson & White Reference Gloersen and White2001, Yuan Reference Yuan2004).
Schematic representations of the Antarctic Dipole characterized by out-of-phase relationships between the South Pacific and South Atlantic: Sea Surface Temperature (SST) anomaly composites, schematic jet streams (thick grey arrows) and sea surface circulation patterns (black arrows), anomalous high (H) and low (L) pressure centres and anomalous heat fluxes (red arrows) due to mean meridional circulation for La Niña and El Niño conditions (modified from Yuan Reference Yuan2004). Oscillations between the strength of Polar Frontal Jets (PFJ) and Subtropical Jets (STJ) in the South Pacific and South Atlantic are triggered by ENSO. a. During La Niña the PFJ in the South Pacific and STJ in the South Atlantic are strengthened; northerly winds off the Antarctic Peninsula are stronger and more frequent; Weddell Sea gyral circulation relaxes due to weakened PFJ in the South Atlantic. b. During El Niño the PFJ in the South Pacific and STJ in the South Atlantic are weakened; northerly winds off the Antarctic Peninsula are less frequent and weakened; Weddell Sea gyral circulation spins up due to intensified PFJ in the South Atlantic (Martinson & Iannuzzi Reference Martinson and Iannuzzi2003, Yuan Reference Yuan2004, Martinson et al. Reference Martinson, Stammerjohn, Iannuzzi, Smith and Vernet2008).
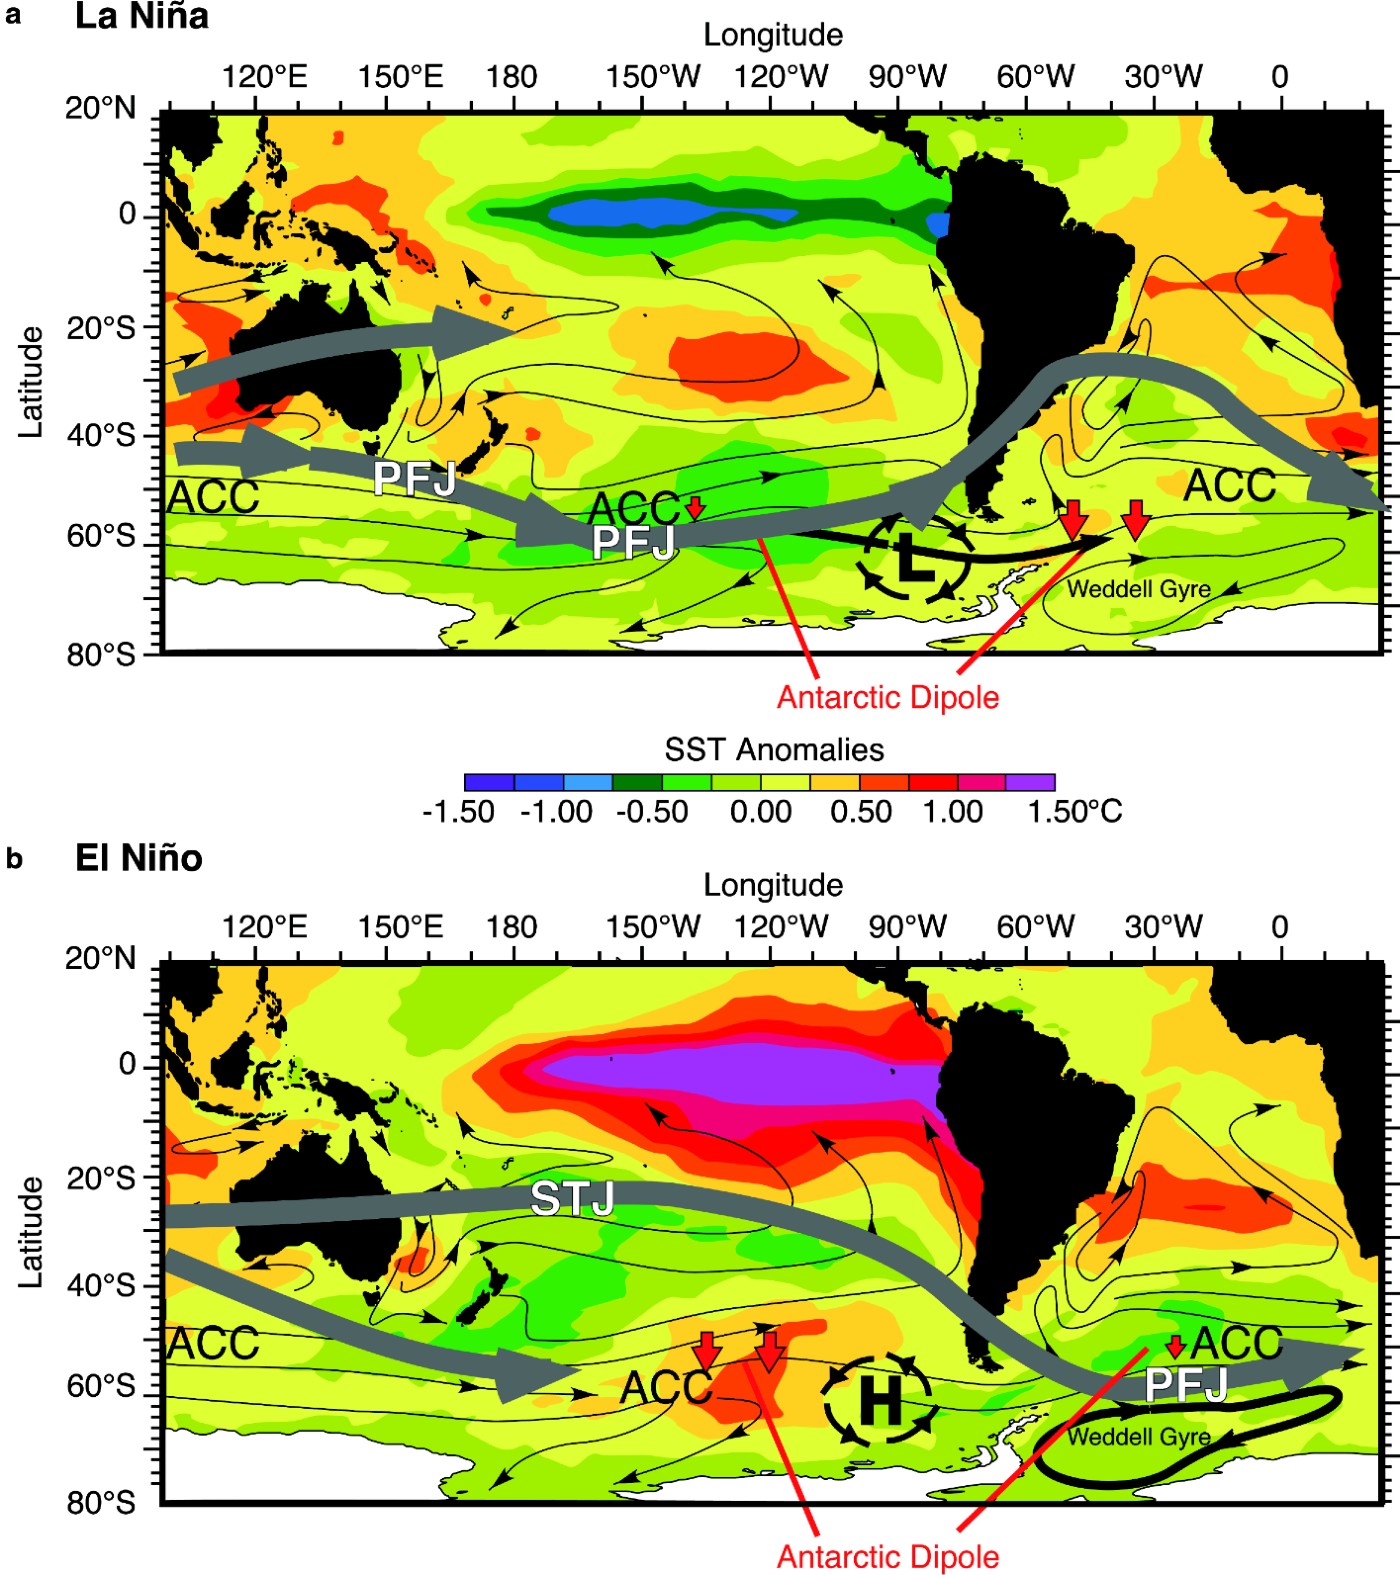
South-eastward displacement of the sACCf and Bndy, copepod-dominated oceanic “West Wind Drift” zooplankton assemblage and decreased Weddell Sea influence during La Niña (Fig. 5b) are consistent with a) intensified Polar Frontal Jets (PFJ) and strong north-westerly winds in the South Pacific, b) decreased PFJ in the South Atlantic, and c) reduced Weddell gyre influence in the AMLR survey area (Fig. 6a). Enhanced chl a concentrations and primary productivity under these conditions could result from nutrients supplied to surface waters by the sACCf (Tynan Reference Tynan1998) and/or iron fertilization resulting from proximity of the sACCf to island and continental shelves (i.e. terrestrial sources of iron; de Baar & de Jong Reference De Baar, De Jong, Turner and Hunter2001, Pollard et al. Reference Pollard, Lucas and Read2002), increased storm-driven mixing between oceanic and coastal waters (Martinson et al. Reference Martinson, Stammerjohn, Iannuzzi, Smith and Vernet2008), and water column stratification that promotes phytoplankton blooms (Mitchell & Holm-Hansen Reference Mitchell and Holm-Hansen1991). These ideas are supported by results from recent studies in the AMLR survey region (Hewes et al. Reference Hewes, Reiss, Kahru, Mitchell and Holm-hansen2008, Reiss et al. personal communication Reference Reiss, Hewes and Holm-Hansen2008) that link phytoplankton productivity here to mixing of ACC and Weddell Sea shelf waters and subsequent water column stratification and temperature characteristics. Good krill reproduction and subsequent recruitment success result from favourable feeding conditions associated with elevated phytoplankton biomass (chl a) during spring and summer (Siegel & Loeb Reference Siegel and Loeb1995).
Conversely, north-westward displacement of the sACCf and Bndy, low primary production, a depauperate coastal zooplankton assemblage characteristic of the “East Wind Drift” and increased Weddell Sea water influence during El Niño (Fig. 5c) are consistent with weakened PFJ in the South Pacific and spinning up of the clockwise Weddell Sea gyre by intensified PFJ in the South Atlantic (Martinson & Iannuzzi Reference Martinson and Iannuzzi2003, Yuan Reference Yuan2004; Fig. 6b). Low chl a concentrations then do not promote krill reproductive success but are favourable for S. thompsoni (Atkinson et al. Reference Atkinson, Siegel, Pakhomov and Rothery2004); elevated concentrations of Ihlea racovitzai during these times result from increased input of Weddell gyre water (Foxton Reference Foxton1971). The lagged abundance increases in S. thompsoni and I. racovitzai (Fig. 3) following the negative SOI in 2003 could be explained by the time required for their transport from high latitude waters in the eastern Atlantic sector via the Weddell Gyre (Martinson & Iannuzzi Reference Martinson and Iannuzzi2003).
While our results show significant zero-lag correlations between biological factors and the SOI component of ENSO there were none with the Niño 3.4 component (Table I). This is consistent with the fact that atmospheric circulation patterns initiated by ENSO in the equatorial Pacific during austral spring are manifested in high Southern Hemisphere latitudes during summer and persist through subsequent seasons (Yuan Reference Yuan2004). These would be reflected in SOI during AMLR surveys. In contrast, atmospheric circulation processes involving ENSO-driven heat fluxes between the equatorial Pacific and high Southern Hemisphere latitudes (Ferrel Cells and Hadley Cells) result in strongest temperature and sea ice anomalies during winter (Yuan Reference Yuan2004). This is reflected in the significant positive correlation between sea ice extent and the Niño 3.4 index (i.e. more extensive winter sea ice following a transition to El Niño conditions) and in the positive correlations between krill recruitment and abundance lagged one year after the Niño 3.4 index (Table I).
Our results verify the statistical link between the marine ecosystem and marine environment in the west Antarctic Peninsula region. The statistically significant relationships found in the study (Table I) differ somewhat from those found between seasonal sea ice extent, krill reproduction and recruitment success in previous analyses (Siegel & Loeb Reference Siegel and Loeb1995, Loeb et al. Reference Loeb, Siegel, Holm-Hansen, Hewitt, Fraser, Trivelpiece and Trivelpiece1997). However, the results from this study do not negate the ecological importance of sea ice extent, as indicated by the significant positive correlation between larval krill abundance and sea ice extent largely driven by data from the 1980s and the negative correlation between salp abundance and sea ice extent persisting across the 25 year period. The studies by Siegel & Loeb (Reference Siegel and Loeb1995) and Loeb et al. (Reference Loeb, Siegel, Holm-Hansen, Hewitt, Fraser, Trivelpiece and Trivelpiece1997) focused on the 1980s, a time that was strongly influenced by atmospheric warming and dramatic decreases in sea ice extent in the Antarctic Peninsula region (Smith et al. Reference Smith, Dierssen and Vernet1996, Loeb et al. Reference Loeb, Siegel, Holm-Hansen, Hewitt, Fraser, Trivelpiece and Trivelpiece1997, Martinson et al. Reference Martinson, Stammerjohn, Iannuzzi, Smith and Vernet2008), particularly between 1985 and 1990 (Fig. 2b). The analyses presented here focus on 1990–2004, a period characterized by comparatively stable sea ice conditions and, with the inclusion of additional biological datasets, highlight more subtle consequences of ENSO variability on biological responses.
The absence of strong interannual variability in sea ice extent during 1990–2004 allows the statistical link between ENSO-related environmental changes and those in the marine ecosystem at the level of chl a concentration, krill reproductive output and recruitment, and zooplankton species composition and abundance to be manifest. Our results indicate that variations in chl a are associated with the extent to which the sACCf influences the South Shetland Island and Antarctic Peninsula shelf region, possibly through the combined effects of enhanced wind-driven mixing between warm oceanic and cold coastal waters, enhanced nutrient and/or iron fertilization and optimal water column stratification and mixed layer temperatures (Hewes et al. Reference Hewes, Reiss, Kahru, Mitchell and Holm-hansen2008, Reiss et al. personal communication 2008). Krill reproductive success and recruitment are linked to increased chl a and the south-eastward displacement of zooplankton-rich sACCf waters, suggesting the importance of a) zooplankton as well as phytoplankton as food for krill, and b) favourable circulation regimes for krill eggs and larvae (Fach et al. Reference Fach, Hofmann and Murphy2002 ). An implication is that the order of magnitude decrease in krill population size in the late 1980s (Siegel & Loeb Reference Siegel and Loeb1995, Loeb et al. Reference Loeb, Siegel, Holm-Hansen, Hewitt, Fraser, Trivelpiece and Trivelpiece1997) possibly resulted from the combination of a) poor overwintering conditions due to decreased sea ice extent, and b) poor spring-summer feeding conditions due to limited phytoplankton and zooplankton food resources. Additionally, the south-eastward displacement and shoaling of warm UCDW near island shelf spawning areas here would promote krill reproductive success through rapid larval development and ascent to surface waters (Hofmann et al. Reference Hofmann, Capella, Ross and Quetin1992) and could possibly enhance retention within coastal regions that provide favourable overwintering conditions, larval survival and recruitment success.
Our results explain the variable boundary between poor coastal “East Wind Drift” and rich oceanic “West Wind Drift” zooplankton assemblages observed in the Antarctic Peninsula region during the 1929–1935 Discovery Expeditions (Mackintosh Reference Mackintosh1934). They also explain the dramatic interannual variations in chl a concentrations, zooplankton composition and abundance and krill reproductive success coincidental with climatic and hydrographic conditions monitored by the Biological Investigations of Marine Antarctic Systems and Stocks (BIOMASS) Experiment in the 1980s, a period marked by strong contrasts between La Niña (1980/81 and 1984/85) and El Niño (1983/84) conditions (Fig. 2; Priddle et al. Reference Priddle, Croxall, Everson, Heywood, Murphy, Prince, Sear and Sahrhage1988, Schnack-Schiel & Mujica Reference Schnack-Schiel, Mujica and El-Sayed1994, Stein & Heywood Reference Stein, Heywood and El-Sayed1994). Thus, ENSO has had obvious impacts on the marine ecosystem in the Drake Passage region over the past century. Furthermore, palaeoclimate records indicate that ENSO has influenced climate variability in the vicinity of Drake Passage over the past 130 000 years (Fischer et al. Reference Fischer, Traufetter, Oerter, Weller and Miller2004, Turney et al. Reference Turney, Kershaw, Clemens, Branch, Moss and Fifield2004) suggesting that krill life history strategy and the entire krill-based marine ecosystem are adapted to ENSO variability. In particular, the five-to-eight year krill life span, long relative to other euphausiid species, increases the likelihood of at least one successful recruitment season (every three-to-seven years) in an environment dominated by ENSO-related variability (Fraser & Hofmann Reference Fraser and Hofmann2003).
The data analyses presented here also indicate pronounced longer-term variations in the environmental and ecological impacts of ENSO in Antarctic Peninsula region (Figs 2 & 3). The first 15 years were dominated by ENSO-driven sea ice cycles and apparently low productivity conditions that favoured salps and negatively impacted krill recruitment and abundance. This was also a period characterized by intense and/or prolonged El Niño events. In contrast, the last decade has been dominated by the presence and movements of the sACCf off the South Shetland Islands region and conditions that promote elevated primary and secondary production, including krill recruitment success, but are not favourable for salps. This period has been one of primarily La Niña and neutral conditions and significantly increased concentrations of copepods, chaetognaths, and other zooplankton taxa characteristic of oceanic zooplankton assemblages (Table II). The abrupt change between the two-multiyear states around 1998 conforms to the definition of a climatic regime shift (Bakun Reference Bakun, Robinson and Brink2004). Martinson et al. (Reference Martinson, Stammerjohn, Iannuzzi, Smith and Vernet2008) also documented this dramatic regime shift along the adjacent West Antarctic Peninsula region surveyed by the Palmer Long-Term Ecological Research (PAL LTER) Program. Here the altered hydrographic properties after 1998, also attributed to the Antarctic Dipole, most probably resulted from intrusion of UCDW at shallower depths through enhanced upwelling.
Results from both the AMLR and PAL LTER Programs are of particular significance for assessments of the impacts of climate warming versus naturally occurring decadal-scale environmental variability on ecosystem productivity in the West Antarctic Peninsula region. The important implications for krill fisheries management are that fisheries efforts will need to be adjusted according to ENSO variations over temporal scales influenced by decadal and longer term variability, including the compounding effects of climate warming. Of potential significance are the impacts of another even more dramatic loss of sea ice in the Antarctic Peninsula region following a return to an El Niño dominated regime. Also of great significance are displacements of the sACCf and Bndy relative to primary and secondary productivity and krill ontogenetic migrations, spawning sites over outer island shelves, developmental larval ascent and horizontal advection favouring survival, local retention, as well as eastward transport to dependent predator populations (Priddle et al. Reference Priddle, Croxall, Everson, Heywood, Murphy, Prince, Sear and Sahrhage1988, Reid & Croxall Reference Reid and Croxall2001, Fach et al. Reference Fach, Hofmann and Murphy2002).
Acknowledgements
This work was supported by the National Oceanic and Atmospheric Administration US Antarctic Marine Living Resources Program. We thank AMLR Director Rennie Holt for facilitating this collaborative effort, Roger Hewitt for providing sea ice indices and Christian Reiss for assisting in database management and reviewing the manuscript. We also thank the captains, crew members and AMLR field season participants, particularly Anthony Amos and Christopher D. Hewes, for their hard work over the years that ensured collection of high quality datasets. John Wormuth generously provided copepod and larval krill data from the 1980s. Douglas Martinson was of great assistance in supporting our appreciation of the Antarctic Dipole and establishing the climatic regime shift after 1998. Thanks go to the comments and suggestions from two anonymous reviewers that prompted revisions that have led to a clearer presentation of our datasets and analyses. The views expressed herein are those of the authors and do not necessarily reflect the views of NOAA or any of its subagencies.