Introduction
The UK's recent productivity performance has been strikingly weak. The main measure of UK labour productivity – the volume of output produced per hour worked – increased by around 2.1 per cent per year in the decade prior to the economic downturn, while output per worker increased by around 1.8 per cent per year. Over this period, productivity growth supported real earnings growth and rising living standards. In macroeconomic management terms, productivity growth helped to restrain inflationary pressures – even as the labour market tightened – with corresponding impacts on monetary and fiscal policy.
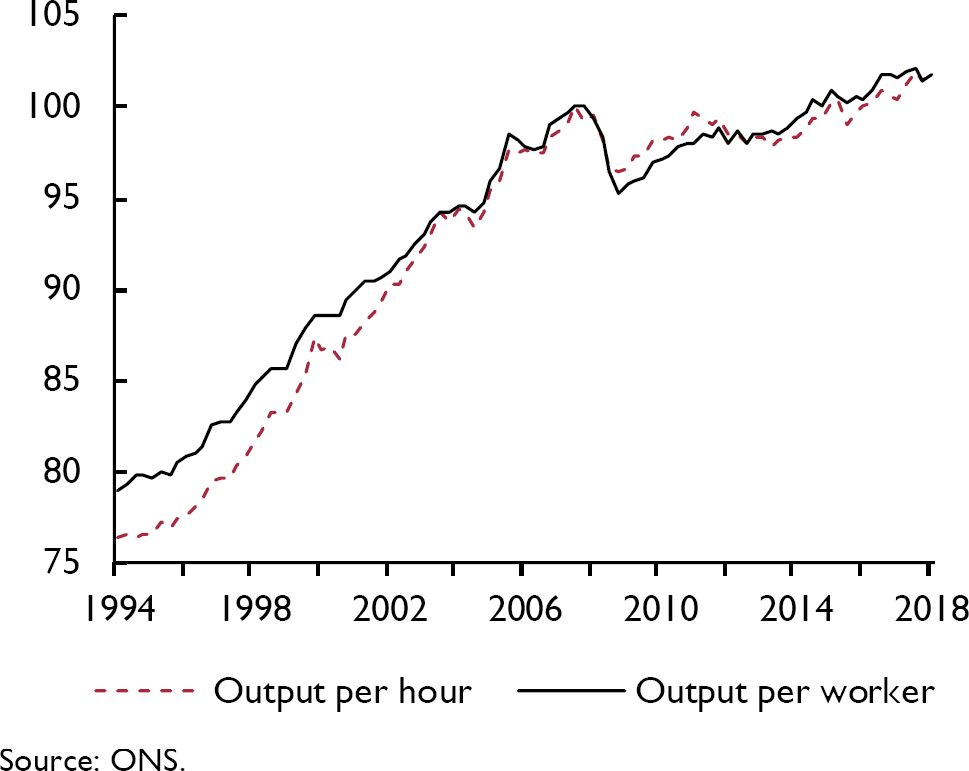
However, in the ten years since the global financial crisis, labour productivity growth has slowed sharply compared with this pre-downturn benchmark (figure 1). Between the first quarter of 2008 and the first quarter of 2018, output per hour grew by just 0.2 per cent per year on average. Reflecting the modest difference in average hours worked between these yardsticks, labour productivity growth in per worker terms also slowed to 0.1 per cent per year over this period. This picture is not much improved by measuring from the trough of labour productivity in the first quarter of 2009. Average annual growth in labour productivity between this point and the second quarter of 2018 is a little higher at 0.7 per cent per year. On any of these measures labour productivity growth has slowed considerably over the past ten years.
Labour productivity: output per hour and output per worker, levels, Q4, 2007=100

This weakness of labour productivity growth – commonly referred to as the ‘productivity puzzle’ – is one of a number of curious features of the UK's productivity performance. These ‘stylised facts’ of UK productivity include the weakness of recent productivity growth; the ‘gap’ in productivity terms between the UK and other leading economies; and the large differences in productivity between businesses. They have prompted a new wave of academicFootnote 1 and policy-makerFootnote 2 interest designed to diagnose the reasons for the slowdown, and to prescribe measures to address it.
This article presents three stylised facts of the UK's recent productivity performance as shown in official measures of UK productivity and surveys new statistical and analytical outputs to support policy-maker and researcher understanding of productivity. In themselves, these outputs do not solve the productivity puzzle, but instead provide new insights on long-standing issues in the UK's productivity performance.
Stylised facts of UK productivity: one puzzle, or three?
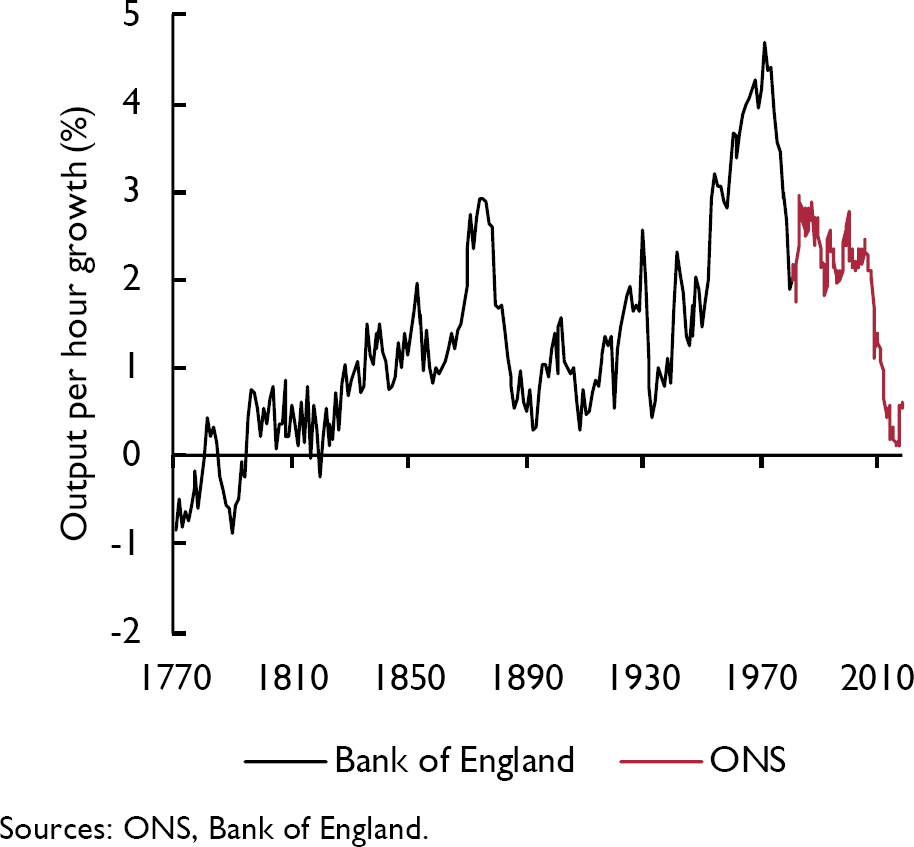
In popular parlance, the ‘productivity puzzle’ is widely understood as the slowdown in productivity growth since the onset of the economic downturn in 2008. As set out in figures 1 and 2, this slowdown is considerable and is of historic proportions. Figure 1 shows that this slowdown became evident around the time of the global financial crisis: as output per hour and per worker growth slowed markedly around this time. However, it is the historical context provided by figure 2 – which shows the compound average annual growth rate of output per hour worked in the UK on a rolling ten-year basis – which makes the scale of the recent slowdown apparent. Measured on this basis, labour productivity growth has slowed sharply from an average of around 2.8 per cent between 1945 and 2007 to around 0.6 per cent in 2018. As a consequence, recent rates of productivity growth have probably been weaker than at any point since the start of the 19th Century.
Compound average annual growth rate of labour productivity, rolling ten-year window, %

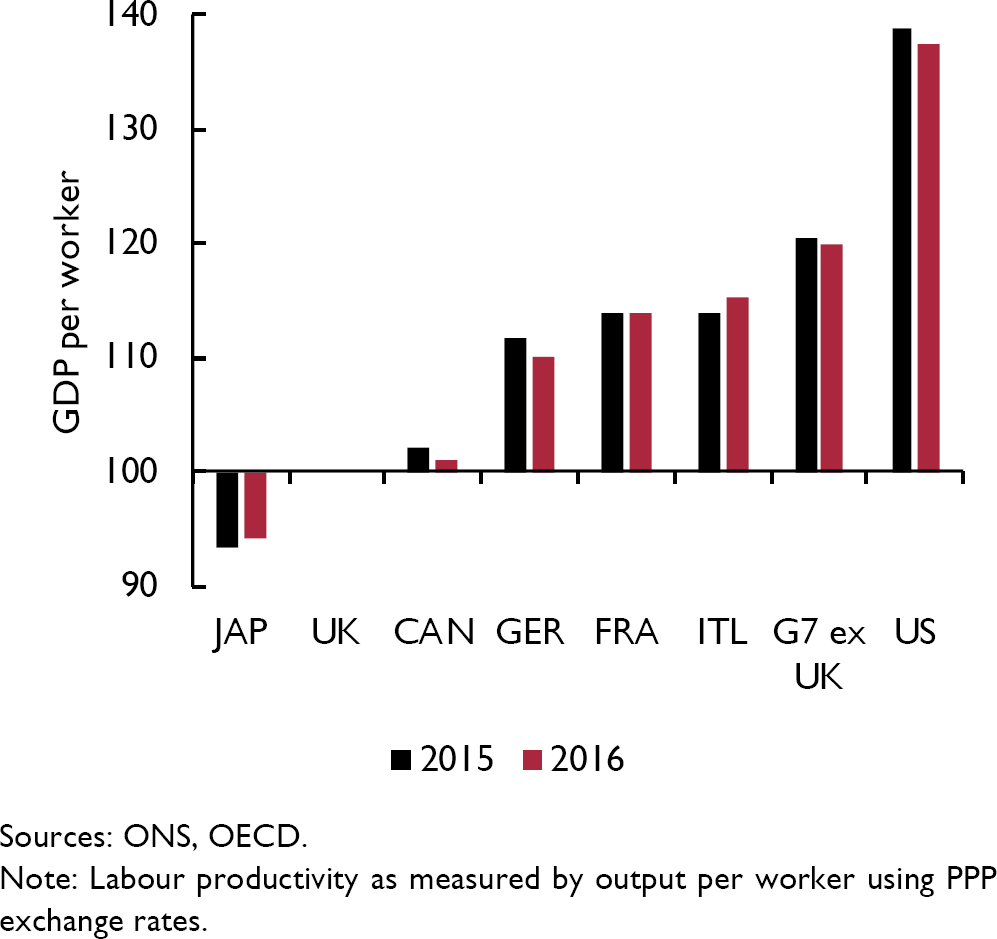
This ‘productivity puzzle’ is made all the more ‘puzzling’ by two further ‘stylised’ facts which appear to document structural potential for ‘catch-up growth’. While UK productivity growth has slowed over the past decade – both in labour productivity and in wider, multi-factor productivity terms – there remains a considerable ‘productivity gap’ between the UK and other leading economies (ONS, 2018a). On an output per worker basis, labour productivity in the UK was around 9.3 per cent, 12.2 per cent and 27.3 per cent below that of Germany, France and the United States respectively in 2016 (figure 3). Although the UK's relative position improved somewhat between 1999 and 2004, since 2008 the UK has fallen behind these leading economies. As a consequence, the productivity gap between the UK and the rest of the G7 is as wide today as it was in 1999. This finding – replicated at the industry level (ONS, 2017a) – suggests either that businesses in the UK have pursued a strikingly different approach to production, and/or that there remains significant scope for the adoption of international best practice.
Labour productivity in the G7, UK=100

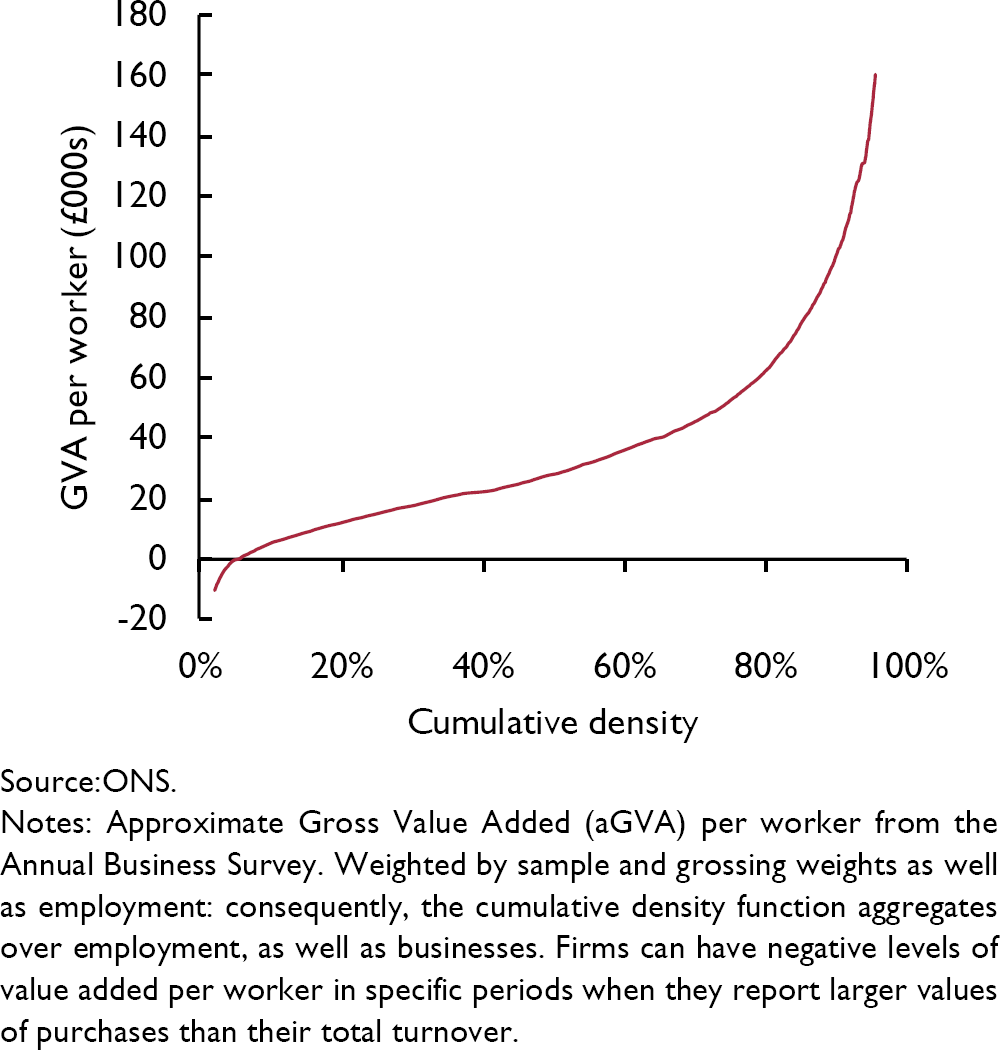
By construction, these international differences in labour productivity partly reflect the productivity of UK businesses relative to firms in these other leading economies (ONS, 2017b, 2017c). However, while the average labour productivity of British workers partly drives these differences in relative levels of labour productivity, it is the spread of productivity outcomes which provides our third stylised fact. In common with most leading economies, levels of labour productivity at businesses – even businesses within the same relatively tightly defined industry (Reference SyversonSyverson, 2004, Reference Syverson2011) – vary considerably (figure 4). Around 23 per cent of British workers were at businesses which had labour productivity of less than £14,000 per worker in 2016. The median British worker was around twice as productive, at around £28,000 per worker over the same period. However, at the top of the distribution, the workers at the 90th and 95th percentiles of the distribution were at businesses generating £100,000 and £147,000 per worker in 2016.
Distribution of labour productivity output per worker, 2016

As set out by Bartelsman et al. in this Review (Reference Bartelsman, Lopez-Garcia and PresidenteBartelsman et al., 2019), economists expect that in the long run factor inputs will tend to shift away (or be ‘reallocated’) from activities with low marginal productivity towards activities which generate more value added. At face value, these differences in productivity are consequently somewhat puzzling. If the ‘forces of reallocation’ are strong, then they would tend to concentrate the distribution of labour productivity at a common level. However, if they are relatively weak, then low-productivity activity could persist, even in the presence of potentially greater returns elsewhere.
These three puzzles – the recent weakness of labour productivity growth, the long-standing potential for international catch up, and presence of persistent, wide variations in the productivity of businesses – present a considerable challenge to both the academic literature and to policy-makers. For the former group, considerable effort has been expended to show how variation in productivity across establishments can persist over time. Growing access to new, often administrative data has supported a wave of new research in this field. Administrative data has enabled a ‘whole population’ view of the forces of business dynamism (Reference Decker, Haltiwanger, Jarmin and MirandaDecker et al., 2018); linked datasets have fostered research on the strength and importance of labour flows between establishments of different levels of productivity (Reference Song, Price, Guvenen, Bloom and WachterSong et al., 2015); work on business level data has highlighted the importance of profit margins and market power (Reference De Loecker and EeckhoutDe Loecker and Eeckhout, 2018); new data collections have enabled research on the impact of management practices on productivity (ONS, 2018b), while international micro-data collaborations between National Statistical Institutes and central banks (Reference BerlingieriBerlingieri et al., 2017) have documented the ubiquity of productivity differences at the firm level and how some of these differences may be widening.
For policy-makers, the abundance of research on this topic is both a boon and a curse. In the UK context, which is the most pressing issue (Reference Oulton, Chadha, Crystal, Pearlman, Smith and WrightOulton, 2016)? Should policy focus on the slowdown of labour productivity growth, or the long-standing differences in the levels of labour productivity across countries or businesses? Which drivers does the literature think are the most important, and how much purchase on these issues does policy have? In the absence of unanimity from the profession and in an often noisy and constrained political context, many of the main policy-maker prescriptions have focussed on measures such as infrastructure investment, the promotion of research and development and policies to improve workforce skills (HMT, 2015).
To aid this debate, ONS has developed a range of new data and statistics which improve our understanding of the productivity puzzle. While these outputs do not in themselves ‘solve’ the productivity puzzle, this work sharpens our understanding of the issues, creates the potential for further research, and points to the insights that administrative datasets might deliver in future work (Reference BeanBean, 2016). It is to these outputs and the findings which they contain that this paper now turns.
Renewal: new statistics from existing data
ONS is the primary source of productivity data in the UK. It publishes estimates of output per worker and output per hour worked on a quarterly basis, for both the whole economy and for a breakdown of industries. The numerators in these ratios come from the National Accounts: capturing Gross value added (GVA) at basic pricesFootnote 3 (table 1). The denominators – capturing either the number of workers or total number of hours worked – are largely based on information from the Labour Force Survey (LFS) and business employment surveys (such as the Short Term Employment Survey (STES)). Together, these sources provide information on the number of employees and self-employed workers in each industry, as well as information about their average actual hours of work. Both sources are subject to revision: the numerator is revised in line with National Accounts revisions policy, the denominator is subject to revision through periodic reweighting exercises and – as it is based on a survey source – is measured within defined confidence intervals.

The nature of these source data places some limits on the granularity of the productivity data which can be produced. However, the advent of the productivity puzzle and the urgent need of policy-makers to better understand the drivers of weak productivity growth increased demand for more granular and more timely information. The number of individual industries for which quarterly labour productivity data are published has since been increased to 66 (ONS, 2017d). The national series have been augmented by estimates of regional labour input for high-level industries on a quarterly basis, and annual estimates of real and nominal labour productivity for the NUTS1 regions of the UK for high-level industries which are consistent with the labour productivity headline data. New estimates of labour productivity by industry and country have been published (ONS, 2017a), a programme of engagement with the OECD has sought to examine and assure the comparability of aggregate labour productivity estimates across countries (Reference Ward, Zinni and MariannaWard, Zinni and Marianna, 2018) and these have allowed new insights on UK productivity performance at the national and regional level.
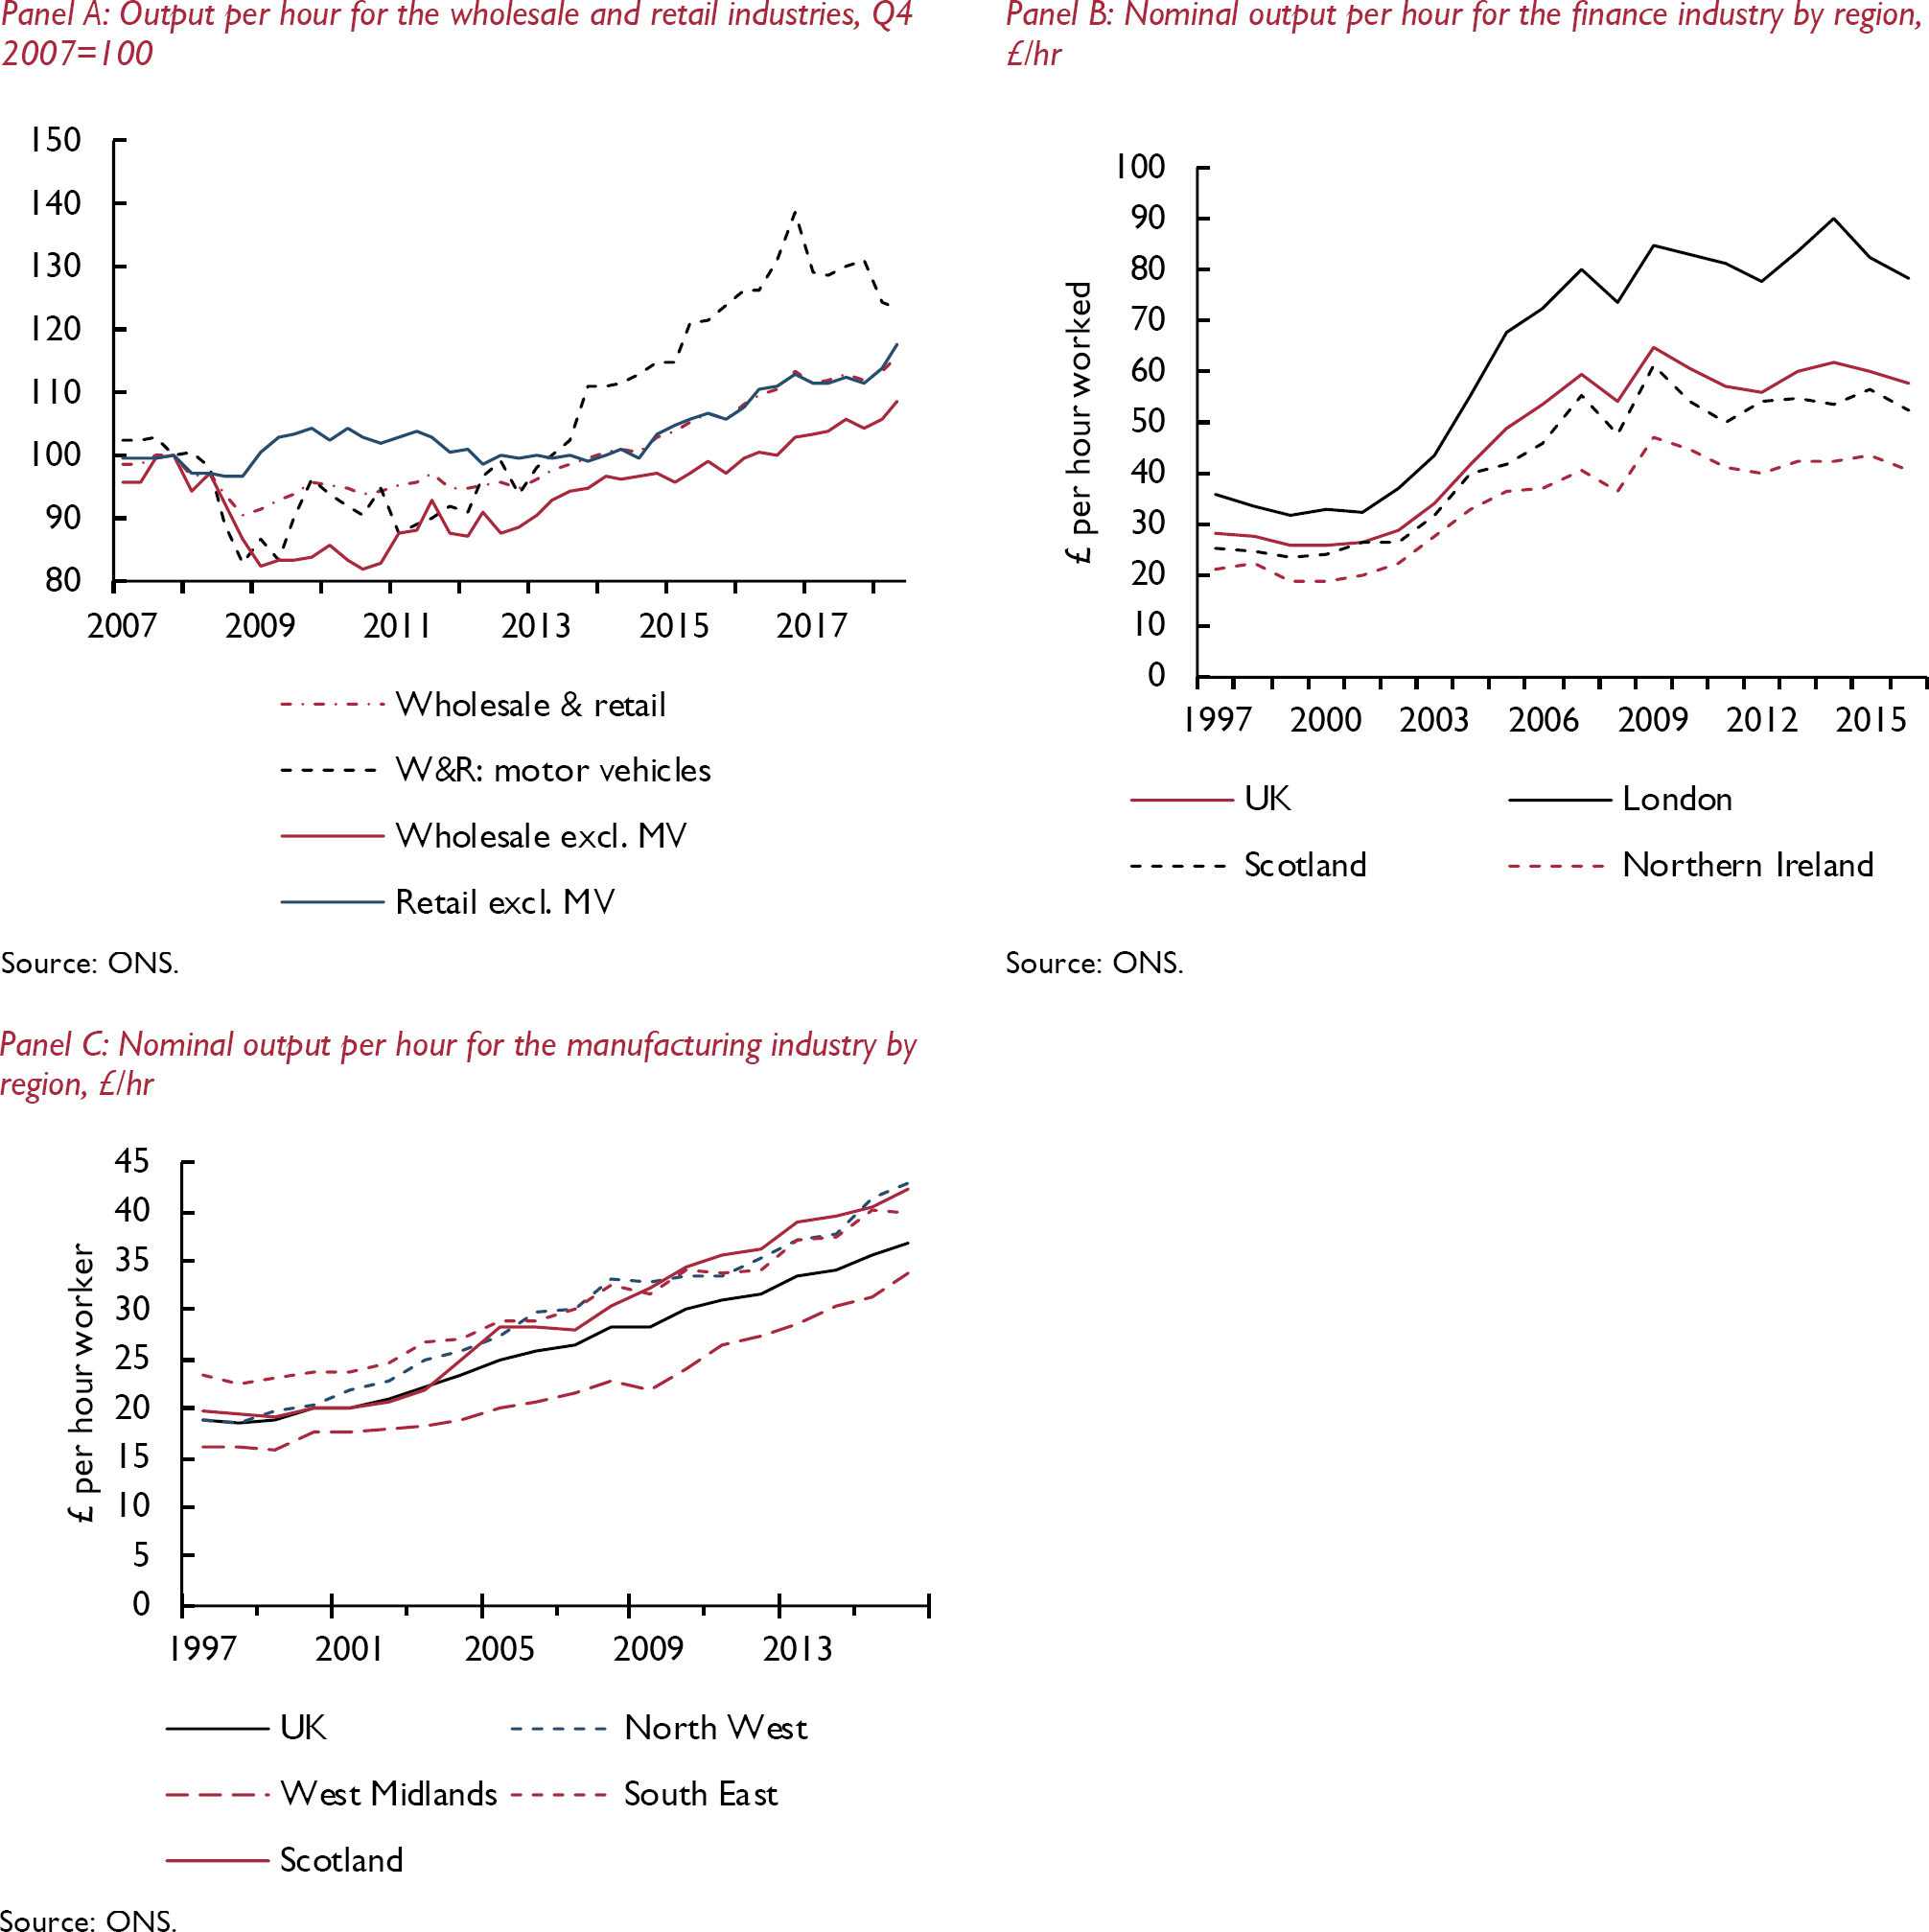
The granularity of these data supports a much more detailed understanding of the UK's recent labour productivity growth than was previously possible. In particular, the expanded industrial breakdown indicates that the previously published industrial aggregates masked quite wide variation between different sub-industries. Panel A of figure 5 shows the path of labour productivity in the Wholesale & Retail industry (G), as well as the performance of its sub-components (industries 45: Wholesale and Retail of Motor vehicles; 46: Wholesale other than that of motor vehicles; 47: retail other than that of motor vehicles): and indicates that these sub-industries have varied considerably in their performance in recent years. Steady labour productivity growth in industry 46 has out-stripped that in industry 47 in recent years, while the productivity of industry 45 has climbed significantly over the same period: suggesting considerable variation in productivity growth at the sub-industry level, even within Wholesale and Retail.
New productivity insights

These data also enable longer-term analysis of the recent productivity slowdown. For instance, although output per hour growth in the Wholesale and Retail industry as a whole is only slightly reduced in the pre- and post-downturn periods – falling from 1.8 per cent to 1.6 per cent – this reflects varying performances at the sub-industry level. Average annual labour productivity growth in industries 45 and 47 slowed from 2.6 per cent in the decade prior to the economic downturn to 2.2 per cent and 1.6 per cent respectively over the 2008 to 2018 period, but productivity growth in the wholesale industry (46) has accelerated over the post-downturn period – increasing from 0.6 per cent to around 1.2 per cent per year. Widening this analysis to encompass all 66 industries for which estimates of output per hour worked are available shows that around two-thirds have seen their productivity growth slow in the post-downturn period, with some of the largest slowdowns in Telecommunications and the Manufacture of pharmaceuticals and textiles industries. Further work can thus concentrate on the particular ‘drivers’ of the slowdown in these industries and their contribution to the overall puzzle.
These new data also support improved understanding of regional differences in labour productivity. Panels B and C of figure 5 show new nominal labour productivity data for the Finance & Insurance and Manufacturing industries respectively for the NUTS1 regions of the UK. The former panel shows the pre-eminence of finance in London and the striking inequality of labour productivity in this industry: the nominal value added generated per hour of work in finance in this region was more than twice that of the least productive regional financial industry in 2016. Throughout this period, London's financial industry was the only region with above average labour productivity for finance. However, while striking inequalities in finance productivity might be expected,Footnote 4 Panel C shows that regional differences in manufacturing productivity are considerably narrower. While the spread between the least and most productive financial industries in Panel B was around £40 per hour worked, the spread for manufacturing is around £10 per hour worked. The highest levels of labour productivity were observed in the North West, Scotland and the South East, while the manufacturing industry of the West Midlands is among the least productive through much of this period.
These ‘renewed’ outputs have also enabled more detailed analysis of labour productivity (Reference Riley, Rincon-Aznar and SamekRiley, Rincorn-Aznar and Samek, 2018). In particular, these data have enabled researchers to calculate the contributions of specific industries – or specific industries in particular regions – to aggregate UK productivity growth. This recent work suggests that the slowdown in productivity growth derives in large part from the slowdown in a number of industries: notably the Finance, Manufacturing and Telecommunications industries. These estimates have prompted considerable research effort to understand and explain the varying contribution of ‘reallocation’ – the movement of factor inputs and relative prices across industries and regions – to labour productivity growth, and have highlighted a range of further, more detailed questions on methods and approaches.
Alongside improvements to the suite of UK labour productivity metrics, new and wider measures of productivity have been developed which cast considerable light on the UK's recent performance. In particular, estimates of Multi-Factor Productivity (MFP), see Reference Harris and MoffatHarris and Moffat (2019) in this Review for an application, hold advantages for long-run comparisons and are more ‘complete’ in the sense that they account for a wider range of factor inputs. These data decompose the growth of output into that attributable to the application of labour and capital, and that due to the manner in which these factor inputs are combined – often interpreted as a measure of technological progress. Provision of MFP data for the UK has been relatively weak compared to other leading economies: provided at a lower level of industrial detail, with a longer lag, and incorporating information on a narrower range of factor inputs.
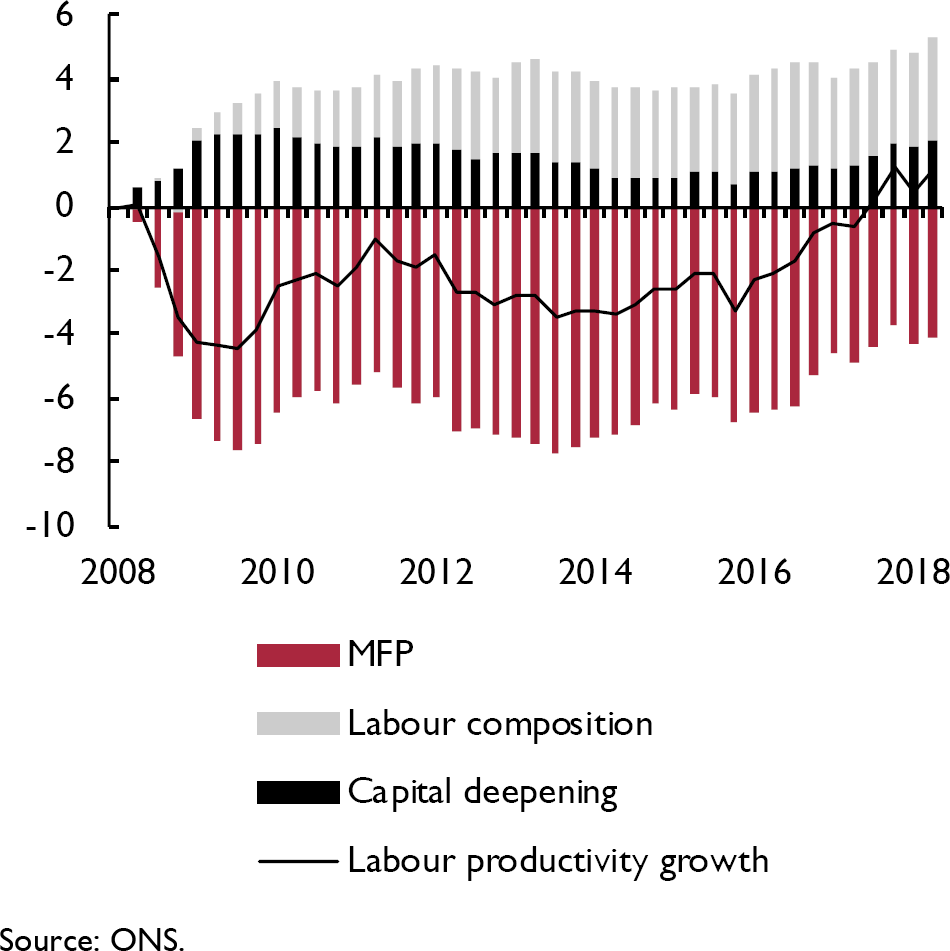
To address these concerns, new and more granular estimates of MFP are now available. Figure 6 shows the results of this effort, decomposing the growth of output per hour in the market sector into the contributions from labour composition, capital services and multi-factor productivity at a quarterly frequency.
Contributions to cumulative quarterly growth of output per hour worked, % and percentage points

These new data show that the UK's recent slowdown in productivity growth is largely a consequence of a slowdown in the multi-factor productivity component (figure 6). Following the economic downturn, both capital and labour composition made a larger contribution to labour productivity growth – indicating that the workforce shifted compositionally towards higher-skilled workers, and that these workers had more capital services at their disposal over this period (capital deepening). Over the ten years since the downturn, the former effect has been sustained – with worker composition adding to output per hour growth over this period – but the contribution of capital gradually waned until around 2015, and remains below historical averages. By contrast, multi-factor productivity made a large negative contribution to cumulative output per hour growth throughout this period. Compared with trend MFP growth of around 1 per cent per year in the pre-downturn period, in 2018 MFP is still around 4 percentage points lower than in 2008, suggesting that the recent slowdown in productivity growth is largely an MFP slowdown.
Rejuvenation: research outcomes from existing data
Alongside aggregate measures of UK productivity, analysis of the survey micro-data which underpin these estimates has provided much more detailed information on the drivers of productivity at the business level.Footnote 5 Widely used by academic researchers in recent years, these survey sources enable the construction of productivity metrics based on a more detailed array of business characteristics. Their mobilisation helps to explain and contextualise aggregate results.
ONS’ Annual Business Survey (ABS) has provided the main source data for these analyses. As the UK's main structural business survey, the ABS contains a wealth of information about the financial performance of firms in Great Britain's private, non-financial business economy. The ABS is a stratified, random sample of British businesses, covering around 62,000 firms each year, providing data on the turnover and intermediate consumption of businesses covering around two-thirds of the UK economy and is now linked to a range of auxiliary sources.
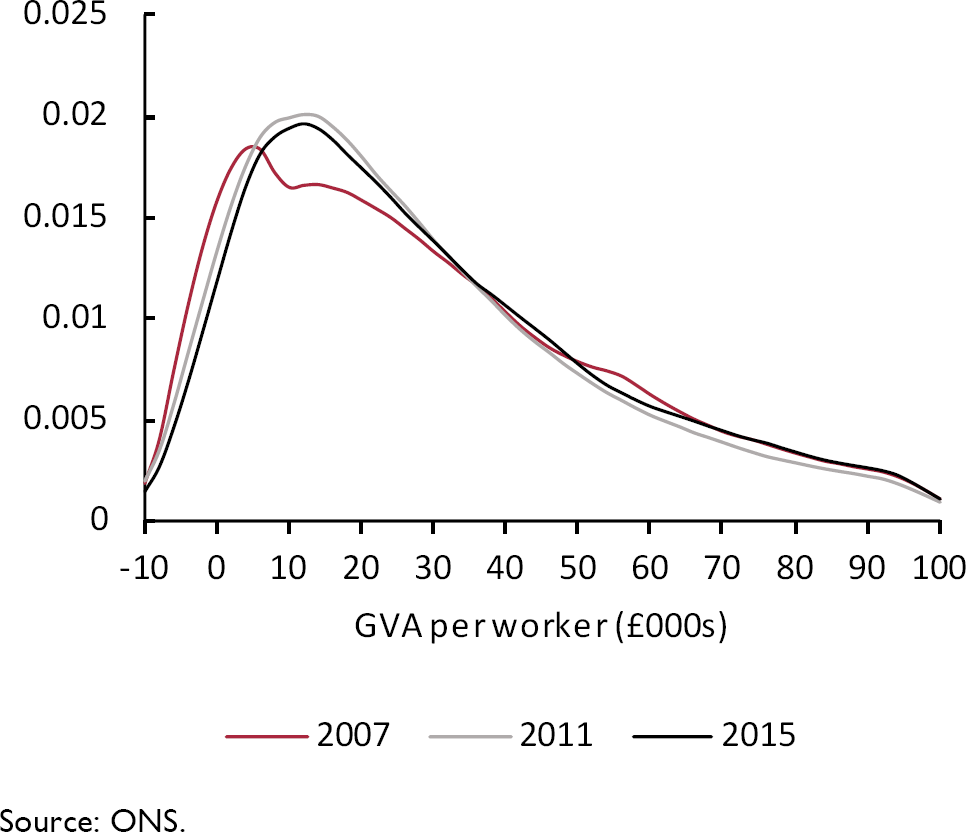
The resulting statistics provide considerable insight into the UK's productivity performance. In common with other leading economies, the UK has a very broad distribution of labour productivity levels across businesses – even within the same industry (ONS, 2017b, 2017c). These differences are shown for a single year in figure 4, and for several years in figure 7. Among the lowest productivity businesses, a considerable number have negative Gross value added: that is, the cost of their intermediate purchases exceeds their turnover. By contrast, at the top end of the labour productivity distribution, there are very high productivity businesses in most industries and regions (ONS, 2017e), pointing to the impact of different business models, approaches and pricing strategies.
Distribution of output per worker across businesses, constant (2015) prices, £000s per worker per year

This distribution of labour productivity across businesses is relatively stable through time, but where there are differences between years, these provide important clues which may help to explain changes in the headline statistics. For instance, perhaps the largest single change in the distribution of labour productivity shown is that between 2007 and 2011: the period covering the pre-downturn peak and the subsequent slump in labour productivity. Between these years, the proportion of businesses with relatively low labour productivity – between £10,000 and £20,000 per worker per year – increased markedly, while the proportions of businesses with labour productivity of between £50,000 and £80,000 per worker per year and those with negative value added fell considerably. These dynamics indicate that the labour productivity distribution was compressed during these years, consistent with pressure on productivity at high-performing units, and a decline in the share of businesses with very low productivity. Indeed, this latter finding – although far from definitive – provides a direct parallel with OECD work which suggests that while ‘zombie firms’ may be an important part of the productivity slowdown story in other countries, they appear to play a smaller role in the UK context (Reference McGowan, Andrews and MillotMcGowan, Andrews & Millot, 2017).
One of the key strengths of this approach – using the micro-data to better understand movements in the macro-concepts – is the potential to leverage the rich characteristic information available at firm level. These data offer important insights which can reshape our understanding of aggregate productivity growth, especially if either the level or growth rates of productivity differ across units on dimensions other than traditional industrial and regional grounds.
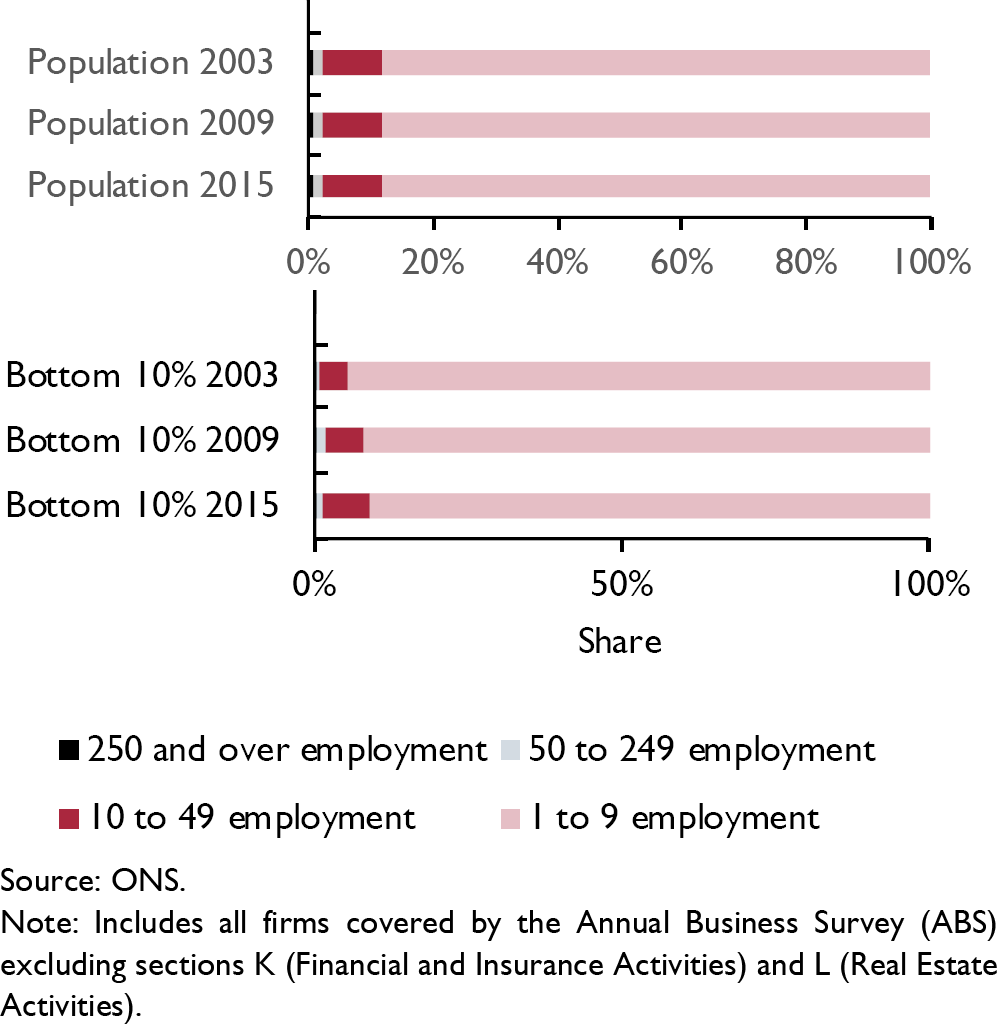
Among the most intriguing recent findings from this work are the size- and age-profiles of the UK's least productive businesses, shown in figures 8 and 9 (ONS, 2017c). Figure 8 shows the size distribution of the population of between 2003 and 2015 (upper panel) and that of businesses in the bottom 10 per cent of the labour productivity distribution (lower panel). The upper panel shows that there has been little change in the overall firm-size distribution over this period: the vast majority of UK businesses are micro-businesses (of fewer than ten employees), and a relatively stable share of just over 10 per cent have ten or more employees. In the lower panel, data for the earlier years show that smaller firms account for a larger share of low productivity businesses than they do in the business population as a whole, possibly because of more limited specialisation and economies of scale. In 2003, fewer than 1 in 20 of the lowest productivity businesses had ten or more employees.
Distribution of firms in the population and the bottom 10% of the labour productivity distribution by size, 2003–15, Great Britain

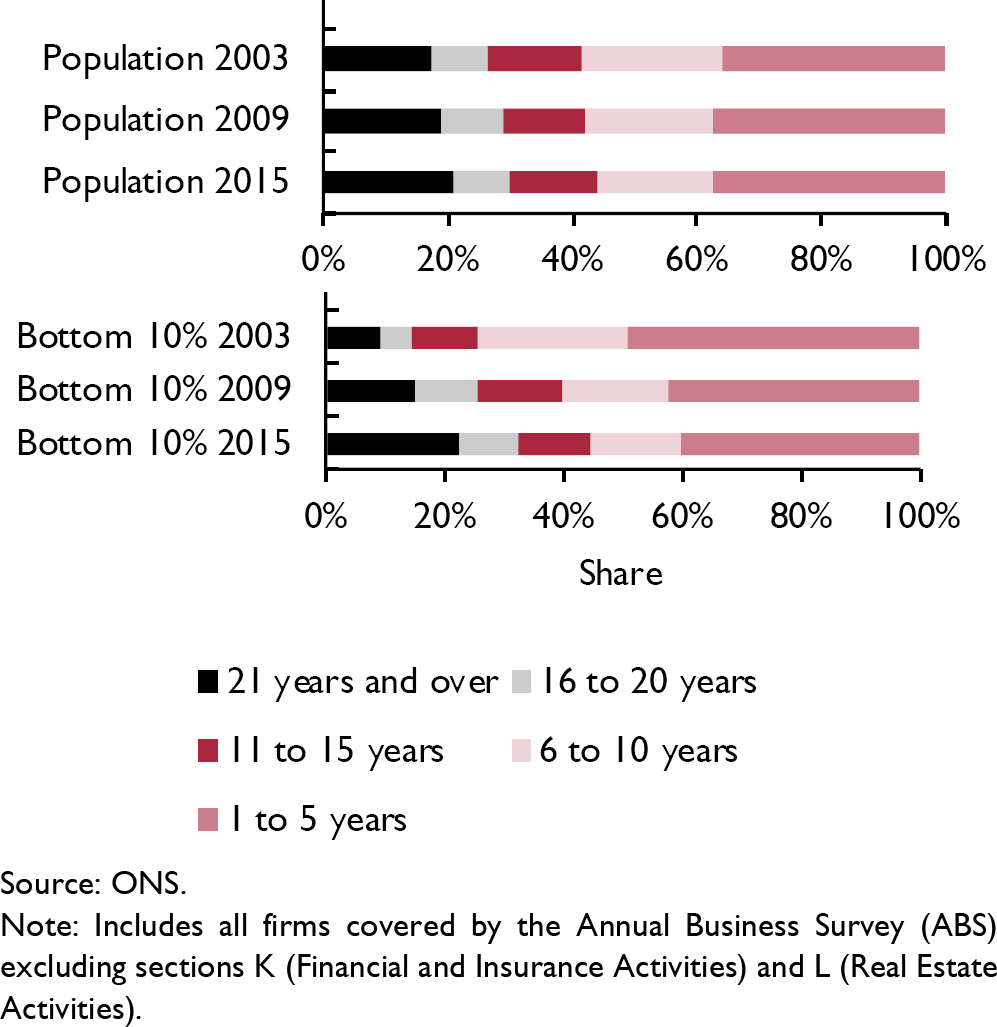
Age distribution of firms in the poopulation and the bottom 10% of the labour productivity distribution, 2003–15, Great Britain

However, over the twelve years between 2003 and 2015, the share of the least productive UK businesses accounted for by larger firms has risen considerably: almost doubling from around 5 per cent to close to 10 per cent. The reason for this development is unclear. It suggests either that the slowdown in labour productivity has had a differential impact on continuing businesses of different sizes, or that the dynamics of firm birth and death among the smallest businesses have changed considerably over the period in favour of higher productivity, small businesses.
The same kind of analysis suggests that businesses at the foot of the labour productivity distribution were older on average in 2015 than in earlier years. Figure 9 shows the age distribution of businesses in the population as a whole (upper panel) and that among businesses in the bottom 10 per cent of the labour productivity distribution (lower panel). As in our analysis of firm size, there is little evidence of a dramatic movement in the age mix of businesses in the whole population. The upper panel indicates that the share of businesses aged 11 or above has increased gently over this period, driven in part by the growing share of the oldest businesses, but these effects are relatively modest. In the early 2000s, the lower panel shows that younger businesses are more concentrated at the bottom end of the labour productivity distribution, reflecting both the learning that they are yet to do about production and the higher survival probabilities of more productive businesses.
However, this presentation shows that the share of very young businesses at the lower end of the labour productivity distribution has fallen from around 50 per cent in 2003, to around 40 per cent in 2015 – only a little higher than their share in the population as a whole. The share of businesses aged 11 or above has increased markedly from around 25 per cent to around 45 per cent, and the proportion of businesses aged 21 or above has risen to more than one in five. As a result, the oldest businesses are now marginally more prevalent at the bottom of the labour productivity distribution than they are in the population as a whole. Given the learning process that we expect older, more established businesses to have been through, this seems a surprising development.
These analyses have also thrown light on structural features of the UK's productivity performance and bring established results up to date using the latest data (Reference Griffith, Redding and SimpsonGriffith et al., 2002). Table 2 highlights the marked productivity differences between businesses with a form of Foreign Direct Investment (FDI) connection, and those without (ONS, 2017f). This analysis points to the considerable productivity advantage of businesses with FDI links: the median worker at an FDI business was around twice as productive as their counterpart at a non-FDI business in 2015: at the mean, these differences are even more stark, with a worker at an FDI business producing more than three times as much value as their counterpart. While the FDI status of businesses is clearly endogenous – and therefore the results shown here are not causal in their interpretation – they provide important contextual information for policy-makers as the UK considers its position in the global economy.

Revolution: new understanding with new data
Alongside the renewal of existing official productivity statistics for the UK and the rejuvenation of productivity analysis from existing official sources, new insights have been developed using new collections of data, or by mobilising previously unavailable sources of administrative data for statistical analysis.
Management and productivity
First, in an effort to better understand the wide gaps in productivity between businesses and between the UK and other comparable economies, following the OECD the ONS has developed an innovative programme of research on management practices (ONS, 2018b). The first official, large-scale collection of data on quantitative measures of management practices took place in 2017. These data, collected and analysed in collaboration with a team of researchers at the Economic Statistics Centre of Excellence (ESCoE), drew on a recent international upsurge of interest in the measurement of management. These surveys collected a range of data on four domains of management:
continuous improvement practices – how well does the firm monitor its operations and use this information for continuous improvement?
key performance indicators (KPIs) – how many KPIs does the firm have and how often are they reviewed?
targets – are the firm's targets stretching, tracked and appropriately reviewed?
employment practices – is the firm promoting and rewarding employees based on performance, managing employee underperformance and providing adequate training opportunities?
Specifically, twelve categorical questions on the Management and Expectations Survey (MES) collected information on quantitative and qualitative aspects of business management practices. Each question was accompanied by a list of options from which respondents chose options closest to the practices within their firms. For each question, scores were awarded to each option on a scale of 0 to 1, where 0 was the least and 1 the most structured management practice. Consistent with collections of data on management in other countries, an overall management score was derived as a simple average of a firm's score on all individual questions, yielding a score which ranges between zero and one.
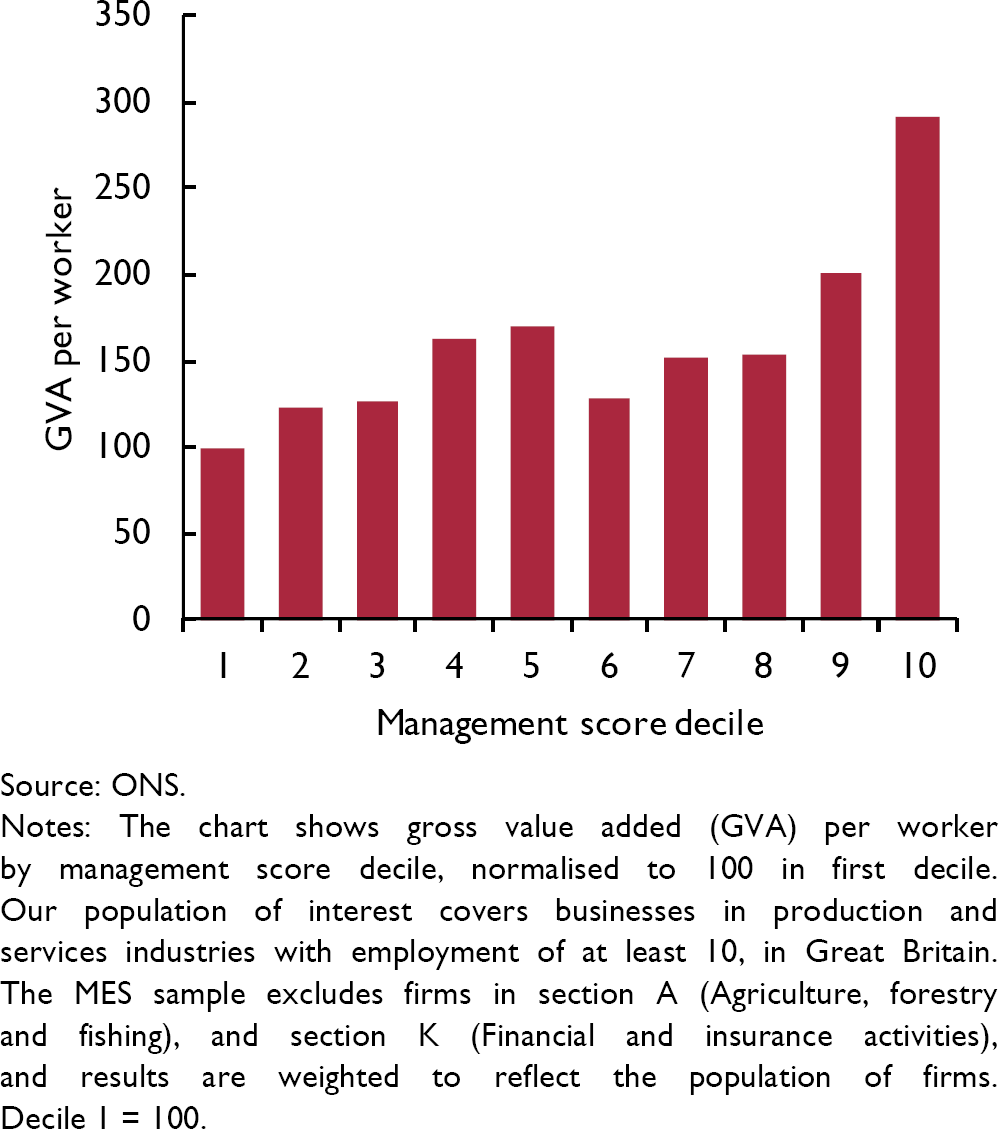
The unconditional association between these scores and the productivity of businesses is relatively strong. Figure 10 groups businesses into deciles of the management practices scores: those with the lowest management practices scores are represented in the first bar on the left, and those with the highest management practices score are represented in the bars on the right-hand side. The height of the bar represents the average labour productivity of each group, benchmarked to that in the lowest decile. This representation shows that labour productivity and management score appear strongly positively correlated, with the highest (lowest) labour productivity occurring in the highest (lowest) deciles of management score.
Labour productivity by management score decile

This association also appears to be robust to the inclusion of a wide variety of controls. In the regressions in table 3 – which take the log of output per worker as the dependent variable and rise in their detail from left to right – controls are introduced for firm size, industry, region, ownership status and age, as well as some categorical controls for the skills of the workforce. Throughout these specifications, the coefficient on the summary ‘management score’ enters positively and significantly across the specifications. In our preferred, most detailed specification, a 0.1-point increase in management practices score (which is bounded between zero and one) is associated with a 9.6 per cent increase in labour productivity. In terms of the moments of our survey data, a move from the 25th percentile of the management practices distribution (with a score of 0.34) to the median (0.53) is associated with a 19 per cent increase in labour productivity. While this work is unlikely to explain the recent weakness of labour productivity growth and the associations here are not causal in their interpretation, these results show the potential of quantitative measures of management. In time, they may also help to explain the wide differences in productivity between different businesses in the UK, or between the UK and other leading economies (Reference SyversonSyverson, 2011).

Trade and productivity
Improved access arrangements have also enabled administrative data to be used to analyse business-level productivity. Despite a large international literature (see Reference WagnerWagner, 2007, Reference Wagner2012 for surveys) on the relationship between firm-level trading behaviour and productivity, evidence on this link for the UK has been hampered by long-standing data issues. Specifically, no single, comprehensive data collection in the UK comprises both information on the financial performance of businesses and their trading behaviour. To address this gap, we constructed a new dataset which combines information from both the ABS and HMRC's trade in goods declarations (Reference Wales, Black, Dolby and AwanoWales et al., 2018). We applied this new dataset to examine the prevalence of trading behaviour among businesses of different sizes, ownership types and in different industries; and to analyse the link between productivity and trader status for British firms in the private, non-financial business economy.
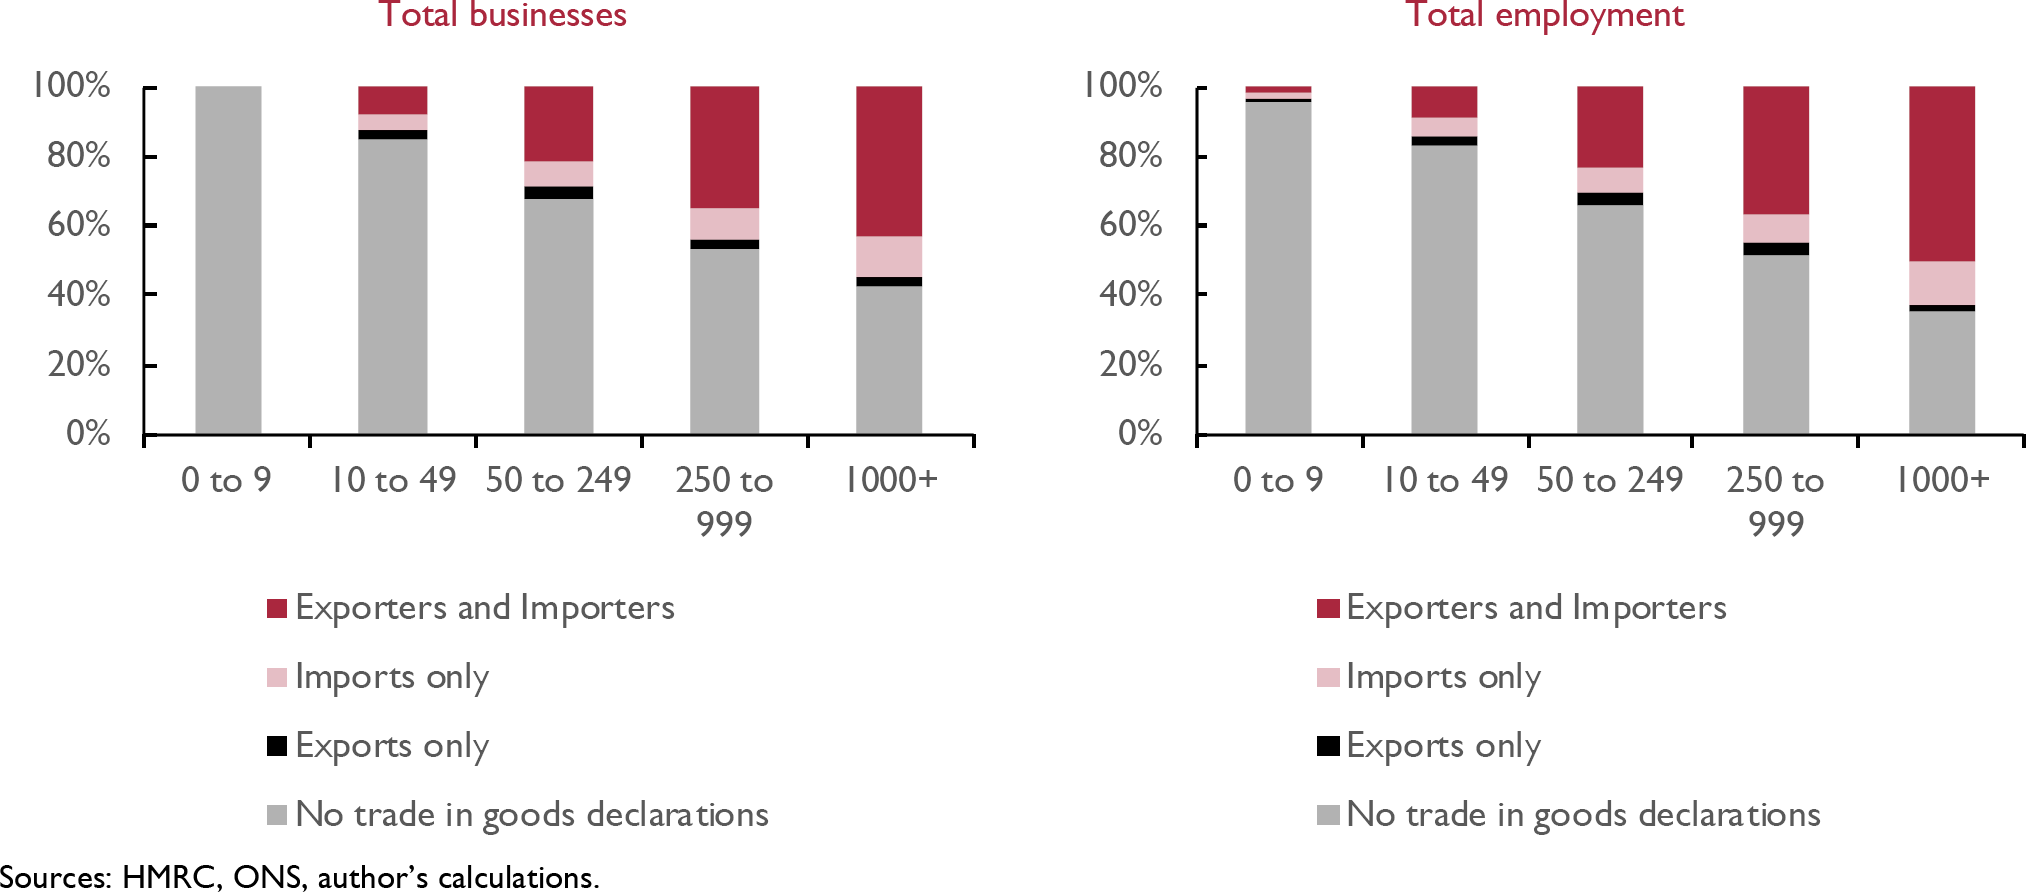
Our results show that the prevalence of international trade varies considerably. Among businesses with more than ten employees, only around one-in-five firms report trade in goods to HMRC (figure 11). However, as these are the largest businesses, they account for a much larger proportion of all employment: in 2016, around 40 per cent of UK employment was at businesses which declare trade in goods. We show that foreign owned businesses are more likely to trade in goods than domestic businesses, and businesses that trade goods are concentrated in the manufacturing, wholesale and retail and extraction industries. Our analysis also suggests that trade in goods is strikingly concentrated: 38 per cent of the value of UK goods exports was accounted for by the top 50 exporters in 2016, while the top 50 importers accounted for 34 per cent of the value of imports over the same period.
Trade in goods reporters by firm size, 2016

Our analysis also shows that the productivity of trading and non-trading businesses varies considerably. Our results suggest that the productivity of British businesses which declare international trade in goods was around 70 per cent higher on average than for businesses which did not in 2016. After controlling for their size, industry and foreign ownership status (table 4), businesses which declare goods exports are around 21 per cent more productive than non-traders; while businesses which declare goods imports are around 20 per cent more productive. These ‘productivity premia’ are notably lower for trade with the EU: consistent with lower barriers to EU goods trade enabling relatively less productive businesses to access these markets. While these results cannot establish causation – in particular, we cannot say whether being a trader causes a business to be higher productivity, or whether higher productivity businesses are more likely to trade goods – they offer the first large-scale analysis of productivity and trade in the UK.

Conclusions and future work
The recent slowdown in labour productivity growth is one of several ‘puzzling’ aspects of the UK's recent productivity performance. This article sets out three stylised facts which capture the broader UK's ‘productivity puzzle’: in addition to the recent slowdown in output per hour growth, the UK continues to lag behind other leading economies in labour productivity terms, and there remain wide differences in the productivity of businesses – even within relatively tightly defined industries. These features of the UK's recent performance have been the subject of considerable academic attention in recent years, as both explanations of and prescriptions for the slowdown have been sought by policy-makers.
The statistical innovations and analyses that are surveyed here do not explain the UK's recent experience, but they do shine a light on several features of recent UK productivity growth. More detailed industry-level estimates of labour productivity have shown that output per hour growth has varied considerably within high-level industry categories. At this more detailed industrial level, a majority of industries have seen productivity growth slow between the pre- and post-downturn periods, but a small number of industries account for a disproportionate fraction of the aggregate slowdown, including finance, telecommunications and parts of manufacturing. The development of regional output per hour worked estimates has also shown the wide gaps in productivity across the UK – even within the same industry – while new, more timely and more detailed estimates of multi-factor productivity have shown that this slowdown is largely an MFP slowdown.
Alongside the suite of productivity data that are available, analyses using the detailed data which underpin these aggregate estimates have provided new insights on structural features of the UK's productivity performance. The growing prevalence of older, larger businesses at the foot of the labour productivity distribution presents a challenge to our understanding of the drivers of business productivity, while updated estimates of the association between FDI status and productivity highlight the important link between productivity and international exposure. These results affirm earlier findings and provide policy-makers with an updated evidence base on which to form policy.
Finally, the development and mobilisation of new sources of data for productivity analysis has enabled a wide range of research in the UK context which has not previously been possible. The collection of detailed management practices information – and the apparent association between management and productivity – suggests that further research and analysis is needed to better understand if this is a lever that policy-makers can use. Evidence on the link between international trade status and productivity – showing that British businesses which trade goods are more productive than those which do not – also provides an important set of policy-relevant findings. These findings highlight the potential of new and administrative sources of data for policy analysis: mobilising more of the UK's data estate to better understand and address the UK's ‘productivity puzzles’.