Introduction
Dynamic response of ice sheets to warming is the largest unknown in the projection of sea level change (Allison et al. Reference Allison, Alley, Fricker, Thomas and Warner2009). The average rate of ice loss from the Antarctic ice sheet has probably increased from 30 Gt yr-1 over the period 1992–2001 to 147 Gt yr-1 over the period 2002–11 (IPCC 2013). The Antarctic ice sheet loses mass at its ice shelves bordering the Southern Ocean (Hellmer et al. Reference Hellmer, Kauker, Timmermann, Determann and Rae2012). These ice shelves are sensitive indicators of climate change due to their direct contact with both atmosphere and ocean.
It is probable that ice shelves will undergo enhanced melting (surface and basal) and increased calving in a warming climate (IPCC 2013). Munneke et al. (Reference Munneke, Ligtenberg, van den Broeke and Vaughan2014) suggested that significant mass loss from these ice shelves is due to the process of hydrofracturing, whereby a water-filled crevasse is opened by the hydrostatic pressure acting at the crevasse tip. Meltwater drips down into cracks; when it refreezes the cracks expand, weakening the shelf stability (Scambos et al. Reference Scambos, Ross, Bauer, Yermolin, Skvarca, Long, Bohlander and Haran2008).
Scatterometer derived melt information have been reported and discussed in detailed by Liu et al. (Reference Liu, Wang and Jezek2006), Trusel et al. (Reference Trusel, Frey and Das2012) and Wismann (Reference Wismann2000). Oza et al. (Reference Oza, Singh, Vyas and Sarkar2011) evaluated the surface melting observed over Amery Ice Shelf (AIS) using QuikSCAT scatterometer data using the ‘temporal reduction in backscatter (TRB)’ technique.
The spatial and temporal distribution of the melting index (MI) observed over Antarctic ice shelves, with special emphasis on Larsen C Ice Shelf (LIS) in West Antarctica, and AIS, West (WIS) and Shackleton (SIS) ice shelves in East Antarctica are described here. The association of interannual variations of MI with AIS rift propagation are also investigated. Further, the tropical linkage of MI is discussed.
Data
Scatterometer data
Daily composite QuikSCAT backscatter data of HH polarization (σ H ) at 4.45 km resolution (Early & Long Reference Early and Long2001) were used for the study. Mid-month data from January 2000 to July 2009 were obtained from the NASA sponsored Scatterometer Climate Record Pathfinder at Brigham Young University (http://scp.byu.edu). The backscatter time series data from QuikSCAT was extended by data available from Oceansat-2 OSCAT scatterometer for 2009–10. The enhanced resolution OSCAT data (at 25 km) was generated using the ‘drop in bucket’ method (Long & Drinkwater Reference Long and Drinkwater1994) from the L2A swath data. Mid-November data was utilized to normalize OSCAT data with respect to QuikSCAT data. Bhowmick et al. (Reference Bhowmick, Kumar and Kumar2014) reported that the difference between the average backscattering coefficients of these two sensors over Antarctica is lower than 0.25 dB.
RADARSAT data
RADARSAT-2 ScanSAR Wide Sigma-0 data (50 m resolution) was acquired on 10 February 2013 for the assessment of ice deformation taking place over AIS. Advancement in AIS rift length was assessed by comparing 2013 data with the Sigma-0 (25 m resolution) data for 2000, obtained from the RADARSAT-1 Antarctic Mapping Project (RAMP; http://bprc.osu.edu/rsl/radarsat/data/). Both datasets were co-registered using pseudo invariant ice features. The error in the identification could be of the order of 50 m.
Moderate resolution imaging spectroradiometer data
Data for each December–January–February period for 2002–10 (Scambos et al. Reference Scambos, Bohlander and Raup1996) from the moderate resolution imaging spectroradiometer (MODIS; 250 m resolution) were obtained from the National Snow and Ice Data Center (NSIDC). Similar to Walker et al. (Reference Walker, Bassis, Fricker and Czerwinski2013), we performed contrast stretching, toning and brightening of the images to enhance the visibility of rifts.
Ancillary data
Time series of cumulative melting surface index derived by Picard & Fily (Reference Picard and Fily2006) was obtained for AIS (http://lgge.osug.fr/~picard/melting/) and utilized to validate scatterometer derived MI. The automatic weather station (AWS) data was obtained from the Australian Antarctic Division (http://data.aad.gov.au/aadc) for the Davis station (68°35'S, 77°58'E) near to AIS. The AWS data was utilized to compute the sum of December and January monthly average air temperature for each summer.
Methodology
Computation of melting index
Snow is an inhomogeneous medium consisting of ice particles, air and liquid water (if wet). The backscattering coefficient of snow is highly dependent on the wetness and roughness of the snow cover (Fung Reference Fung1994). In case of wet snow, surface scattering dominates over volume scattering. The presence of liquid water in snow volume also causes an increase in the dielectric loss factor of the layer, which increases the absorption coefficient and reduces the penetration depth. During summer, the penetration depth reduces to the uppermost 3–4 cm (Liu et al Reference Liu, Wang and Jezek2006), resulting in a decrease in backscatter values.
The TRB technique has been utilized by Wismann (Reference Wismann2000) for monitoring seasonal snow melt over Greenland using the European Remote Sensing satellite (ERS) scatterometer data. Oza et al. (Reference Oza, Singh, Vyas and Sarkar2011) demonstrated the use of the TRB approach for monitoring surface melting over AIS. A similar approach was followed using QuikSCAT and Oceansat-2 OSCAT backscatter data of σ H to investigate the spatially varying pattern of MI, defined as:
 $$\eqalignno{{\rm MI}=\mathop{\Sigma}{{\rm (}\sigma _{{{\rm wH}}} {\hbox-}\sigma _{{{\rm si}}} {\rm )}} ({\rm dB}); \cr\ \quad{\rm sum}\,{\rm from}\,{\rm i}={\rm October}\,{\rm to}\,{\rm i}={\rm January}.$$
Here, σ wH is the average σ H for March to September of the preceding winter, and σ si is the mid-month σ H for each month (denoted ‘i’) from October to January. Therefore, MI (in dB) is the cumulative TRB for October to January and describes a temporally integrated reduction in σ H , which can be taken as an indicator of the magnitude of surface melting during the spring and summer.
Assessment of Amery Ice Shelf rift propagation
Interannual variations observed over AIS were analysed to assess the impact of surface melting on the propagation of rifts. The assessment was carried out over the rift system of AIS. This active rift system consists of two longitudinal-to-flow rifts ~30 km apart that initiated ~25 years ago and two transverse-to-flow rifts (Bassis et al. Reference Bassis, Fricker, Coleman, Bock, Behrens, Darnell, Okal and Minster2007). Rift length was measured by following the side wall from triple junction point to the tip on the MODIS imagery. The possible error in the identification could be of the order of one MODIS pixel (250 m). The rate of AIS rift propagation reported by Fricker et al. (Reference Fricker, Young, Coleman, Bassis and Minster2005) for the common period of 2001–04 was also utilized to assess the impact of surface melting.
Southern Oscillation Index correlation with melting index
The National Centers for Environmental Prediction (NCEP) and the National Center for Atmospheric Research (NCAR) reanalysis monthly surface air temperature (2.5°x2.5° gridded data) was utilized to assess the impact of atmospheric warming on MI. The El Niño and Southern Oscillation (ENSO) index correlation with surface melting was also investigated. The ENSO is an ocean–atmosphere oscillation manifested in shifting sea surface temperature anomalies in the tropical Pacific Ocean, and its variability is often measured by the ‘see-saw’ of surface pressure anomalies between Tahiti and Darwin (Tedesco & Monaghan Reference Tedesco and Monaghan2009). This is also known as the Southern Oscillation Index (SOI) and is significantly correlated with surface melting. The SOI data was obtained from the Earth System Research Laboratory Physical Sciences Division (Boulder, CO, http://www.esrl.noaa.gov/psd/).
The following three empirical relationships were investigated to study the impact of air temperature (Ta) and SOI on MI:
 $${\rm MI}={\rm a}_{{\rm 1}} {\times}{\rm T}_{{\rm a}} {\plus}{\rm a}_{{\rm 2}} $$
 $${\rm MI}={\rm b}_{{\rm 1}} {\times}{\rm SOI}{\plus}{\rm b}_{{\rm 2}} $$
 $${\rm MI}={\rm c}_{{\rm 1}} {\times}{\rm T}_{{\rm a}} {\plus}{\rm c}_{{\rm 2}} {\times}{\rm SOI}{\plus}{\rm c}_{{\rm 3}} ,$$
where Ta is the sum of December and January monthly average air temperatures, SOI is averaged October to January and MI is the spatial–temporal average MI value of ice shelves. The regression coefficients are denoted by a, b and c.
Results
Spatial–temporal pattern of melting index
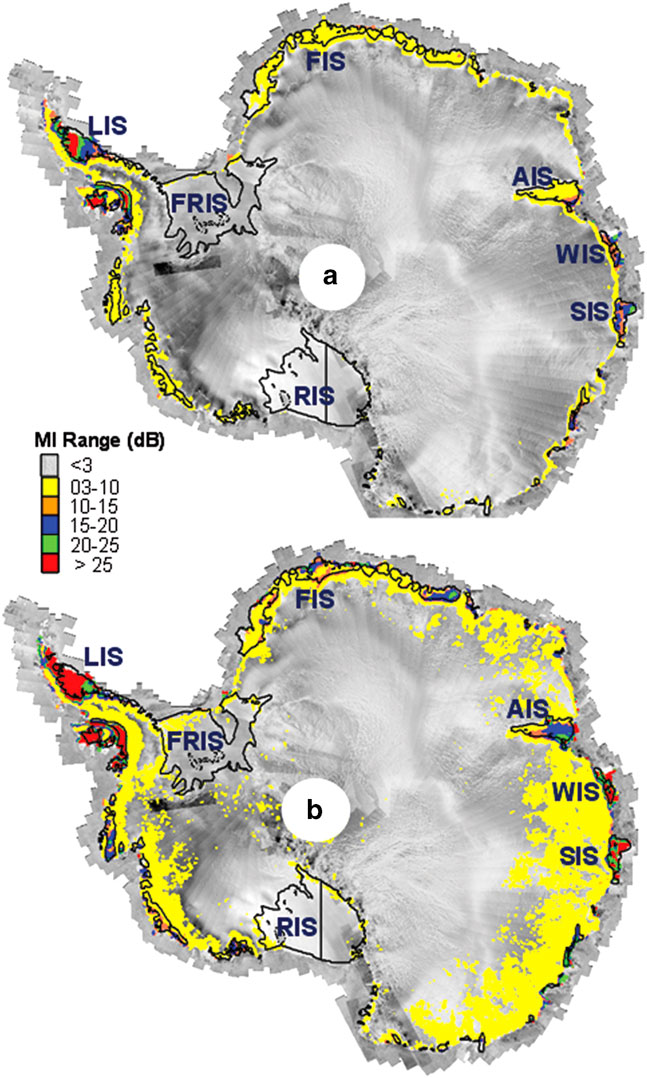
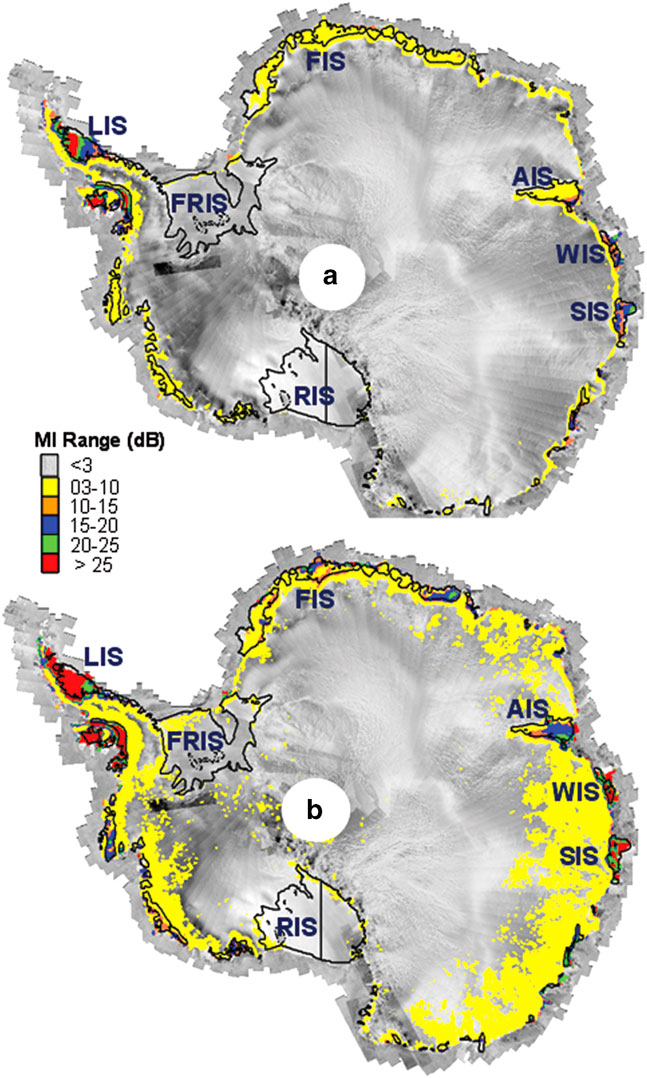
The distribution pattern of MI (Fig. 1) highlights large-scale surface melting events taking place around Antarctica. High values (> 20 dB) for the decade-averaged value, denoted MIav (Fig. 1a), and the decade-maximum value, MImx, (Fig. 1b) were observed over LIS. This is indicative of consistent high intensity summer melting over a decade. Low intensity surface melting (<3 dB per summer) was evident over the large Filchner-Ronne (FRIS) and Ross (RIS) ice shelves. The average value of the cumulative melting surface index (CMS; day km2) during 2001–06 over the FRIS region was 0.21 day km2 versus 8.5 day km2 for the Peninsula region. The lower CMS value observed over FRIS supports the low intensity melting apparent in this region. As with LIS in West Antarctica, SIS and WIS in East Antarctica also showed high MImx and MIav. This suggests that East Antarctic ice shelves are not immune to the effect of warming.
Decadal (2000–10) a. average (MIav) and b. maximum (MImx) statistics of melting index (MI). The MI classes are overlaid on the RADARSAT Antarctic Mosaic obtained from RAMP. AIS=Amery, FIS=Fimbul, FRIS=Filchner-Ronne, LIS=Larsen C, RIS=Ross, SIS =Shackleton, WIS=West ice shelves.
Melting index pattern over Amery Ice Shelf
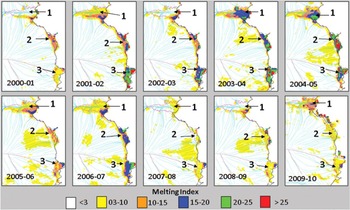
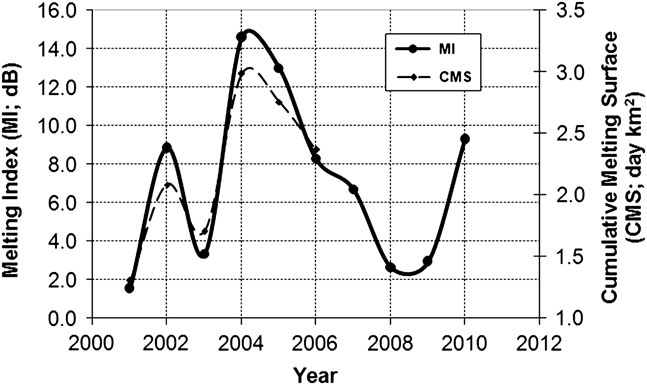
Over the AIS, a significant difference (Fig. 1) was seen between MImx (10–25 dB) and MIav (<10 dB). The spatial distributions of MI plotted for each summer show high interannual variability (Fig. 2). The finer pattern visible over ice shelves from 2000–01 to 2008–09 is missing in 2009–10, possibly due to the coarser spatial resolution of OSCAT data. High correlation (r=0.98) found between MI and CMS variations (Fig. 3) confirms the validity of MI derived from mid-month scatterometer data.
Spatial distribution of melting index (MI; dB) for the Amery Ice Shelf (1), West Ice Shelf (2) and Shackleton Ice Shelf (3) for each summer from 2000–01 to 2009–10. RAMP ice flow lines are shown in cyan and ice divide lines in maroon. Years 2000–01 to 2008–09 are derived from QuikSCAT scatterometer data, while 2009–10 is derived from OSCAT scatterometer data.

Interannual variations of surface melting for AIS, determined from melting index (MI; dB) and cumulative melting surface index (CMS; day km2).
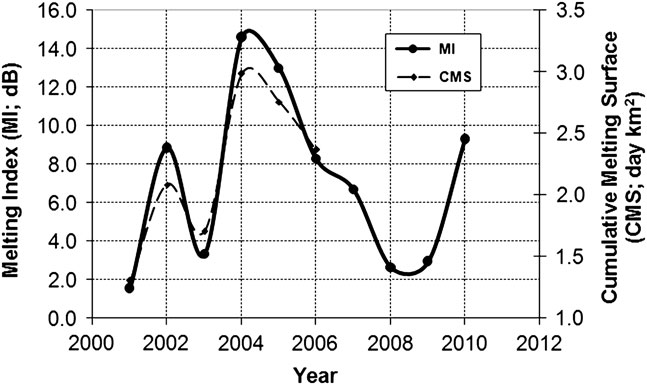
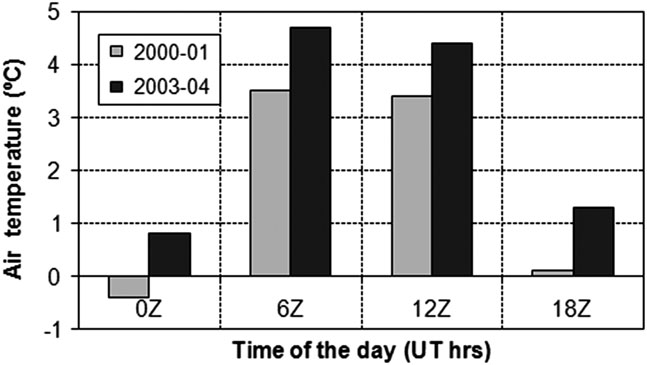
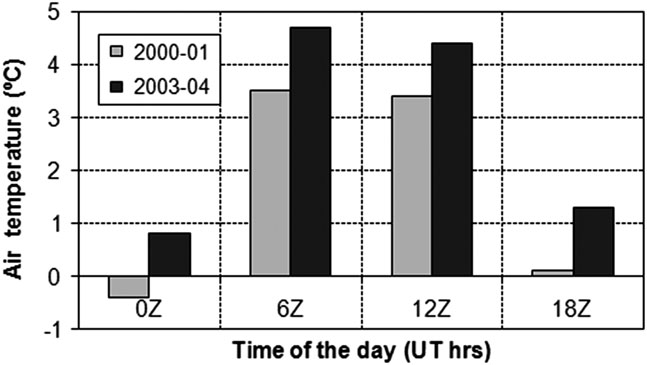
As evident from Fig. 3, MI averaged over AIS was lowest in 2000–01 (<2 dB) and highest in 2003–04 (>14 dB). The cumulative December and January monthly average air temperature data (Fig. 4) highlights that the temperatures observed at 00h00 and 18h00 in 2000–01 were either near-zero or subzero, whereas in 2003–04 it was ~1°C or higher. Moreover, in 2003–04 at 06h00 and 12h00 temperatures were >4°C. The subzero temperatures recorded at 00h00 and 18h00 in 2000–01 could have resulted in refreezing of meltwater produced during the warmer period between 06h00 to 12h00, which is reflected in the lower MI observed in 2000–01.
Sum of December and January monthly average air temperatures recorded at Davis Station.
Present status of Amery Ice Shelf rift system
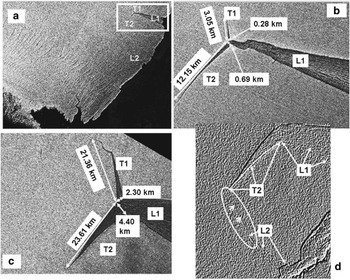
Over the area of AIS covering a rift system (L1-L2-T1-T2; Fig. 5), MImx was >15 dB and MIav was >10 dB (Fig. 1).
Amery Ice Shelf covering the L1-L2-T1-T2 rift system. Status of rift system in b. 2000 and c. 2013. d. Status of the ‘loose tooth’ in 2013, a linear deformation feature is visible in the encircled region highlighted by arrows.

Examination of the shift in the tip of the L1-T1-T2 junction point indicates an advancement of ~16 km from 2000 to 2013 (Fig. 5). It is apparent that connection between the tips of L2 and T2 will lead to disintegration of a large tabular iceberg from AIS. On the RADARSAT image (Fig. 5d), a deformation feature is visible that originates from the tip of L2 and extends towards the tip of T2. This feature indicates the possibility of detachment of a ~ 800 km2 tabular iceberg, also known as the ‘loose tooth’ (Fricker et al. Reference Fricker, Young, Coleman, Bassis and Minster2005).
Between 2000 and 2013, a larger increase in the length of T1 (~ 18 km) was observed compared to T2 (~ 11.5 km) (Fig. 5b & c). However, the increase in width for T2 (~ 3.7 km) was ~1.8 times that observed for T1 (~ 2.0 km).
Impact of melting index on Amery Ice Shelf rift propagation
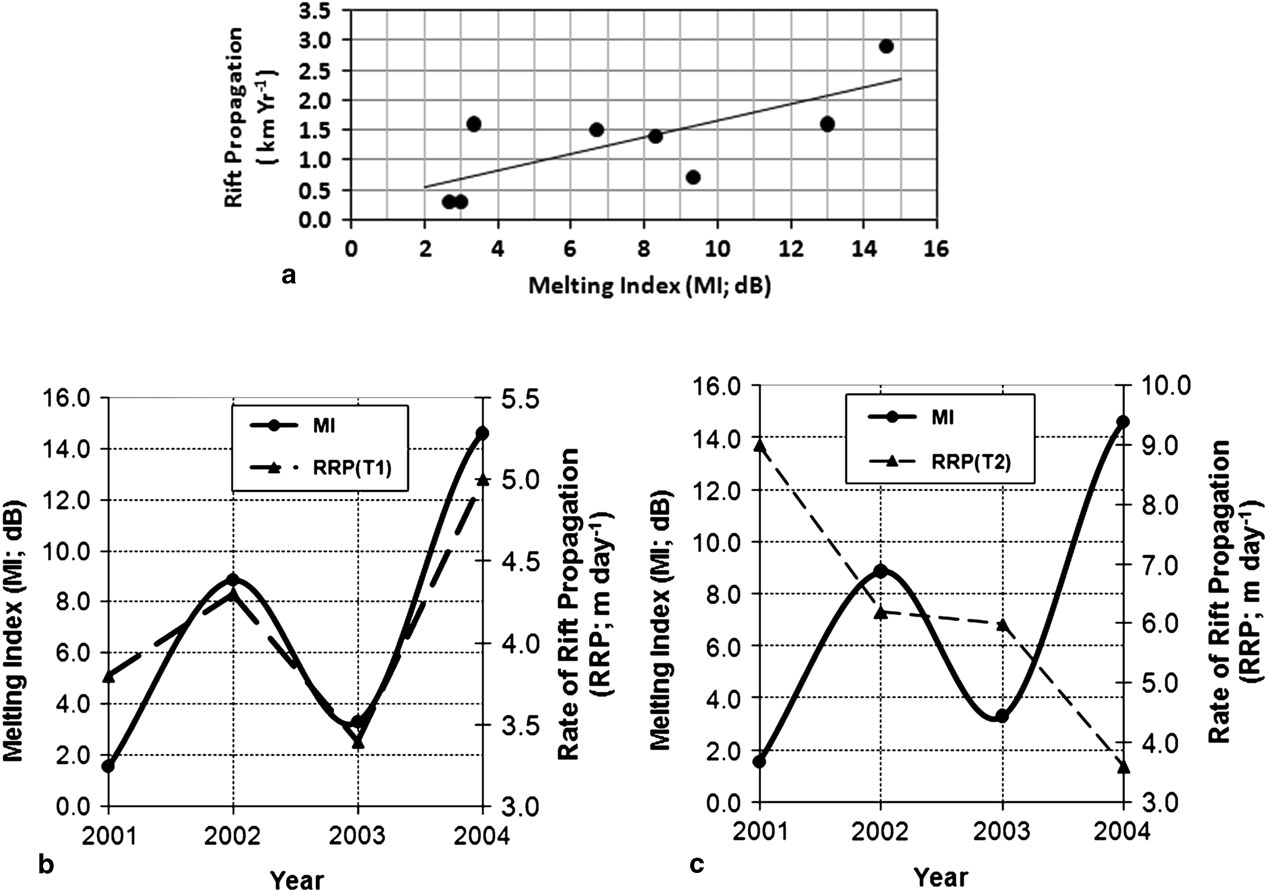
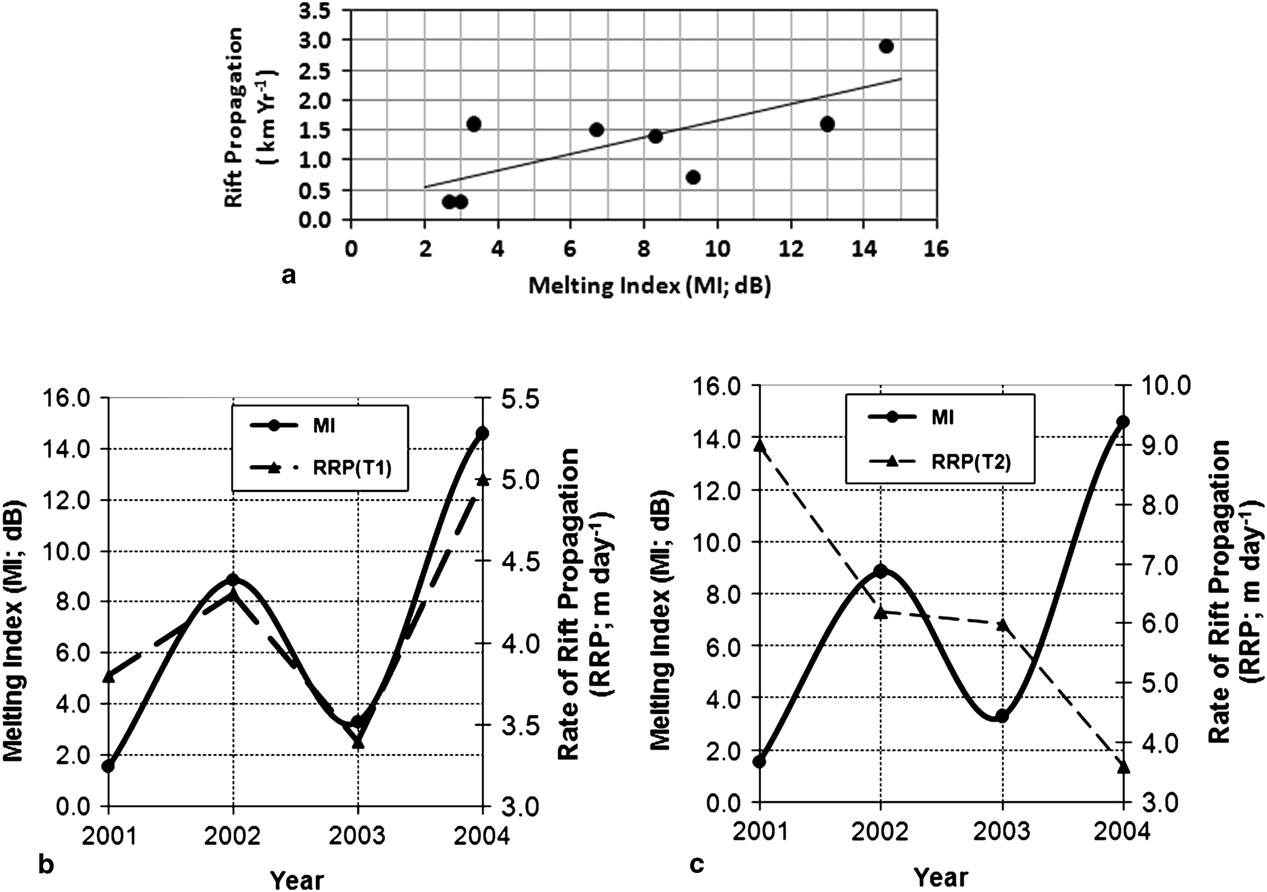
The relationship between MI and rift propagation (P; the increase in length from previous year) for T1 was investigated using a longer time series (2003–10). The following empirical relationship (Fig. 6a) was obtained, which indicates that propagation distance per year increases with the increase in surface melting:
 $${\rm P}=0.{\rm 1616}\,{\rm \times}\,{\rm MI};\,r^{2} =0.{\rm 86};\,{\rm SE}=0.{\rm 6}0$$
Association of the rate of rift propagation (RRP; m day-1) data (Fricker et al. Reference Fricker, Young, Coleman, Bassis and Minster2005) with surface melting is shown in Fig. 6b & c. As observed in Fig. 6b, interannual increase or decrease in RRP for rift T1 is highly correlated (r=0.93) with scatterometer derived MI variations. Meltwater is denser than ice. Thus meltwater percolating into the rift generates stress at the tip that could trigger rift propagation. In contrast to T1, poor correlation was observed between MI and RRP for rift T2 (Fig. 6c). This could be due to the larger width of T2; surface melt driven mechanisms dominate on narrow rifts, but ocean swell and marine ice mechanisms may also play critical roles for a wide rift.
Interannual variations in melting index (MI; dB) and rate of rift propagation. a. Correlation between MI and rift propagation (km yr-1). Rate of rift propagation (m day-1) for b. T1 and c. T2.
Southern Oscillation Index correlation with melting index
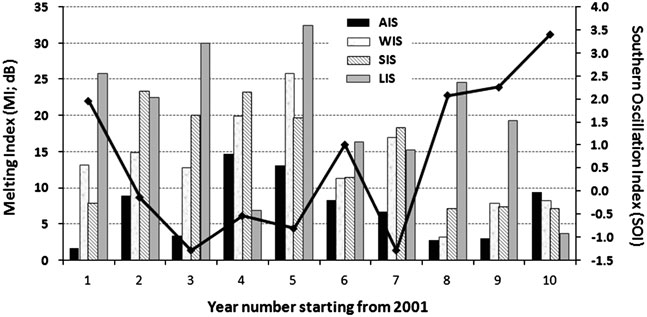
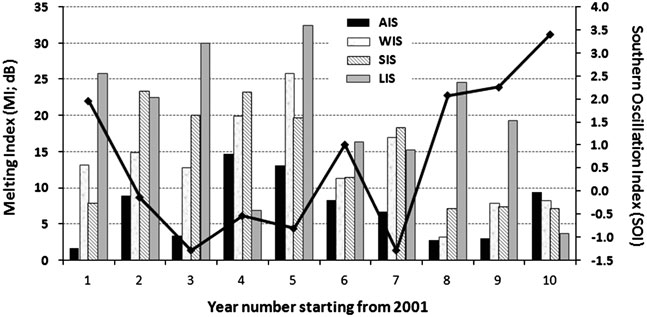
Figure 7 shows the yearly variations in average MI observed over LIS, AIS, SIS and WIS. Associated SOI values are also shown. Extreme melting events are generally coincident with strong negative SOI phase (SOI<-0.5). Strong positive SOI phase is associated with low surface melting, with some exceptions for LIS.
Interannual variations of melting index (MI; dB) and Southern Oscillation Index (SOI). AIS=Amery, LIS=Larsen C, SIS =Shackleton, WIS=West ice shelves.
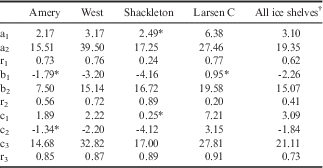
Regression analyses following Eqs (2), (3) & (4) show the dependence of MI on Ta and SOI (Table I). The r1, r2 and r3 correlation coefficients are obtained from Eqs (2), (3) & (4), respectively. The value of a1 is highest for LIS and lowest for AIS; indicating that the impact of change in Ta on surface melting is higher for LIS compared to AIS. Air temperature alone is insufficient to predict the change in MI for SIS; MI variations are better explained by SOI (r2=0.89). Values of r1 and r2 obtained for WIS indicate the considerable influence of both parameters (Ta and SOI) on variations observed in MI. Incorporation of both parameters in Eq. (4) significantly improves the correlation coefficient (r3) as seen in Table I. Findings suggest that ENSO signals represented by SOI explain some of the MI variance that remained unexplained after considering the effect of atmospheric temperature (Ta).
Summary of regression analysis for melting index–air temperature–Southern Oscillation Index relationships, following Eqs (2–4).

Melting index is measured in dB.
Results are statistically significant at 95% confidence level except for the cases indicated by *.
† The relationship developed by incorporating data points from all four ice shelves.
Discussion
Lower melting index pattern over large ice shelves
Very low intensity surface melting is observed (Fig. 1) over the large FRIS and RIS. Most mass loss from these ice shelves is by intermittent calving flux and basal melting (Hellmer et al. Reference Hellmer, Kauker, Timmermann, Determann and Rae2012, Depoorter et al. Reference Depoorter, Bamber, Griggs, Lenaerts, Ligtenberg, van den Broeke and Moholdt2013, Rignot et al. Reference Rignot, Jacobs, Mouginot and Scheuchl2013, Moholdt et al. Reference Moholdt, Padman and Fricker2014).
Melting index pattern over Larsen, Shackleton and West ice shelves
Over the study period, LIS showed high melting. This result is supported by the findings of Trusel et al. (Reference Trusel, Frey and Das2012), who reported >100 melt days per annum for LIS. In this region, mean summer temperatures have risen to near-melting and the length of the melt season has doubled over the past two decades (Glasser et al. Reference Glasser, Kulessa, Luckman, Jansen, King, Sammonds, Scambos and Jezek2009). This atmospheric warming could be a key factor for considerable surface melting evident over LIS. Such phenomena lead to acceleration of surface melt driven processes, such as meltwater ponds and downward penetration of water through crevasses. It has been suggested that meltwater acts as a mechanical force in crevasses, to cause fractures in the ice shelf leading to its disintegration (Scambos et al. Reference Scambos, Hulbe and Fahnestock2003).
Similarly, high (>60) numbers of melt days per annum support the decade long high MI values evident over SIS and WIS. The loss of ice mass from SIS and WIS is part of a long-term trend that has been evident since the early twentieth century (Young & Gibson Reference Young and Gibson2007).
Impact of melting index on rift propagation
Episodic high melting events play a key role in the development of surface melt driven features, such as crevasses and rifts. Over the region of the AIS that covers the rift system (Figs 1, 2 & 5), the MI values were >10 dB. Trusel et al. (Reference Trusel, Frey and Das2012) also reported this as the region of AIS most affected by melt.
Higher RRP during summer was reported by Fricker et al. (Reference Fricker, Young, Coleman, Bassis and Minster2005). Another important finding by Fricker et al. (Reference Fricker, Young, Coleman, Bassis and Minster2005) was an increasing RRP trend from 1996–2004, with an exception of a relative decrease in 2002–03. The relatively low RRP value reported in 2002–03 coincides with relatively low surface melting observed in the respective summer (Fig. 6b). However, for other years, with MI identical to 2003, lower rift propagation is observed (Fig. 6a). This indicates that other external forcings are also controlling rift propagation, e.g. ocean swells, tsunamis or interactions between crevasses and rifts (Walker et al. Reference Walker, Bassis, Fricker and Czerwinski2013).
Correlations with tropical Pacific Ocean variability
Oza et al. (Reference Oza, Singh, Vyas and Sarkar2011) demonstrated that, as expected, monthly Ta in the summer (December and January) has an impact on the surface melting observed at various sites over AIS. As suggested by Scambos et al. (Reference Scambos, Hulbe and Fahnestock2003) for LIS, AIS may be susceptible to break up, subject to the continuation of a warming trend. In addition to Ta, as suggested by Turner (Reference Turner2004), variations in MI may be linked with the SOI. During the study period, strong melt summers (high MI) coincide with strongly negative SOI (Fig. 7). Tedesco & Monaghan (Reference Tedesco and Monaghan2009) also found similar anti-correlation between passive microwave radiometer based MI and SOI.
In the present study, 2.5°x2.5° resolution NCEP/NCAR reanalysis of Ta data was utilized. The error in the NCEP/NCAR data could explain the lower correlation obtained for some ice shelves. Bromwich & Fogt (Reference Bromwich and Fogt2004) indicate that ERA40 reanalysis perform better than NCEP/NCAR. However, as mentioned by Lampkin & Karmosky (Reference Lampkin and Karmosky2009), the quality of NCEP/NCAR output has been shown to be better for the summer, where more satellite information was fed into the reanalysis. In addition to the model error, Ta data could be contaminated by the contribution from the ice–ocean interface due to the coarse resolution grid. Further studies are planned to incorporate high spatial resolution satellite derived Ta, which enables pixel-level investigations.
Conclusions
The data available from Oceansat-2 OSCAT scatterometer extends the QuikSCAT scatterometer based time series of surface MI. Decadal (2000–10) spatial–temporal analysis of MI has been carried out over Antarctic ice shelves. Detailed investigations have been carried out for four ice shelves: LIS in West Antarctica and AIS, WIS and SIS in East Antarctica.
Low intensity surface melting was observed over the large ice shelves, FRIS and RIS. However, the high intensity surface melting observed for WIS and SIS is comparable with that observed for LIS. This confirms that ice shelves in East Antarctica are not immune from warming effects and demand constant monitoring.
The importance of scatterometer derived MI in understanding surface deformation changes have been demonstrated over AIS. Higher correlations were obtained between the MI and rift propagation for narrow rifts compared to wider rifts. The tropical linkage of MI with ENSO anomalies has been demonstrated. To conclude, ENSO and surface air temperature are important parameters influencing ice surface melting.
Acknowledgements
This work was carried out under projects funded by Space Applications Centre, Indian Space Research Organisation. The author is grateful to Dr R.R. Navalgund and Mr A.S. Kiran Kumar for their kind guidance provided to take up the polar science activities. Valuable suggestions received from Dr J.S. Parihar and Dr P.K. Pal are appreciatively acknowledged. Critical review and kind advice received from Dr Raj Kumar is deeply acknowledged. The author thankfully acknowledges the comments received from Dr M.P. Oza to improve the manuscript and to Mr D.A. Maroo for reproduction of figures in journal format. Thanks go to the comments and suggestions from two anonymous reviewers that prompted revisions that have led to a clearer presentation of the results of analysis and discussion. The valuable suggestions and encouragement during the revision process received from Dr L. Padman, journal Editor, are gratefully acknowledged. Efforts made by the editorial team to improve the manuscript are sincerely acknowledged.
Author contribution
Author confirms that the results and discussion provided in the article are based on his contribution. Entire manuscript has been prepared and all revisions were carried out only by the author.