INTRODUCTION
Among Demospongiae, the ‘keratose’ sponges, present problems for taxonomic classification due to the scarcity of morphological characters and absence of spicules (Pinheiro & Hajdu, Reference Pinheiro and Hajdu2001; Bergquist & Cook, Reference Bergquist, Cook, Hooper and van Soest2002a, Reference Bergquist, Cook, Hooper and van Soestb; Schmitt et al., Reference Schmitt, Hentschel, Zea, Dandekar and Wolf2005; Pinheiro et al., Reference Pinheiro, Hajdu and Custódio2007). The genus Aplysina Nardo, 1834 is widely distributed, particularly in the Atlantic Ocean (van Soest, Reference van Soest, van Soest, van Kempen and Braekman1994). This marine sponge is widespread along the Brazilian coast and presents high plasticity, displaying a large number of morphotypes and colorations connected with habitat diversity (Pinheiro & Hajdu, Reference Pinheiro and Hajdu2001). The few morphological characters that can be used in Aplysina taxonomy are related to specimen colour and form as well as the arrangement of spongin fibres, which generates uncertainties in alpha classification (Pinheiro & Hajdu, Reference Pinheiro and Hajdu2001; Schmitt et al., Reference Schmitt, Hentschel, Zea, Dandekar and Wolf2005; Pinheiro et al., Reference Pinheiro, Hajdu and Custódio2007).
Molecular data sets are commonly used as an aid to taxonomic classification of many organisms, especially those lacking robust morphological characters (Hillis, Reference Hillis1987; Giribet & Wheeler, Reference Giribet and Wheeler2002; Vink & Paterson, Reference Vink and Paterson2003; Malhotra & Thorpe, Reference Malhotra and Thorpe2004). The single-strand conformation polymorphism (SSCP) technique has been used as a DNA mutation screening method (Soto & Sukumar, Reference Soto and Sukumar1992), and turned out to be an important tool to identify polymorphisms, including speciation patterns in many organisms (Sunnucks et al., Reference Sunnucks, Wilson, Beheregaray, Zenger, French and Taylor2000; Zhu et al., Reference Zhu, D'Amelio, Paggi and Gasser2000; Colombo et al., Reference Colombo, Mangiagalli and Renon2005). In addition, it has permitted comparisons between molecular and morphological data in Porifera (Lopez et al., Reference Lopez, Peterson, Willoughby, Wright, Enright, Zoladz, Reed and Pomponi2002; Lôbo-Hajdu et al., Reference Lôbo-Hajdu, Guimarães, Salgado, Lamarão, Vieiralves, Mansure and Albano2004; Hoshino et al., Reference Hoshino, Saito and Fujita2008). In this technique, single nucleotide differences in PCR amplified DNA can elicit different conformations in denatured strands as they migrate on polyacrylamide gel electrophoresis (PAGE). This change of conformation allows the clustering of haplotype patterns between individuals of the same species and the exclusion of different patterns from species previously established by morphological characters (Sunnucks et al., Reference Sunnucks, Wilson, Beheregaray, Zenger, French and Taylor2000; Lopez et al., Reference Lopez, Peterson, Willoughby, Wright, Enright, Zoladz, Reed and Pomponi2002; Colombo et al., Reference Colombo, Mangiagalli and Renon2005). The results of the clustering analyses reveal differences not determined from direct primary structure methods, such as DNA sequencing.
The use of the internal transcribed spacer (ITS) region of nuclear ribosomal genes as a molecular tool for the differentiation of sponge species has been initially reported by our group (Lôbo-Hajdu et al., Reference Lôbo-Hajdu, Lamarão, Guimarães, Salgado, Vieiralves, Mansure and Albano2002) and by Lopez et al. (Reference Lopez, Peterson, Willoughby, Wright, Enright, Zoladz, Reed and Pomponi2002). Subsequently, the ITS1 and ITS2 fragments have been used as molecular markers in Porifera, usually in combination with DNA sequencing (Duran et al., Reference Duran, Giribet and Turon2004; Wörheide et al., Reference Wörheide, Nichols and Goldberg2004; Nichols & Barnes, Reference Nichols and Barnes2005; Schmitt et al., Reference Schmitt, Hentschel, Zea, Dandekar and Wolf2005; Alvarez et al., Reference Alvarez, Krishnan and Gibb2007; Heim et al., Reference Heim, Nickel, Brümmer, Custódio, Lôbo-Hajdu, Hajdu and Muricy2007; Hoshino et al., Reference Hoshino, Saito and Fujita2008). Alvarez et al. (Reference Alvarez, Krishnan and Gibb2007) have recently reviewed the role of ITS sequences on sponge phylogenetic studies, highlighting the use of these markers for population studies.
The aim of this work was to characterize Aplysina species from the Brazilian coast using ITS1 and ITS2 polymorphic regions revealed by SSCP patterns as a species discrimination tool and to determine how these patterns correlate with the species described by Pinheiro et al. (Reference Pinheiro, Hajdu and Custódio2007) based on morphological characters.
MATERIALS AND METHODS
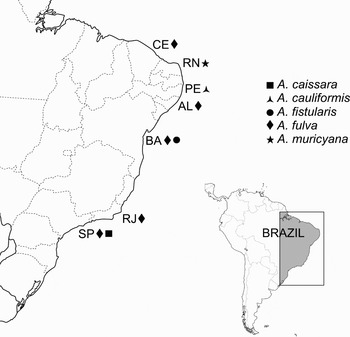
The Aplysina samples were either collected at several sites of the Brazilian coast using SCUBA and snorkelling or taken from vouchers deposited in the Porifera collections of the Museu Nacional/Universidade Federal do Rio de Janeiro (MNRJ) or of the Department of Zoology/Universidade Federal do Rio de Janeiro (UFRJPOR) (Table 1; Figure 1). The species used in this study were Aplysina caissara Pinheiro & Hajdu, Reference Pinheiro and Hajdu2001; Aplysina cauliformis (Carter, 1882) Aplysina fistularis (Pallas, 1766) Aplysina fulva (Pallas, 1766) Aplysina muricyana Pinheiro, Hajdu & Custódio, Reference Pinheiro, Hajdu and Custódio2007 and Aplysina sp.
Collection sites of Aplysina species used in this study. Different species were indicated by codes. Brazilian States: CE, Ceará; RN, Rio Grande do Norte; PE, Pernambuco; AL, Alagoas; BA, Bahia; RJ, Rio de Janeiro; SP, São Paulo.

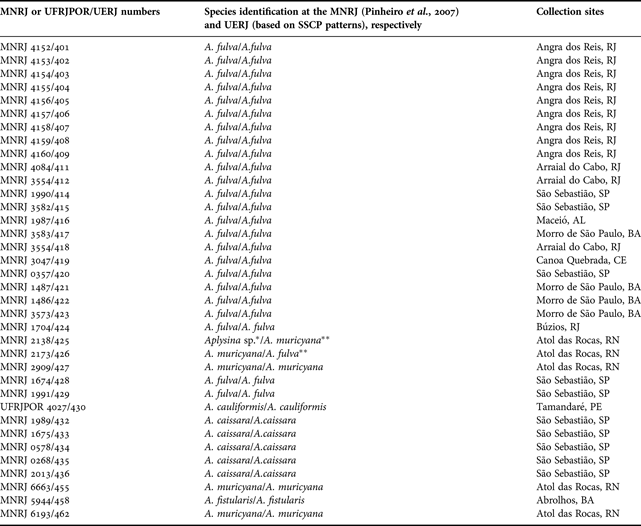
MNRJ or UFRJPOR voucher numbers and UERJ collection numbers, species identification, and collection sites.
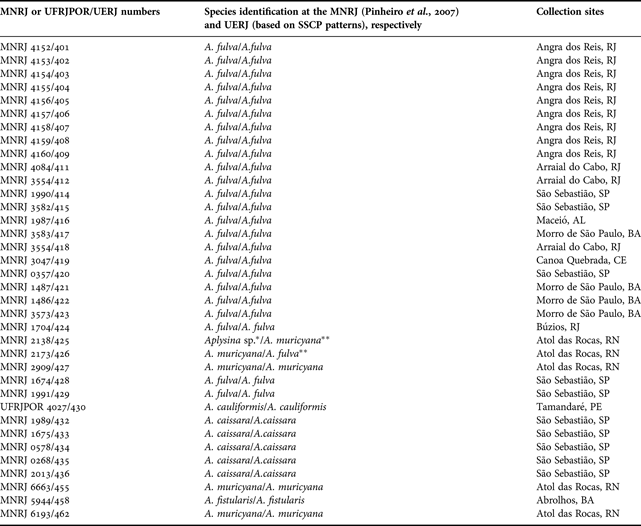
MNRJ, Museu Nacional/Universidade Federal do Rio de Janeiro; UFRJPOR, Dep. Zoology, Universidade Federal do Rio de Janeiro; UERJ, Universidade do Estado do Rio de Janeiro. Brazilian States: AL, Alagoas; BA, Bahia; CE, Ceará; PE, Pernambuco; RN, Rio Grande do Norte; RJ, Rio de Janeiro; SP, São Paulo. *This specimen was not analysed by Pinheiro et al. (207). **No concordance between data generated by the ITS-SSCP analysis and morphology.
Genomic DNA extraction and PCR amplification were performed according to protocols described in Lôbo-Hajdu et al. (Reference Lôbo-Hajdu, Guimarães, Salgado, Lamarão, Vieiralves, Mansure and Albano2004). The primers used to amplify the ITS regions were: 18SFow: 5′TCA TTT AGA GGA AGT AAA AGT CG3′ and 5.8SRev: 5′GCG TTC AAA GAC TCG ATG ATT C3′ for ITS1, and 5.8SFow: 5′GAA TCA TCG AGT CTT TGA AGC C3′ plus 28SRev: 5′GTT AGT TTC TTT TCC TCC GCT T3′ for ITS2 (Lôbo-Hajdu et al., Reference Lôbo-Hajdu, Guimarães, Salgado, Lamarão, Vieiralves, Mansure and Albano2004).
The PCR products of standard samples were purified using GFX™ PCR DNA and gel band purification kit (GE Healthcare) and cloned with the PGM-T kit (Promega) following the manufacturer's instructions. DNA sequencing was performed with the ET Dye terminator cycle sequence kit (GE Healthcare) and analysed in a MegaBace 1000 automated sequencer (GE Healthcare). The sequences were assembled and edited using BioEdit sequence alignment editor version 7.0.1 (Hall, Reference Hall1999) and deposited at GenBank with accession numbers (EU551854 and EU707902-EU707920) as shown in Figure 2.
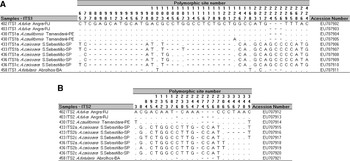
Polymorphic sites among ITS1 (A) and ITS2 (B) regions of Aplysina samples. ITS1 and ITS2 sequences were deposited at GenBank (accession numbers are given). Dot symbols (.) mean equivalence of nucleotides in contrast with top sequence, and minus symbols (-) mean deleted nucleotides.

The samples were subjected to electrophoresis in an 8% polyacrylamide non-denaturing gel for SSCP (Orita et al., Reference Orita, Suzuki, Sekiya and Hayashi1989). For this, to each 3 µl of PCR product, 5 µl of denaturing buffer were added (10 mM NaOH, 95% formamide, 0.05% bromophenol blue and 0.05% xylene cyanol) and heated for 5 minutes at 95°C. Immediately after this step, samples were placed on ice for 1 minute and applied to the gel which was run for 18 hours in a cold chamber (4°C) under an electric field of 15V/cm. The SSCP bands were visualized after silver nitrate impregnation (Bassam et al., Reference Bassam, Caetano-Anolles and Gresshoff1991) and the gel was dried and scanned. This whole procedure was repeated at least twice for each specimen.
The resulting SSCP patterns from specimens characterized by morphology and DNA sequencing as A. fulva, A. cauliformis and A. fistularis were used as standards for a comparison with unknown or presumed new species and for those species that presented uncertainties on alpha taxonomy. Aplysina samples from different habitats of the Brazilian coast were also characterized by ITS-SSCP analysis in order to search for possible cryptic species or even new ones.
RESULTS
We were able to amplify the ITS1 and ITS2 regions from 36 samples of the genus Aplysina used in this study, even from those that were preserved for more than a decade at museum collections. The ITS1 and ITS2 PCR amplicons obtained from well characterized samples of Aplysina species (Aplysina fulva, Aplysina cauliformis and Aplysina fistularis) showed sizes up to 438 and 349 base pairs (bp), respectively.
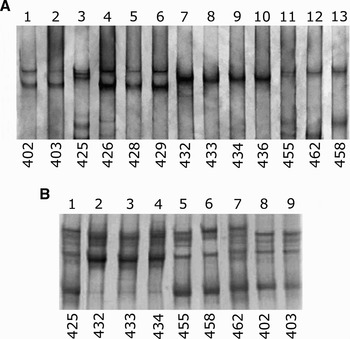
The SSCP gel in Figure 3A presents ITS1 migration patterns of different Aplysina species (A. fulva, lanes 1–2 and 4–6; A. caissara, lanes 7–10; A. muricyana, lanes 3, 11–12; and A. fistularis, lane 13). The SSCP patterns may be grouped as four distinct variants: variant 1 on lanes 1, 2, 4, 5 and 6; variant 2 on lanes 7–10; variant 3, on lanes 3, 11 and 12; and variant 4 on lane 13. The ITS1 region of Aplysina cauliformis gave a similar pattern to A. fulva on the 8% SSCP gel, but when it was analysed on a more concentrated 12% gel we could clearly distinguish it from A. fulva (data not shown). The alignment of the ITS1 sequences of both species (Figure 2) revealed that only one nucleotide difference can be seen between them, which is likely to be the reason for such similar SSCP patterns.
(A) Interspecific variation of ITS1-SSCP patterns in Aplysina. Lanes 1–2, and 4–6 A. fulva (402, 403, 426, 428 and 429); lane 3 Aplysina sp. (425); lanes 7–10 A. caissara (432, 433, 434 and 436); lanes 11–12 A. muricyana (455 and 462); lane 13 A. fistularis (458); (B) interspecific variation of ITS2-SSCP patterns in Aplysina. Lane 1 Aplysina sp. (425); lanes 2–4 A. caissara (432, 433 and 434); lane 5 A. muricyana (455); lane 6 A. fistularis (458); lane 7 A. muricyana (462); lanes 8–9 A. fulva (402, 403).

Sequencing showed that some individuals of A. cauliformis and A. caissara possess more than one copy of ITS sequences. For ITS1, samples 430 and 433 presented two copies each, and sample 436, three copies. For ITS2, samples 433 and 436 presented three copies each (Figure 2).
To test whether the SSCP technique could be used as an aid to the identification of Aplysina species we used two samples (samples 425 and 426, both from Atol das Rocas/RN, Figure 1; Table 1) that presented some ambiguities on their classification. These samples were compared with the established patterns from the same genus and, as seen in Figure 3A, sample 426 presented a pattern that corresponded to A. fulva samples (samples 402, 403, 428 and 429). The SSCP patterns also showed that sample 425 grouped with A. muricyana (samples 455 and 462).
In order to illustrate the difficulties faced by experts in Aplysina taxonomy and how SSCP analysis can be useful, samples 428 and 429 (Figure 3A, lanes 5 and 6, respectively) that had been previously classified as A. aff. cauliformis by Pinheiro & Hajdu (Reference Pinheiro and Hajdu2001) were taken as an example (Table 1). Upon a later review, the same authors, using a more stringent procedure based on external morphology, identified these samples as A. fulva (Pinheiro et al., Reference Pinheiro, Hajdu and Custódio2007). Our SSCP analysis had clearly grouped them with A. fulva, leaving no doubt about their classification. Likewise, the SSCP patterns showed that samples 432 to 436 (Figure 3A, lanes 7–10) are members of the same species.
Figure 3B illustrates ITS2 migration patterns of the different Aplysina species. In this case, the SSCP patterns could be grouped in three distinct SSCP variants: variant 1 is seen on lanes 1 and 5–7, variant 2 on lanes 2–4 and variant 3 on lanes 8 and 9. Individuals belonging to A. muricyana and A. fistularis showed similar patterns for the ITS2 region, but distinct from A. caissara and A. fulva species (Figure 3B). This indicates that the ITS2 region is very homogeneous for these groups and is unlikely to be useful for taxonomic discrimination at this level.
DISCUSSION
As reported by Schmitt et al. (Reference Schmitt, Hentschel, Zea, Dandekar and Wolf2005), the use of ITS2 sequences for phylogenetic analysis in Aplysinidae was possible only after using support trees based on secondary structure analysis. In this respect, the ITS1 region seems to be more amenable to generate species specific SSCP patterns for this genus because of the presence of a higher number of nucleotide polymorphisms and deletions among the different Aplysina species, as illustrated in Figure 2. Interestingly, the ITS2 region has been described as being more variable than the ITS1 region for sponges (Wörheide et al., Reference Wörheide, Nichols and Goldberg2004) and other organisms (Deprés et al., Reference Deprés, Kruger, Imbert and Adamson1995; Vidigal et al., Reference Vidigal, Caldeira, Simpson and Carvalho2000, Reference Vidigal, Magalhães, Caldeira, Simpson and Carvalho2002). These observations diverge from earlier data obtained by us in which the ITS1 region seemed to present higher variability than the ITS2 region for Hymeniacidon aff. heliophila using SSCP (Lôbo-Hajdu et al., Reference Lôbo-Hajdu, Guimarães, Salgado, Lamarão, Vieiralves, Mansure and Albano2004).
The ITS is present as multiple copies in the genome which do not evolve independently. Usually, mutations occurring in one of these repeats are copied to the rest of the gene family members, through mechanisms of concerted evolution such as unequal crossing over and high-frequency gene conversion, but this is not a strict rule (Arnheim, Reference Arnheim, Nei and Koehn1983). As a result, non-homologous sequences can be found within one individual genome and potentially confound phylogenetic inferences especially at intraspecific levels (Wörheide et al., Reference Wörheide, Nichols and Goldberg2004). We observed intragenomic variation (IGV) in both ITS1 and ITS2 regions (Figure 2). The IGV in the ITS2 spacer of Aplysina aerophoba Nardo, 1843 has been investigated by Schmitt et al. (Reference Schmitt, Hentschel, Zea, Dandekar and Wolf2005). Six of eight clones from a single specimen were identical, while two clones showed three variable sites each. However, a screening for intraspecific polymorphism in four specimens of A. aerophoba found 100% of identity for ITS2 region. Therefore, the low extent of IGV variation can probably be neglected for phylogenetic analysis, but not for population studies. The SSCP technique can bypass the sequencing limitations because its patterns are still conserved even though IGV exists.
The homogeneity of the ITS-SSCP patterns obtained from all samples of A. fulva collected in distant points of the Brazilian coast confirms the alpha taxonomic classification described by Pinheiro & Hajdu (Reference Pinheiro and Hajdu2001) and Pinheiro et al. (Reference Pinheiro, Hajdu and Custódio2007), despite the existence of different morphotypes. In 34 of the 36 samples, there was concordance between data generated by the ITS-SSCP analysis and morphology according to Pinheiro et al. (Reference Pinheiro, Hajdu and Custódio2007). One sample (426) had no concordance, since morphology indicated A. muricyana, and SSCP A. fulva. Sample 425 is an undescribed species, but according to SSCP patterns it grouped with A. muricyana samples (Figure 3A, lane 3 and Figure 3B, lane 1).
In conclusion, the use of molecular data sets combined with traditional morphological data is crucial and highly recommended for the systematists (Hillis, Reference Hillis1987; Patterson et al., Reference Patterson, Williams and Humphries1993; Moritz & Hillis, Reference Moritz, Hillis, Hillis, Moritz and Mable1996). The ITS-SSCP analysis, once set up, could be useful to cope with limitations of morphological classification and sequencing, being a simple and sensitive method for the detection of genetic variability. Our work demonstrated that morphological doubts about Aplysina can be bypassed and resolved by this technique, and that museum samples can be used as standards to produce species-specific patterns in ITS1-SSCP analysis.
ACKNOWLEDGEMENTS
We are indebted to T.S. de Paula for editing figures. D.M. Braga de Mello is thanked for technical assistance. A special thanks for Dr Ulisses Pinheiro (Universidade Federal de Pernambuco—UFPE) and Dr Eduardo Hajdu (Museu Nacional—UFRJ) for improving our knowledge and helping us access the material. G.L.H. and R.M.A. thank the Prociência fellowship from Sub-Reitoria de Pós-Graduação e Pesquisa, Universidade do Estado do Rio de Janeiro (SR2—UERJ). This work was carried out with financial assistance from Fundação de Amparo à Pesquisa do Estado do Rio de Janeiro (FAPERJ) and Conselho Nacional de Desenvolvimento Científico e Tecnológico (CNPq).