1. Introduction
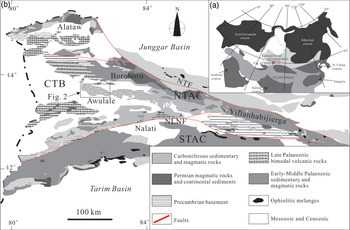
The Central Asian Orogenic Belt (CAOB) is a giant Palaeozoic orogenic belt located between the East European – Siberian Craton and the Tarim / North China cratons (Zhu et al., Reference Zhu, Zhang, Gu, Guo and Zhou2005; Wang et al., Reference Wang, Faure, Cluzel, Shu, Charvet, Meffre and Ma2006). The western Tianshan, located on the southwestern side of the CAOB (Fig. 1a), is an essential Late Palaeozoic orogenic belt (Windley et al., Reference Windley, Allen, Zhan, Zhao and Wang1990; Gao et al., Reference Gao, Li, Xiao, Tang and He1998) and a typical accretion-type orogenic belt (Xiao et al., Reference Xiao, Kröner and Windley2009). As an essential part of the western Tianshan, the Yili – Central Tianshan Block ‘recorded’ the evolution of the CAOB during subduction, ocean closure and extension of the post-orogenic phase during the late Palaeozoic. The granites of the Yili – Central Tianshan Block, as well as the basalts, andesites and dacites of the late Devonian – early Carboniferous Dahalajunshan Formation, were interpreted as formed there in an island arc setting associated with the southern subduction of the North Tianshan ocean in the late Palaeozoic (Zhu et al., Reference Zhu, Zhang, Gu, Guo and Zhou2005; Qian et al., Reference Qian, Gao, Xiong, Long and Huang2006; Wang et al., Reference Wang, Faure, Cluzel, Shu, Charvet, Meffre and Ma2006; Yang et al., Reference Yang, Wu, Chung, Wilde and Chu2006; Xia et al., Reference Xia, Chen, Liu and Luo2011; An et al., Reference An, Zhu, Wei and Lai2013). The late Carboniferous to Early Permian volcanic rocks in the Yili – Central Tianshan Block contain a suite of basalts – basaltic andesites and rhyolites, with only some intermediate rocks, formed in an extensional environment (GW Chen et al., Reference Chen, Deng, Liu, Xia and Liu2015; BX Chen et al., Reference Chen, Xu, Zhou, Bai, Huang and Zheng2019; Ning et al., Reference Ning, Li, Wang, Wang and Li2019).
(a) Location of the western Tianshan in the CAOB. (b) Map showing tectonics and volcanic rocks in the western Tianshan (adopted from Gao et al. Reference Gao, Long, Klemd, Qian, Liu, Xiong, Su, Liu, Wang and Yang2009). CTB: Yili – Central Tianshan Block; NTAC: North Tianshan accretionary complex; NTF: North Tianshan fault; STAC: South Tianshan accretionary complex; STF: South Tianshan fault.

Agreement on aspects of the dynamic background of these bimodal volcanic rocks is not yet achieved among scientists. Some scholars believe that the volcanics in the west of Awulale Mountain, which is located in the centre of the Yili – Central Tianshan Block (Fig. 1b), formed because of lithospheric delamination during the post-collision stage (Li et al., Reference Li, Xu, Sun, Li, Bai and Zhang2012; Zhao et al., Reference Zhao, Zhang, Zhang, Liu, Hong and Jiang2013; Chen et al., Reference Chen, Deng, Liu, Xia and Liu2015), while others suggest that these bimodal volcanic rocks may be related to the Permian Tarim mantle plume (Xia et al., Reference Xia, Xu, Xia, Li, Ma and Wang2004). One group of scholars believe that large-scale magmatic activity in the Awulale region was a result of the breakage of the subducted slab, triggered by the upwelling of the depleted asthenospheric mantle (Long et al., Reference Long, Gao, Klemd, Beier, Qian, Zhang, Wang and Jian2011; Ding et al., Reference Ding, Xue, Zhao, Yan, Yaxiaer, Feng, Luo, Zu, Zhang and Dai2014; Feng & Zhu, Reference Feng and Zhu2019) or an overlaying depleted mantle source, located over the possible mantle plume formed during the early Permian (Long et al., Reference Long, Wang, Tang, Wang, Wang and Liao2012).
Awulale Mountain has the most complete Carboniferous–Permian strata in the western Tianshan. The suite of late Carboniferous – early Permian bimodal volcanics located in the Awulale region contains extensive high-Ti, high-Nb basalts and rhyolite with A-type chemical characteristics. Together with the regional geological features, this paper re-evaluates the genesis and geological background of these bimodal volcanic rocks.
2. Geological background
The Western Tianshan area is a critical component of the CAOB (Fig. 1a). It is tectonically subdivided into the North Tianshan accretionary complex (NTAC), the Yili – Central Tianshan Block (CTB) and the South Tianshan accretionary complex (STAC), bounded by the North Tianshan fault (NTF) and the South Tianshan fault (STF), respectively (Fig. 1b) (Li et al., Reference Li, He, Xu, Li, Sun, Yang, Gao and Zhu2006; Gao et al., Reference Gao, Long, Klemd, Qian, Liu, Xiong, Su, Liu, Wang and Yang2009; Qian et al., Reference Qian, Gao, Klemd, He, Song, Liu and Xu2009; Xiao et al., Reference Xiao, Windley, Allen and Han2013; Jiang et al., Reference Jiang, Gao, Klemd, Qian, Zhang, Xiong, Wang, Tan and Chen2014; Yang et al., Reference Yang, Li, Kerr and Tong2018; Chen et al., Reference Chen, Yang, Liu, Wang, Wang and Wang2020).
The NTAC is composed of early Carboniferous ophiolitic complexes and the Carboniferous volcano-sedimentary rocks, which (e.g. Bayingou ophiolite) are the remains of the North Tianshan Ocean (Xu et al., Reference Xu, Ma, Xia, Wan, Li, Xia and Wang2005; Wang et al., Reference Wang, Faure, Cluzel, Shu, Charvet, Meffre and Ma2006; Yang et al., Reference Yang, Li, Kerr and Tong2018). The age of the plagio-granites from the Bayingou ophiolite was determined as 324.8 ± 7.1 Ma (Xu et al., Reference Xu, Xi, Ma, Wan, Li, Xia and Wang2006). The granodiorite age intruding the ophiolitic complexes was 316 ± 3 Ma (Han et al., Reference Han, Guo, Zhang, Zhang, Chen and Song2010), which indicates oceanic basin closure before 300 Ma.
The Yili – Central Tianshan Block, situated in the central part of the Western Tianshan orogenic belt, is a triangular area, bordered by the North Tianshan fault (NTF) and the Nalati Fault along with its NTAC and STAC parts, respectively. It contains Proterozoic amphibolite facies metamorphic rocks dated at 880–970 Ma using U–Pb zircon ages (Chen et al., Reference Chen, Lu, Jia, Cai and Wu1999; Hu et al., Reference Hu, Jahn, Zhang and Zhang2000; Wang et al., Reference Wang, Liu, Shu, Jahn, Chung, Zhai and Liu2014) with Palaeozoic intrusive igneous and thick late Palaeozoic volcano-sedimentary rocks. The volcanic rocks are present in the northern Nalati Mountain, Yishijilike Mountain, Awulale Mountain and Dahalajunshan Mountain. Voluminous Carboniferous–Permian plutonic rocks are also well-developed in the Yili – Central Tianshan Block (Wang et al., Reference Wang, Shu, Cluzel, Faure and Charvet2007; Li et al., Reference Li, Hu, Zhou, Tong and Tong2010; Zhu et al., Reference Zhu, Li, Dong, Wang, Zhang and Xu2011). The intrusive rocks in the Yili – Central Tianshan Block mainly include three periods: early Palaeozoic, late Devonian – early Carboniferous and late Carboniferous – early Permian. The early Palaeozoic intrusive rocks contain mostly calc-alkaline granite resulted from northward subduction of the Southern Tianshan Ocean in the early Palaeozoic and the metaluminous and peraluminous granite, associated with the Yili – Central Tianshan Block and the Tarim plate collision, which are present in the southern margin of the Nalati Mountains 400–490 Ma in age (Yang et al., Reference Yang, Wu, Chung, Wilde and Chu2006; Zhang et al., Reference Zhang, Zhang, Tang, Wilde and Hu2008; Zhu et al., Reference Zhu, Li, Dong, Wang, Zhang and Xu2011; Liu et al., Reference Liu, Wang and Chen2016, Reference Liu, Chen and Yang2020; Liu & Chen, Reference Liu and Chen2018, Reference Liu and Chen2020). Devonian – early Carboniferous granites are calc-alkaline granites mainly found in the southern margin of the North Tianshan and Nalati Mountains. They formed by the southern subduction of the North Tianshan Ocean and the northern subduction of the southern Tianshan Ocean (Chen et al., Reference Chen, Yang, Liu, Wang, Wang and Wang2020). The late Palaeozoic intrusive rocks (formed 310–390 Ma), distributed in the northern Yili – Central Tianshan Block, are mostly granodiorites (Tang et al., Reference Tang, Chen, Wang, Zhao, Wyman, Jiang and Jia2008; XH Zhang et al., Reference Zhang, Zhang, Tang, Wilde and Hu2008; ZH Zhang et al., Reference Zhang, Wang, Wang and Zuo2010). During the Late Carboniferous – early Permian, a suite of quartz albite porphyry, monzogranite, potassium feldspar granite and diabase intruded in the Yili – Central Tianshan Block. These granitoids are characterized by adakites (Li et al., Reference Li, Niu, Yang, Lai and Zhao2019) and A-type granite (Tang et al., Reference Tang, Chen, Wang, Zhao, Wyman, Jiang and Jia2008; Liu & Chen, Reference Liu and Chen2018, Reference Liu and Chen2020). Similar to the late Carboniferous – early Permian bimodal volcanic rocks, these rocks limit the time of the post-orogenic phase of the western Tianshan.
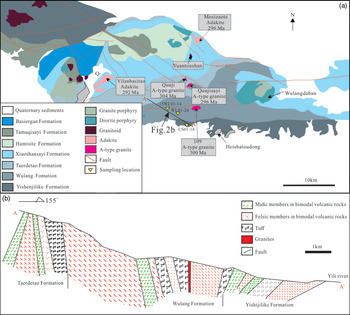
The area of interest is located west of Awulale Mountain (Fig. 1b). Awulale Mountain contains mainly late Palaeozoic volcanic and intrusive rocks (Fig. 1b). Its stratigraphy is composed of Carboniferous to Permian sequences (250–330 Ma in age) (Zhu et al., Reference Zhu, Zhang, Gu, Guo and Zhou2005; Zhao et al., Reference Zhao, Xiong, Wang, Bai and Qiao2009; Li et al., Reference Li, Niu, Qiang, Jiang, Zeng, Yang and Pei2013; Liu et al., Reference Liu, Wang and Chen2016; Liu & Chen, Reference Liu and Chen2018). According to the regional lithology, Awulale Mountain can be divided into (1) the western section, which mostly consists of Permian volcanics 251–298 Ma in age with minor Carboniferous volcanic rocks and some Late Palaeozoic intrusions as shown in Figure 2a (Zhao et al., Reference Zhao, Wang, Xiong, Zhang, Niu, Xu, Bai and Qiao2006; Li et al., Reference Li, Niu, Qiang, Jiang, Zeng, Yang and Pei2013; Liu et al., Reference Liu, Wang and Chen2016; Liu & Chen, Reference Liu and Chen2020), and (2) the eastern section, which contains Carboniferous volcanic rocks 312–327 Ma in age, some late Palaeozoic intrusions (284–312 Ma in age) and some Permian volcanic rocks (261–271 Ma in age) (Zhu et al., Reference Zhu, Zhang, Gu, Guo and Zhou2005; Feng & Zhu, Reference Feng and Zhu2019). The Carboniferous rocks in the Awulale region include the Yishijilike Formation, and the Permian rocks in this region include Wulang, Taerdetao, Xiaoshansayi and Tamuqisayi Formations. Plutons (290–330 Ma) are widely distributed in Awulale Mountain (Zhu et al., Reference Zhu, Zhang, Gu, Guo and Zhou2005). They include some adakitic plutons with zircon U–Pb 291–296 Ma in age (Li et al., Reference Li, Niu, Yang, Lai and Zhao2019; our unpublished data), A-type granites with zircon U–Pb 296–303 Ma in age (Liu et al., Reference Liu, Wang and Chen2016; Liu & Chen, Reference Liu and Chen2020) and diabase dikes with K–Ar 310 Ma in age (Yao, Reference Yao1993) (Fig. 2a).
(a) Geological map of western Awulale Mountain (adopted from Li et al. Reference Li, Niu, Qiang, Jiang, Zeng, Yang and Pei2013). Data on ages are from Li et al. (Reference Li, Niu, Qiang, Jiang, Zeng, Yang and Pei2013, Reference Li, Niu, Shan and Yang2015) and Liu & Chen (Reference Liu and Chen2020) as well as from our unpublished data. (b) Cross-section of the Yishijilike, Wulang and Taerdetao Formations located in the western Awulale Mountain region.

Distinct deformation structures, developed in Awulale Mountain, include folds, faults and dome structures. During the Early Carboniferous, E–W-trending structure patterns formed. There are incongruous and angular folds in the Akeshake Formation below the Yishijilike Formation (Li et al., Reference Li, Hu, Zhou, Tong and Tong2010). Many NW- and NE-trending tensional faults formed in the study area during the late Carboniferous period. E–W-trending tectonics during the Permian was transformed by NW- and NE-trending tectonic belts. Thus, these tectonic movements formed many faults, domes and folds, which controlled the distribution of the intrusions.
3. Field relationships and petrography
Stratigraphy in the study area mainly includes the Yishijilike, Wulang, Taerdetao, Xiaoshansayi, Hamisite, Tamuqisayi and Basiergan Formations (Fig. 2a), corresponding to decreasing deposition/eruption ages. The Yishijilike Formation consists of rhyolite and small amounts of basalt, intruded by porphyritic granites. The age of rhyolites in the Yishijilike obtained using the laser ablation – inductively coupled plasma – mass spectrometry (LA-ICP-MS) zircon U–Pb dating technique is c. 303 Ma (Ning et al., Reference Ning, Li, Wang, Wang and Li2019). The Wulang Formation mainly contains volcanic rocks, including dacite, rhyolite, basalt and felsic tuff. It covers the Yishijilike Formation conformably (Fig. 2b). The eruption age of the Wulang Formation volcanic rocks was closer to 291 Ma, dated by the LA-ICP-MS zircon U–Pb ageing technique (Ding et al., Reference Ding, Xue, Zhao, Yan, Yaxiaer, Feng, Luo, Zu, Zhang and Dai2014). The Taerdetao Formation consists of bimodal volcanic rocks and covers the Wulang Formation conformably (Fig. 2b). The Xiaoshansayi, Hamisite and Tamuqisayi Formations are composed of sedimentary rocks. The Xiaoshansayi Formation mainly consists of sandstone, siltstone, and mudstone, and covers the Taerdetao Formation conformably. The Hamisite Formation, composed of conglomerate, sandstone and silty marl, is located in parallel to and conformably overlies the Xiaoshansayi Formation. The Tamuqisayi Formation mainly consists of conglomerate, sandstone and mudstone and covers the Hamisite Formation conformably. The Basiergan Formation, composed of boulder conglomerate, charcoal mudstone and silty mudstone, covers the Tamuqisayi Formation conformably. Tectonics in this area is mainly characterized by folds and faults. Due to the structural compression, stratigraphy in this area can be described as having steep dips.
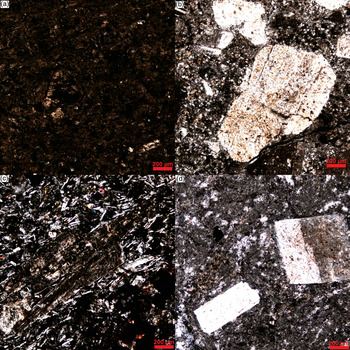
Fresh volcanic rock samples for petrological and geochemical analyses were collected from the geological sections of the Yishijilike and Wulang Formations and from several scattered outcrops along the ridge (Fig. 2a). Volcanic rocks collected in two successive formations can reveal the continual evolution of the regional geology. Twenty-one samples (5 mafic rocks and 16 felsic rocks) and 30 samples (17 mafic rocks and 13 felsic rocks) were collected from the Yishijilike Formation and Wulang Formation, respectively. These samples were collected every 10–20 m to confirm that they represent the formation’s full volcanic stratigraphy. As dacite and felsic tuff represent only a small part of the stratigraphy, the felsic rocks of these formations are mainly composed of rhyolites. The basalts in the Yishijilike Formation are dark grey and possess a porphyritic texture with phenocrysts of plagioclase. The groundmasses include fine-grained plagioclase, pyroxene, amphibole and Fe–Ti oxides (Fig. 3a). The felsic volcanic rocks in the Yishijilike Formation include dacites and rhyolites, which are either aphyric or porphyritic with 5–10 % phenocrysts. As the difference between dacites and rhyolites is not obvious in outcrops and under a microscope, we classify them as felsic rocks. The main phenocryst phase of the felsic rocks is plagioclase (Fig. 3b). Mafic mineral phenocrysts, which are observed rarely, include clinopyroxene, hornblende and biotite (Fig. 3b). The basalts from the Wulang Formation are also dark grey and contain clinopyroxene, plagioclase and Fe–Ti oxides (Fig. 3c). Shapes of the plagioclase grains are subhedral and lath-like (Fig. 3c). Rhyolitic rocks from the Wulang Formation are purple and possess porphyritic texture with phenocrysts of K-feldspar (Fig. 3d). Major phases of the groundmasses are K-feldspar, quartz and plagioclase, while minor ones are titanite, zircon and apatite. These rocks were affected by the hydrothermal weathering, demonstrated by the replacement of clinopyroxene by other minerals and sericitization of feldspar (Fig. 3).
Micrographs showing mineralogical characteristics of the bimodal volcanic rocks from the Yishijilike and Wulang Formations: (a, c) basaltic rocks, (b, d) rhyolitic rocks.

4. Analytical techniques
After the petrographic examination, some freshly collected rock pieces were crashed ultrasonically first in 5 wt % HNO3 solution and then in distilled water, after which the samples were dried and examined. Any visually detected contamination was removed by hand. Another batch of freshly collected rocks was prepared for elemental and isotopic analyses. Rocks were split into small chips, ultrasonicated in distilled water, dried and then ground to powder. Sample pieces with pores or slight alterations (especially basalt and basaltic andesite samples) were soaked in 4N HCl for 1 h to remove carbonates, rinsed with distilled water, dried and then ground to powder.
4.a. Whole-rock major and trace elements measurements
Whole-rock major element compositions were analysed using X-ray fluorescence (XRF) at the Guangzhou Institute of Geochemistry, Chinese Academy of Sciences (GIG CAS), China. The analytical accuracy of the major element determination was ±1–2 %. We used the gravimetric method to analyse the losses on ignition (LOI). Whole-rock trace element contents were obtained by ICP-MS at the GIG CAS. Fifty milligrams of the powdered samples was dissolved in HF/HNO3 mixture for 7 days at 100 °C in a screw-top Teflon beaker. An internal Rh standard was used to monitor drift in mass response during counting. USGS BCR-1 standard was used for elemental concentration calibration. The accuracy of the analysis was ±5 %.
4.b. Whole-rock Sr–Nd isotope
Sr and Nd isotopes were determined by ISOPROBE-T thermal ionization mass spectrometer at the Beijing Research Institute of Uranium Geology. For this purpose, powders were completely dissolved in Savilex bombs using standard procedures. Sr and Nd were isolated using a two-column method. Some Sr fractions were additionally purified by a third column. 143Nd/144Nd ratios were normalized against 146Nd/144Nd standard value equal to 0.7219. 87Sr/86Sr ratios were normalized to the 86Sr/88Sr standard value equal to 0.1194, and checked against the NBS-987 standard (equal to 0.710250 ± 0.000007). Our measurements on the SHINESTU Nd standard yielded a value equal to 0.512118 ± 0.000003.
5. Results
5.a. Whole-rock chemical compositions
The whole-rock chemical compositions are listed in Supplementary Table S1 (in the supplementary material available online at https://doi.org/10.1017/S0016756820001090). Some samples showed relatively high LOI (>3 wt %), indicating that these volcanic rocks underwent weathering and alteration after the eruption.
After accounting to LOI and recalculating, the results to 100 % of SiO2 content were plotted as a function of total K2O and Na2O contents. The resulting diagram demonstrates good bimodal geochemical distribution (Fig. 4). Five mafic rocks from the Yishijilike Formation are classified as basaltic trachyandesite (three samples) and trachybasalt (two samples) types. Sixteen samples of the Yishijilike Formation felsic rocks fell into a dacite–rhyolite field, fourteen of which were classified as rhyolites, and two as dacites. Seventeen samples in the Wulang Formation show a compositionally expanded basalt – trachybasalt – basaltic trachyandesite – basaltic andesite – trachyandesite suite. Felsic samples in the Wulang Formation are potassic trachytes (two samples with 11 wt % K2O) and rhyolites (13 samples).
The total content of alkali metal oxides plotted as a function of the SiO2 content. Magma series classification is taken from Irvine and Baragar (Reference Irvine and Baragar1971). Green circles: mafic rocks from the Yishijilike Formation; pink circles: felsic rocks from the Yishijilike Formation; green triangles: low-Ti mafic rocks from the Wulang Formation; green rhombus: high-Ti mafic rocks from the Wulang Formation; pink triangle: felsic rocks from the Wulang Formation. Data for the felsic rocks from the Wulang Formation are taken from Ding et al. (Reference Ding, Xue, Zhao, Yan, Yaxiaer, Feng, Luo, Zu, Zhang and Dai2014).

Mafic rocks in the Yishijilike Formation are characterized by low silica contents (46.2–51.4 wt %), moderate MgO (4.48–5.66 wt %), CaO (3.99–7.11 wt %) and TiO2 (1.04–1.16 wt %) levels and relatively high Al2O3 (16.1–17.9 wt %), K2O + Na2O (4.71–6.39 wt %) and P2O5 (0.27–0.29 wt %) levels. The mafic rocks in the Yishijilike Formation are slightly enriched in light rare earth elements (LREE) judging by the (La/Yb)N value in the 4.2–5.0 range. These rocks also demonstrate small Eu negative anomalies because the Eu/Eu* ratios are in the 0.85–1.00 range (Fig. 5a). Samples show pronounced Pb positive anomalies (Fig. 5a). REE patterns for these mafic rocks are flat. The primitive mantle-normalized diagram shows that these mafic rocks are enriched with large-ion lithophile elements (LILE) (such as Th and U) and depleted in Nb, Hf, Zr and Ta (Fig. 5b).
Chondrite-normalized REE and primitive mantle-normalized trace element patterns of bimodal volcanic rocks from the Yishijilike Formation. Green circles: mafic rocks; pink circles: felsic rocks. Average chondrite and primitive mantle-normalizing values were taken from Sun and McDonough (Reference Sun, McDonough, Saunders and Norry1989).

The chondrite-normalized diagram of the felsic rocks in the Yishijilike Formation demonstrates enrichment of these rocks in LREE (judging by the LaN/YbN ratio equal to 1.1–7.6) and severe depletion by Eu (based on the corresponding Eu/Eu* ratio equal to 0.22–0.52; Fig. 5c). Samples showed pronounced Pb positive anomalies (Fig. 5c). At the same time, the primitive mantle-normalized diagram shows that these samples were enriched with LILEs (such as Rb, U and Th) and depleted in Ba, Sr, Nb and Ta (Fig. 5d).
There are two basalt groups present in the Wulang Formation: high-Ti basalt (TiO2 = 2.26–2.34 wt %) and low-Ti basalt (0.62–1.21 wt %). The high-Ti basalts have total Fe2O3 content (12.80–13.34 wt %) higher than in the low-Ti basalts (5.65–11.1 wt %). All mafic rocks possess higher Na (than K) contents and are also slightly enriched with LREEs ((La/Yb)N = 3.22–5.26) with almost no negative Eu anomalies (Eu/Eu* = 0.83–1.07) and with relatively flat REE patterns (Fig. 6a). Some basalts have relatively high Nb (>7 × 10⁻⁶), as well as P and high field strength elements (HFSE) contents, which is typical for the Nb-enriched basalts (Sajona et al., Reference Sajona, Maury, Bellon, Cotten, Defant and Pubellier1993). Samples show distinct positive Pb anomalies (Fig. 6a). The primitive mantle-normalized diagram demonstrates that mafic rocks are enriched with Rb, Th and U and depleted in Nb, Ta, Zr and Hf (Fig. 6b).
Chondrite-normalized REE and primitive mantle-normalized trace element patterns of bimodal volcanic rocks from the Wulang Formation. Green triangles: low-Ti mafic rocks; green rhombus: high-Ti mafic rocks; pink triangles: felsic rocks. Average chondrite and primitive mantle-normalizing values are taken from Sun and McDonough (Reference Sun, McDonough, Saunders and Norry1989).

Felsic rocks in the Wulang Formation are also enriched with LREE associations (with LaN/YbN = 3.04–6.87). A chondrite-normalized diagram of the felsic rocks from the Wulang Formation shows negative Eu values (with Eu/Eu* = 0.46–0.50; Fig. 6c). Samples show pronounced positive Pb anomalies (Fig. 6c). The primitive mantle-normalized diagram (Fig. 6d) demonstrates LILE-enriched and Ba-, Sr-, Nb- and Ta-depleted felsic rocks, which is similar to the results observed for the Yishijilike Formation.
5.b. Nd isotopic compositions
The distribution of Nd isotope is given in Table 1. Previous studies showed that when the initial (87Sr/86Sr)i ratio was affected by the hydrothermal alteration (Menzies et al., Reference Menzies, Fan, Zhang and Prichard1993) or the 87Rb/86Sr ratio was high, it became not credible (Jahn et al., Reference Jahn, Wu and Chen2000, Reference Jahn, Litvinovsky, Zanvilevich and Reichow2009). However, Nd isotopes are relatively stable and unaffected by these processes; therefore, the ϵ Nd(t) values are still credible (Menzies et al., Reference Menzies, Fan, Zhang and Prichard1993; Mahoney et al., Reference Mahoney, Frei, Tejada, Mo, Leat and Nägler1998). Thus, in this work, we focus on the Nd isotopic composition in the bimodal volcanics.
Nd isotope data for the bimodal volcanic rocks from the Yishijilike and Wulang Formations

Note: ε Nd(t) = [(143Nd/144Nd)i/(143Nd/144Nd)CHUR − 1] × 104, (143Nd/144Nd)CHUR = 0.512638, (147Sm/144Sm) CHUR = 0.1967.
TDM = 1/σ × ln(1 + [(143Nd/144Nd)i − 0.51315]/[(147Sm/144Nd)i − 0.2137], t = 310 Ma, λSm = 6.54 × 10⁻¹².
* Data from Ding (Reference Ding, Xue, Zhao, Yan, Yaxiaer, Feng, Luo, Zu, Zhang and Dai2014).
Initial 143Nd/144Nd ratios in the mafic samples from the Yishijilike Formation are in the 0.512646–0.512685 range. Initial ratios are calculated using the age equal to 303 Ma (Ning et al., Reference Ning, Li, Wang, Wang and Li2019). Corresponding ϵ Nd(t) values are in the 1.54–2.42 range (Fig. 7). 143Nd/144Nd ratio and ϵ Nd(t) values for the felsic rocks from the Yishijilike Formation are in the 0.512594–0.512709 and 1.62–2.70 ranges, respectively (Fig. 7).
Sm/Nd vs ϵ Nd(t) diagrams. Green circles and pink circles represent mafic rocks and felsic rocks from the Yishijilike Formation, respectively; green triangles, green rhombus and pink triangles represent low-Ti mafic rocks, high-Ti mafic rocks and felsic rocks of the Wulang Formation, respectively. Data sources: Bayingou ophiolites (Xu et al. Reference Xu, Xi, Ma, Wan, Li, Xia and Wang2006; Chen et al. Reference Chen, Yang, Liu, Wang, Wang and Wang2020); Dahalajunshan Formation basalt (Qian et al. Reference Qian, Gao, Xiong, Long and Huang2006).

143Nd/144Nd ratios in the mafic samples from the Wulang Formation are in the 0.512744–0.512985 range. Initial ratios were calculated using 291 Ma age (Ding et al., Reference Ding, Xue, Zhao, Yan, Yaxiaer, Feng, Luo, Zu, Zhang and Dai2014). Corresponding ϵ Nd(t) values are in the 4.35–7.41 range (Fig. 7). 143Nd/144Nd ratio and ϵ Nd(t) values for the felsic rocks from the Wulang Formation are in the 0.512652–0.512765 and 4.66–5.33 ranges, respectively (Fig. 7).
6. Discussion
6.a. Hydrothermal alteration effects
Hydrothermal alteration effects of the volcanic rocks with LOI > 3 wt % should be taken into account. Because of higher enhanced mobility during surface modification, incompatible element contents might change during post-eruption processes. Zr and Hf are typically immobile during the low-grade alteration and metamorphism (Gibson et al., Reference Gibson, Kirkpatrick, Emmerman, Schmincke, Pritchard, Oakley, Thorpe and Marriner1982; Pearce et al., Reference Pearce, Thirlwall, Ingram, Murton, Arculus and Van der Laan1992). Therefore, they were used to reveal the movements of other elements during post-eruption processes. Zr and Th correlated very well with La, Nb, Nd and U contents (Supplementary Figs S1 and S2a (in the supplementary material available online at https://doi.org/10.1017/S0016756820001090)). Thus, La, Nb, Nd and U were also relatively immobile during post-magmatic processes. In addition, considerable scatter was observed when Rb content was plotted as a function of the Th content (Fig. S2b). Additionally, no correlation between Sr and Th was observed for the mafic samples (Fig. S2c), which indicates the mobility of Rb and Sr during post-stage alternation. A considerable scatter was also observed when Ba content was plotted as a function of the Th content (Fig. S2d), which suggests Ba mobility during alternation.
Overall variations of HFSEs, such as Th, Zr, Nb, Hf and Y, and REE, could be attributed to the magmatism, which can be used to reveal the rock geochemical characteristics. However, Rb, Sr and Ba contents were very likely affected by the alteration processes. Thus, they cannot be used to study the petrogenesis of the rocks evaluated in this work.
6.b. Petrogenesis
6.b.1. Mafic rocks
The mafic volcanic rocks from the Yishijilike and Wulang Formations possess relatively low concentrations of MgO, Ni, Cr and Co. Thus, these rocks are characterized by low Mg# values, which are significantly lower than the values for the primary basaltic melts, indicating that they probably experienced some crystal fractionation (e.g. Wilson, Reference Wilson1989b; Green, Reference Green2015; Green & Falloon, Reference Green and Falloon2015; Mitchell & Grove, Reference Mitchell and Grove2015). In addition, as illustrated in Supplementary Figure S3 (in the supplementary material available online at https://doi.org/10.1017/S0016756820001090), SiO2 content positively correlates with Na2O, Th, Nb and Zr contents (Supplementary Fig. S3a–d), but negatively with MgO, Cr and Ni contents (Supplementary Fig. S3e, f), which is consistent with fractional crystallization effect.
The positive ϵ Nd(t) values of the mafic end member in the Yishijilike Formation and Wulang Formation bimodal volcanics are in the +1.54 to +2.42 and +4.35 to +7.41 ranges, respectively (Fig. 7), indicating a depleted mantle source. The mafic volcanic rocks from the Yishijilike Formation and the low-Ti basalts in the Wulang Formation are LILE-enriched and HFSE-depleted (e.g. Nb and Ta), indicating a possibility for some subduction-related mantle metasomatism (Kuyumjian & Danni, Reference Kuyumjian and Danni1991). Most rocks have Nb/La (0.4–0.5) and Nb/Th (1.5–5.3) ratios below values of the typical normal mid-ocean ridge basalts (N-MORB) (with Nb/La and Nb/Th ratios equal to 1.0 and 19.5, respectively; Sun & McDonough, Reference Sun, McDonough, Saunders and Norry1989) but similar to the values in the subduction-related magma (Nb/La = 0.53, Nb/Th = 3.10; Kelemen et al., Reference Kelemen, Hanghj and Greene2014). Furthermore, most mafic rocks possess high Th/Yb (1.29–3.22) but low Nb/Yb ratios (3.50–7.03) and deviate from the MORB – ocean island basalt (OIB) arrays (Fig. 8) of the subduction-modified lithospheric mantle plot (Pearce, Reference Pearce2008). In addition, the Nb/Ta and Zr/Hf values for these mafic rocks were in the 15.0–18.8 and 30.9–43.9 ranges, respectively, which are similar to the analogous values for the primitive mantle equal to 17 ± 2 and 36.2 (Sun & McDonough, Reference Sun, McDonough, Saunders and Norry1989). However, the mafic rocks possess variable ϵ Nd(t) values (in the 1.54–7.41 range), suggesting that the source of mafic rocks is a heterogeneous mantle. Figure 7 shows ϵ Nd(t) of basalts in the Wulang Formation plotted for the area between the Bayingou ophiolite, the Dahalajunshan Formation and the Yishijilike Formation. It demonstrates the tendency of crustal mixing, which may indicate that the depleted mantle source of basalts in the Early Permian Wulang Formation was mixed with the early underplated basalts. Four high-Ti basalts with high TiO2 and Fe2O3 but low Al2O3 contents possessed chemical composition similar to the experimental fertile peridotite melt. Thus, the source of these rocks might be similar to the fertile mantle (Falloon et al., Reference Falloon, Green, Hatton and Harris1988). Basalts with high TiO2 contents are enriched with P, Zr, Nb, Ta and REE, with positive whole-rock ϵ Nd(t) values (equal to +3.1 to +4.3), which is similar to continental flood basalts (Hornig, Reference Hornig1993; Farmer, 2013). Thus, they originated from an asthenospheric mantle source. Compared to other basaltic rocks, the high-Ti basalts show that they were not affected by the subduction-related fluids and/or melts (Fig. 8). The influence of the evolution of the mantle on Th and Ta is similar. In contrast, Th and Ta will be differentiated in the mantle wedge under the influence of the subduction zone fluid. As a result, Th will be strongly enriched in the magma (Wilson, Reference Wilson1989a). The Th/Ta ratio of high-Ti basalt samples in this area is equal to 0.50–1.73, similar to the Th/Ta ratio of MORB (0.75–2; Pearce, Reference Pearce1991). It is significantly lower than the values observed for the island arc basalt (which are in the 35 range) and in the upper crust (with the value equal to 10). Thus, the source area of high-Ti basalt cannot be described as ‘metasomatism by subduction fluid’. Therefore, the source of high-Ti basalt is different from other basalts. Compared with the typical asthenospheric mantle, Nb and Ta content in high-Ti basalt are slightly lower, which is typical for mantle depleted in trace elements. This may be related to the magma mixing with the lithospheric mantle. The Ti, Nb and Zr contents in basalts are generally high, indicating that the source is mixed with high-Ti, -Nb and -Zr material. SiO2–TiO2, SiO2–Nb, TiO2–Nb and TiO2–Zr diagrams show that low-Ti end member is mixed with high-Ti end member (Fig. 9), indicating that the high-Ti basalt was indeed mixed with the lithospheric mantle. Therefore, the asthenosphere material was involved in the late Palaeozoic magmatism in this area.
Nb/Yb plotted on the Th/Yb diagram, adopted from Leat et al. (Reference Leat, Riley, Wareham, Millar, Kelley and Storey2002) and Pearce (Reference Pearce2008). Data are for the mafic volcanics from the Yishijilike Formation (green circles) and the Wulang Formation (green triangles for low-Ti mafic rocks and green rhombus for high-Ti mafic rocks).

SiO2 contents plotted as a function of TiO2 (a) and Nb (b) for mafic volcanic rocks from the Wulang Formation. TiO2 contents plotted as a function of Nb (c) and Zr (d).

The mafic rocks of the Yishijilike Formation and Wulang Formation possess flat HREE patterns (Figs 5a and 6a), which indicate no residual garnet presence during the partial melting of the mantle source. La/Yb ratios often reflect partial melting as well as the presence of spinels or garnets as predominant residual phases (Yang et al., Reference Yang, Sun, Chen, Wilde and Wu2007). The basalt source is relatively shallow at low La/Yb ratios, especially when spinel is a dominant residual phase. Basalt may form because of the relatively large partial melting. In contrast, the high La/Yb ratios may reflect that the basalt source is relatively deep and that the garnet is the dominant residual phase in the source. Meantime, basalt may be formed by smaller melt fractions. In this study, the mafic rocks have low La/Yb (<7.49), (La/Sm)N (<2.23) and (Tb/Yb)N (<1.78) ratios while demonstrating relatively flat middle rare earth elements (MREE) and HREE patterns (Figs 5a and 6a). Thus, the source of basalt is relatively shallow: <60–70 km (Zhang et al., Reference Zhang, Zhang, Tang, Wilde and Hu2008). Therefore, basalt very likely formed by partial melting of a mantle in the spinel field, which agrees with the moderate TiO2 and total Fe2O3 T concentrations in basalts. The composition of these mafic rocks is also consistent with the composition of the glasses obtained by partial melting of the natural anhydrous fertile spinel peridotite (e.g. Hirose & Kushiro, Reference Hirose and Kushiro1993).
6.b.2. Felsic rocks
SiO2 in felsic volcanic rocks negatively correlated with TiO2, MgO, Fe2O3 T, Al2O3 and CaO (Supplementary Fig. S4a–e (in the supplementary material available online at https://doi.org/10.1017/S0016756820001090)) contents, indicating that they experienced fractional crystallization (e.g. amphibole ± plagioclase ± Fe–Ti oxides). In addition, the P2O5 negatively correlated with SiO2, suggesting apatite crystallization (Supplementary Fig. S4f (in the supplementary material available online at https://doi.org/10.1017/S0016756820001090)). The negative Eu anomalies in felsic rocks (Figs 5c and 6c) may be caused by (1) intensive fractional crystallization of feldspar during post-eruption processes, (2) strong negative Eu anomalies of magma sources or (3) large amounts of feldspar left in the melting residue (Zhang et al., Reference Zhang, Zhang, Tang, Wilde and Hu2008). However, many geochemical variables (such as major and trace elements) show no linear correlation with SiO2 in the felsic rocks, indicating no strong role of magma mixing or fractional assimilation crystallization in the felsic rock petrogenesis, which is consistent with the vague crystal differentiation of felsic rocks shown in Figure 10.
Ce contents plotted as a function of Ce/Yb for volcanic rocks from the Yishijilike Formation (a) and from the Wulang Formation (b), adopted from Allegre and Minster (Reference Allegre and Minster1978).

In general, the felsic suite rocks in bimodal volcanic rocks may be produced by fractional crystallization of associated basaltic magma (Sheth & Melluso, Reference Sheth and Melluso2008) or by partial melting of crustal materials (Mahoney et al., Reference Mahoney, Saunders, Storey and Randriamanantenasoa2008). The mafic and felsic volcanics in the study area are temporally and spatially associated with each other. Geochemically, the trace element features of the felsic group and of the mafic rocks are similar. In addition, the felsic rocks from the Yishijilike Formation and Wulang Formation demonstrate moderate whole-rock Nd isotopic contents (ε Nd(t) = +1.62 to +2.09 and +2.61 to +5.33, respectively), which correspond to their basalts (with ε Nd(t) equal to +1.54 to +2.42 and +4.35 to +7.41, respectively), suggesting that they could be genetically related by the fractional crystallization process, or indicating that the felsic rocks were produced by partial melting of juvenile basaltic crust (i.e. underplated basaltic crust), derived from the same mantle source. The fractionation of the basaltic melt should result in continuous compositions ranging from the unfractionated basalt to intermediate compositions to the rhyolite (Best & Christiansen, Reference Best and Christiansen2001). Field observations and sampling of the western Tianshan showed a large compositional gap between the basalt and the rhyolite. Many geochemical variables of the major and trace elements variations figures (shown in Supplementary Figs S1–4 (in the supplementary material available online at https://doi.org/10.1017/S0016756820001090)) show no linear correlation with SiO2 in the felsic rocks, indicating no significant role of magma mixing or fractional assimilation crystallization in the felsic rock petrogenesis. This was corroborated by the Ce/Yb ratio plotted as a function of the Ce diagram (Fig. 10), in which the felsic rocks of the Yishijilike Formation and Wulang Formation follow the partial melting trend (and not the fractional crystallization trend) (Allegre & Minster, Reference Allegre and Minster1978). In addition, a diagram showing Nb distribution as a function of Ta and as a function of U demonstrates that basaltic rocks and felsic rocks are distributed along different evolutionary lines (Fig. 11), indicating that felsic volcanic rocks cannot be produced by fractional crystallization of basaltic magma, which implies that they formed by partial melting of the newly underplated basaltic crust.
Nb contents plotted as a function of Th and U for volcanic rocks from the Yishijilike Formation (a, b) and from the Wulang Formation (c, d).

The felsic rocks of the Wulang Formation possess extremely high FeO*/(FeO* + MgO), SiO2, K2O + Na2O, Zr, Ga, REE and HFSE contents, which is indicative of their similarity to A-type felsic rocks (Collins et al., Reference Collins, Beams, White and Chappell1982; Whalen et al. Reference Whalen, Currie and Chappell1987). Whalen et al., (Reference Whalen, Currie and Chappell1987) and Frost et al., (Reference Frost, Barnes, Collins, Arculus, Ellis and Frost2001) demonstrated that A-type granite could be distinguished from the I- and S-types by discrimination diagrams (shown in Fig. 12). In addition, using the Watson & Harrison (Reference Watson and Harrison1983) formula, we calculated the Zr saturation temperature (T Zr) in the felsic rocks of the Wulang Formation. The values of T Zr (899–1009 °C) agree with experimental constraints (>830 °C) of the corresponding A-type granites temperature (Clemens et al., Reference Clemens, Holloway and White1986). Thus, these felsic rocks have A-type granite affinities.
10 000*Ga/Al plotted as a function of Zr (a), and Zr + Nb + Ce + Y plotted as a function of FeOT/MgO (b), adopted from Whalen et al. (Reference Whalen, Currie and Chappell1987). SiO2 plotted as a function of K2O + Na2O – CaO (c) and FeOT/(FeOT + MgO) (d), adopted from Frost et al. (Reference Frost, Barnes, Collins, Arculus, Ellis and Frost2001).

A-type granites and their volcanic counterparts can be created as a result of (1) fractionation of mantle-derived alkaline mafic magmas (Eby, Reference Eby1990; Litvinovsky et al., Reference Litvinovsky, Jahn, Zanvilevich, Saunders and Poulain2002; Bonin, Reference Bonin2007), (2) melting of a quartz–feldspathic crustal source and/or mixing of the mafic and felsic crustal sources (Kerr & Fryer, Reference Kerr and Fryer1993), (3) partial melting of dry low crustal residual granulates, which triggered the formation of I-type magmas (Collins et al., Reference Collins, Beams, White and Chappell1982; Whalen et al., Reference Whalen, Currie and Chappell1987; King et al., Reference King, White, Chappell and Allen1997) or (4) partial melting of a mantle-based newly formed parental basaltic magma (e.g. Frost & Frost, Reference Frost and Frost1997).
As mentioned above, the felsic rocks of the Wulang Formation did not undergo significant fractional crystallization. In addition, A-type granites in the study area have low compatible elements, such as MgO (0.09–0.72 wt %), Cr (1.36–17.6 ppm), Co (0.52–6.85 ppm) and Ni (0.96–7.31 ppm), indicating that these magmas did not originate from the mantle. Low Al content and A/CNK value suggest that these granites are unlikely to be formed by the partial melting of the metamorphic sedimentary rocks. Meanwhile, these felsic rocks with characteristics of A-type granite have higher K2O contents. Additionally, almost all samples have higher K2O contents than Na2O contents, which is similar to the magma formed by the crustal matter (Martin et al., Reference Martin, Smithies, Rapp, Moyen and Champion2005). By taking into account the characteristics of Nd isotopic composition, it is evident that the felsic volcanics in the studied formations most likely formed by the partial melting of the juvenile basic lower crust. In addition, Liu et al., (Reference Liu, Wang and Chen2016) proposed that the fSm/Nd and tDM (~0.69 Ga) of A-type granites in the Qunji are similar to those in granites distributed in the north of the CAOB. Thus, A-type granites in Qunji also originated from the juvenile basaltic lower crust.
6.c. Tectonic implications
Late Carboniferous – early Permian bimodal volcanic rocks, A-type granites and their volcanic counterparts are common in the western Tianshan. Previous studies suggested that these bimodal volcanic rocks might be: (1) related to the Permian Tarim mantle plume (Xia et al., Reference Xia, Xu, Xia, Li, Ma and Wang2004) or (2) resulted from the breakage of the subducted slab triggered by the upwelling of the depleted asthenospheric mantle (Long et al., Reference Long, Gao, Klemd, Beier, Qian, Zhang, Wang and Jian2011; Ding et al., Reference Ding, Xue, Zhao, Yan, Yaxiaer, Feng, Luo, Zu, Zhang and Dai2014; Feng & Zhu, Reference Feng and Zhu2019). It is also possible that the depleted mantle source overlaid the possible mantle plume (Long et al., Reference Long, Wang, Tang, Wang, Wang and Liao2012). In general, mafic rocks in bimodal magmatic suites formed during the post-collisional and/or in-plate extensional settings and frequently consisted of tholeiitic gabbros and basalts. At the same time, felsic members in bimodal magmatic suites, formed in these conditions, usually possess geochemical characteristics of A-type granites (Hildreth et al., Reference Hildreth, Halliday and Christiansen1991; Turner et al., Reference Turner, Sandiford and Foden1992; Frost & Frost, Reference Frost and Frost1997; Frost et al., Reference Frost, Frost, Chamberlain and Edwards1999; Bonin et al., Reference Bonin, Ethien, Gerbe, Cottin, Féraud, Gagnevin, Giret, Michon, Moine, Breitkreuz and Petford2004).
As mentioned above, the formation of basalts in the Wulang Formation involved asthenospheric material, and early underplated basalts were added into their source. Additionally, the felsic rocks in the Wulang Formation possess the geochemical characteristics of A-type granite, created by the partial melting of juvenile basaltic lower crust under high temperatures. We speculate that there are two possible causes for this high geothermal gradient: the uplift of asthenosphere material, and the detachment of the thickened lithosphere into the asthenosphere. The dynamic mechanisms, causing the rise of asthenospheric materials, mainly include oceanic ridge subduction, subducted plate fracture (Feng & Zhu, Reference Feng and Zhu2019) or the retraction roll-back of the subducted plate (Gvirtzman & Nur, Reference Gvirtzman and Nur1999), and lithospheric detachment disturbance (Altunkaynak, Reference Altunkaynak2007; Zhang et al., Reference Zhang, Zhang, Zhang, Xiong, Luo, Yang, Pan, Zhou, Xu and Guo2017). Numerous data indicate that starting from the late Carboniferous, this area had entered the stage of post-orogenic extensional development (Han et al., Reference Han, Ji, Song, Chen and Zhang2005; Mao et al., Reference Mao, Xiao, Han, Yuan and Sun2008; Tang et al., Reference Tang, Chen, Wang, Zhao, Wyman, Jiang and Jia2008; YJ Li et al., Reference Li, Li, Zhou, Gao, Gao, Tong and Liu2009; Tong et al., Reference Tong, Wang, Hong, Han, Zhang, Shi and Wang2010; Yang et al., Reference Yang, Li, Si, Wu, Jin and Zhang2010; Chen et al., Reference Chen, Deng, Liu, Xia and Liu2015; NB Li et al., Reference Li, Niu, Shan and Yang2015; Liu et al., Reference Liu, Wang and Chen2016; Liu & Chen, Reference Liu and Chen2020). In addition, magmatism caused by ocean-ridge subduction, slab rollback and slab breakage would be distributed along a narrow linear zone. At the same time, lithospheric delamination would affect a much wider area (Altunkaynak, Reference Altunkaynak2007). Geological facts indicate that volcanics in the late Palaeozoic are common in the western Tianshan. Therefore, the mechanism associated with plate subduction can be ruled out. It is then more likely that the detachment of the thickened lithosphere caused the uplift of the asthenospheric material. New research results on the western Tianshan also support the existence of detachment of lithosphere and asthenospheric uplift in the late Palaeozoic (Xia et al., Reference Xia, Xu, Xia, Li, Ma and Wang2004; Feng et al., Reference Feng, Xue, Zhao, Wang and Zhang2019; Li et al., Reference Li, Niu, Yang, Lai and Zhao2019). The early Carboniferous Akeshake Formation showed a broad and evident regional angular unconformity with the late Carboniferous Yishejilike Formation. Complex incongruous folds, angular fold, strong wrinkling, and regional ductile faults occurred within the Akeshake Formation, which was produced in the southern tropical and subtropical palaeogeographic region. The Akeshake Formation was created in the island arc and back-arc basin under a compressive tectonic system. Simultaneously, the late Carboniferous bimodal volcanic alkalic rocks and sedimentary formation were produced in a typical northern palaeogeographic region, which contained a suite of continental rift volcanic–sedimentary formation formed in the regional tectonic environment. Tectonic deformation is extremely weak (Li et al., Reference Li, Hu, Zhou, Tong and Tong2010). In addition, Permian terrestrial red molasse and coal-measure strata developed in the Yili basin, indicating rapid entering of the post-collision extension stage by the Tianshan area during the early Permian. Therefore, we believe that the bimodal magmatism was produced by delamination in an extensional tectonic setting.
7. Conclusions
Geological characteristics collected in the field and geochemical data obtained in the laboratory indicate that volcanics in the Yishijilike Formation and Wulang Formation from the Western Awulale area, Western Tianshan, are bimodal. Geochemical and isotopic compositions suggest that the mafic members in bimodal volcanic rocks resulted from partial melting of subduction-modified lithospheric mantle mixed with the asthenospheric mantle. The felsic rocks formed by partial melting of the newly underplated mafic lower crust. These typical bimodal volcanics very likely formed in a post-collisional extensional environment, indicating that the Awulale area already existed during its intraplate evolution stage in the Late Carboniferous period. These observations indicate that the bimodal magmatism was induced by the underplate of the asthenospheric mantle in reaction to the lithospheric mantle detachment and the extensional environment.
Supplementary material
To view supplementary material for this article, please visit https://doi.org/10.1017/S0016756820001090
Acknowledgements
Financial support for this work was provided by the Second Tibetan Plateau Scientific Expedition and Research Program (STEP) (Grant No. 2019QZKK0803), Deep Resources Exploration and Mining, a Special Project in the Framework of National Key R&D Program of China (2017YFC0602302), the Fundamental Research Funds for the Central Universities (Project Nos. 191gpy75), the Open-Cooperation Fund of Key Laboratory of Mineralogy and Metallogeny, Guangzhou Institute of Geochemistry, Chinese Academy of Sciences (KLMM20190204) and the Guangdong Basic and Applied Basic Research Foundation (2020A1515010906). We are also grateful to the editor Kathryn Goodenough for her assistance as well as to anonymous reviewers, whose comments and suggestions improved our paper.
Conflict of interest
None.