INTRODUCTION
Sugar beet (Beta vulgaris L.) provides c. 0·35 of the world white sugar (Hergert Reference Hergert2010). In Europe, sugar beet is grown on diverse soils and under various climatic conditions, which determine yield (Märländer et al. Reference Märländer, Hoffmann, Koch, Ladewig, Merkes, Petersen and Stockfisch2003; Hoffmann et al. Reference Hoffmann, Huijbregts, Van Swaaij and Jansen2009) and result in low yield stability (Chloupek et al. Reference Chloupek, Hrstkova and Schweigert2004). Sugar beet growers aim for both high fresh root weight (FRW) and sucrose content (SC,% in fresh roots) that produce high sugar yield (SY).
In Greece, sugar beet is grown in the central (Thessaly) and northern (Macedonia and Thrace) parts of the country where erratic and low rainfall during summer is the main constraint on productivity (Morillo-Velarde & Ober Reference Morillo-Velarde, Ober and Draycott2006). Thus, the sugar beet crop is irrigated and irrigation water needs are estimated at 200–550 mm, descending from the northern to central areas (Analogides Reference Analogides1993). However, sugar beet is mostly grown under water deficit conditions due to irrigation water shortages, mainly in central Greece.
Under Mediterranean conditions, water shortages during the summer are accompanied by air temperatures much higher than the optimum (25 °C) for sugar beet growth and yield (D'Ambrosio et al. Reference D'ambrosio, Arena and De Santo2006; Kenter et al. Reference Kenter, Hoffmann and Märländer2006). In Greece, maximum air temperatures higher than 30–35 °C are common from June till mid-September. High temperatures decrease photosynthetic rate and increase photorespiration, thus retarding growth (D'Ambrosio et al. Reference D'ambrosio, Arena and De Santo2006; Tsialtas & Maslaris Reference Tsialtas and Maslaris2008). Irrigation could potentially compensate for the negative effects of thermal stress on plant growth (Mahan et al. Reference Mahan, Mcmichael and Wanjura1995) but it offers only a partial alleviation of high temperature stress in sugar beet (Qi & Jaggard Reference Qi and Jaggard2006).
The length of growing season affects yield, with better yields from crops sown early (Durrant et al. Reference Durrant, Mash and Jaggard1993; Richter et al. Reference Richter, Qi, Semenov and Jaggard2006). As a biennial species, sugar beet grows as long as the growing season lasts (Launay et al. Reference Launay, Graux, Brisson and Guerif2009). The putative growing season (PGS) of sugar beet in Greece extends from early March to mid-November. Plants sown early, in February, can be damaged by late-season frosts, while autumn rainfall restricts the use of harvesters on heavy, mineral soils and therefore inhibits late harvesting. Moreover, late in autumn, yield increments decline due to low temperatures and irradiance interception (Scott et al. Reference Scott, English, Wood and Unsworth1973). Climate change, with increasing summer temperatures and decreasing rainfall, is likely to affect crop development, change agronomic practices such as sowing date and is expected to affect sugar beet growth and yield even in central and northern Europe (Jones et al. Reference Jones, Lister, Jaggard and Pidgeon2003; Estrella et al. Reference Estrella, Sparks and Menzel2007; Kaukoranta & Hakala Reference Kaukoranta and Hakala2008).
GDD (the sum of the daily maximum (T max) and minimum (T min) air temperatures compared with a base temperature) is a thermal index related to plant development, yield and maturity in determinate crops (Swan et al. Reference Swan, Schneider, Moncrief, Paulson and Peterson1987; Klepper et al. Reference Klepper, Rickman, Zuzel and Waldman1988). In sugar beet, a crop without a specific phenological stage of maturity, GDD have been related to growth stages, i.e. canopy closure and root growth (Kenter et al. Reference Kenter, Hoffmann and Märländer2006; Bellin et al. Reference Bellin, Schulz, Soerensen, Salamini and Schneider2007) but they have not been used for harvest time determination.
Factory campaign planning and length are very important for the profitable operation of sugar industries. Monitoring, by periodic harvests in commercial fields, is commonly used to assess seasonal yield trends but it is both money- and time-consuming. For those reasons and in order to simulate climate change effects on sugar beet, yield forecasting models based on weather and soil parameters (nutrients and soil water availability) have been evolved (Spitters et al. Reference Spitters, Kiewiet and Schiphouwer1990; Qi et al. Reference Qi, Kenter, Hoffmann and Jaggard2005; Richter et al. Reference Richter, Qi, Semenov and Jaggard2006; Jaggard et al. Reference Jaggard, Qi and Semenov2007).
Greece is characterized by its fragmented terrain, which affects pedo-climatic conditions and leads to significant variation of GDD climatology in the main agricultural areas (Matzarakis et al. Reference Matzarakis, Ivanova, Balafoutis and Makrogiannis2007). The aims of the present work were to: (a) define the optimum harvest time, in terms of DAS (DASMFRW, DASMSY) and GDD (GDDMFRW, GDDMSY), of sugar beet grown in the main growing areas and (b) relate yields of the last harvest of season (FRWLH, SYLH) with climatic variables (temperatures and water availability).
MATERIALS AND METHODS
Locations and experimentation
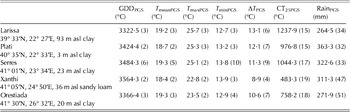
Field experiments, aimed at monitoring yield formation during the growing season, were conducted from 1999 to 2006, in the main sugar beet growing areas in central (Larissa) and northern Greece (Plati, Serres, Xanthi and Orestiada). Table 1 presents information on soil type and climatic conditions during the PGS for each location.
Comparison of thermal variables and rain during the PGS (March–mid November) from 1999 to 2006. The CV% is given in parenthesis

GDD, growing degree days; T mean, average mean temperature; T max, average maximum temperature; T min, average minimum temperature; ΔT, T max−T min; CT25, cumulative temperatures above 25 °C.
Randomized complete-block design experiments with six replications for each harvest were sown at the time when c. 0·50 of growers’ fields had been sown in each location and growing season. Plots consisted of six rows (8 m long), 0·45–0·50 m apart, where seeds were drilled mechanically at 0·10–0·15 m spacing in the row. The cultivars used (Corsica, Creta, Dorothea, Palma, Rival and Rizor) were rhizomania-tolerant and well adapted to each location. Fertilization was applied as both basal (110 kg N/ha, 90 kg P/ha and 265 kg K/ha) and top-dressing (40 kg N/ha). Supplemental irrigation was provided according to irrigation water availability and standard practices applied by growers in each location. Water input (WI) was calculated as the sum of rain and irrigation water applied to each experiment. Chemical spraying and hand weeding were employed to suppress the weeds. Full protection against insects, Cercospora and powdery mildew was provided by spraying.
Beginning in early June and depending on year and location, 7–12 successive harvests were conducted during the growing season and completed by the end of the harvest campaign. In each harvest, three internal rows of 7 m long, for each of six plots were harvested by hand (10·5 m2 harvested area). Sugar beet plants were topped by hand, number of roots was counted and FRW per plot was recorded. In all cases, root number was higher than 75 000 roots/ha. A random sub-sample of 25–30 roots per plot was transferred to the factory's tare house for root quality assessment (SC,% in fresh roots, K, Na and α-amino N concentration). Measurements were conducted using a Venema automatic beet laboratory system (Venema Automation b.v., Groningen, The Netherlands) connected to a BETALYSER® analysing system (Dr Wolfgang Kernchen GmbH, Seelze, Germany). SY per plot was calculated as the product of FRW and SC. Yields at the last harvest (FRWLH, SYLH) were used for comparisons between locations and for plotting against thermal and water variables recorded over the growing season.
Thermal variable computation and estimation of harvest time for maximum yield
Tables 1 and 2 present thermal and water variables for the five locations during the putative and the actual growing seasons (PGS, March to mid-November and AGS, seeding date to last harvest, respectively). The estimation of the variables for both PGS and AGS was conducted to indicate the gap between the climatic potential and the actually exploited fraction of this potential in each location.
Comparison of thermal and water variables during the AGS (from sowing to last harvest date) in each location. The CV% is given in parenthesis. n is the number of years for which experimentation was conducted in each location

GDD, growing degree days; T mean, average mean temperature; T max, average maximum temperature; T min, average minimum temperature; ΔT, T max−T min; CT25, cumulative temperatures above 25 °C; WI, water input (rain + irrigation).
Hourly recorded data of rain, air maximum (T max) and minimum (T min) temperatures were obtained from the nearest meteorological station, which was located within 4–10 km of each experimental site.
Calculation of the GDD (°C) was according to Zalom et al. (Reference Zalom, Goodell, Wilson, Barnett and Bentley1983):
 $${\rm GDD} = {\rm} \Sigma (T_i - T_{{\rm base}} )$$
where T i is the mean daily air temperature (T mean), estimated by T max and T min as
 $$[(T_{{\rm max}} + T_{{\rm min}} )/{\rm 2}]$$
If T max > 25 °C, T i = [25–(T max–25)+T min]/2. T base was set to 3 °C, below which leaf expansion rate is zero (Milford et al. Reference Milford, Pocock and Riley1985).
Cumulative temperatures above the threshold temperature of 25 °C (CT25) were calculated, for a given time period, as
 $${\rm CT}_{{\rm 25}} = \Sigma (T_{{\rm max}} -{\rm 25})$$
The difference between T max and T min (ΔT) was calculated as
 $$\Delta T = T_{{\rm max}} -T_{{\rm min}} $$
In each experiment, GDD were summed for each harvest occasion during the AGS. Yield data (FRW, SY), after log-transformation, were plotted against DAS and GDD. Transformation rendered variability over time more homogeneously (Mamolos Reference Mamolos2006). The best-fitted curves (a total of 72) were quadratic functions, highly significant (P < 0·001) with R 2 ⩾ 0·92. For each experiment, the first derivative (linear function) of the best-fitted, quadratic functions was estimated. The solution of the linear function, when y was set equal to zero, gave the estimation of optimal harvest time in terms of DAS (DASMFRW, DASMSY) or GDD (GDDMFRW, GDDMSY), respectively (Snedecor & Cochran Reference Snedecor and Cochran1989).
Statistical analysis
Thermal and water variables during PGS (Table 1) were subjected to one-way ANOVA with location as the main factor and eight replications (years were set as replications).
Analysis of FRWLH, SYLH, AGS length (DASAGS), thermal (T minAGS, T maxAGS, T meanAGS, ΔT AGS, GDDAGS, CT25AGS) and water (RainAGS, IrrigationAGS, WIAGS) variables (Tables 2 and 3) was done by one-way ANOVA with location as the main factor and with unequal replications (Snedecor & Cochran Reference Snedecor and Cochran1989). The same analysis was conducted for DASMFRW, DASMSY, GDDMFRW and GDDMSY. This analysis was followed because the experiments were conducted for different numbers of years in each location (Table 2).
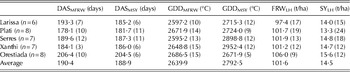
Mean comparisons of time of yield (FRW, SY) maxima achievement in terms of DAS (DASMFRW, DASMSY) and GDD (GDDMFRW, GDDMSY), FRW and SY at the last harvest of the season (FRWLH, SYLH) in the five locations. CV% is given in parenthesis. n is the number of years for which experimentation was conducted in each location

Means were compared with Duncan's multiple range test at P < 0·05. Best-fitted curves and statistical analysis were performed using SPSS software (version 16.0, SPSS Inc., IL, USA).
RESULTS
Thermal and water variables during PGS and AGS
Locations differed significantly regarding thermal and water variables during both PGS and AGS (Tables 1 and 2). Location ranking according to the climatic variables diverged between PGS and AGS. Thus, the southernmost location (Larissa) had the lowest GDDPGS and the highest T maxPGS, ΔT PGS and CT25PGS. The opposite was evident for Xanthi (Table 1). Despite a difference of c. 100 mm between the lowest (Larissa) and the highest (Plati) values recorded, RainPGS did not differ significantly between locations. This was due to the high variation between years, evident mainly in the northern locations (Xanthi and Orestiada) and confirmed by the high coefficients of variation (CVs) (Table 1).
Regarding AGS, Plati showed the lowest GDDAGS. Locations did not differ for T meanAGS, while the northern locations (Xanthi and Orestiada) had the lowest T maxAGS and CT25AGS. The highest T minAGS was recorded in Larissa and Orestiada. Larissa and Plati had the highest ΔT AGS, while the lowest was found in Xanthi (Table 2). Locations did not differ significantly for RainAGS and WIAGS (RainAGS + IrrigationAGS). Based on CVs, Xanthi had the less stable RainAGS but the most stable IrrigationAGS, while Larissa had the less stable inputs. Larissa and Xanthi showed the most variable WIAGS (Table 2).
AGS length, yields (FRWLH, SYLH) and optimal harvest time
The southernmost (Larissa) and the northernmost (Orestiada) locations had longer-lasting DASAGS (234·0 and 230·1 days, respectively). Plati had the shortest DASAGS (205·3 days) showing the highest variability (Table 2).
Using combined data over the years, FRWLH and SYLH did not differ significantly between locations (Table 3): FRWLH ranged from 97·4 t/ha in Larissa up to 106·0 t/ha in Orestiada, while SYLH ranged from 13·3 t/ha in Plati up to 15·6 t/ha in Orestiada. Yields were less stable in the southern locations (Larissa, Plati and Serres) compared with the northern (Xanthi and Orestiada).
The longest DASMFRW was estimated for Orestiada (206·4 days), while Plati and Xanthi had the lowest values (178·1 and 184·1 days, respectively). The DASMFRW estimated for Larissa and Serres were 193·3 and 189·6 days, respectively (Table 3). Orestiada had also the highest DASMSY (204·5 days), while for the remaining locations, DASMSY ranged from 181·7 to 187·3 days (Table 3).
No significant differences were found among locations regarding GDDMFRW and GDDMSY probably due to the high CVs. Although higher, over location GDDMSY (2792·5 °C) did not differ significantly compared with GDDMFRW (2639·9 °C).
Relationships between FRWLH and SYLH with climatic variables during AGS
Combining data over all locations (CDAL), non-significant or weak relationships were found between climatic variables and yields (FRWLH, SYLH). Setting apart Xanthi, which showed specific thermal features, the remaining four locations (Larissa, Plati, Serres and Orestiada) were grouped together combining data over the four locations (CDFL).
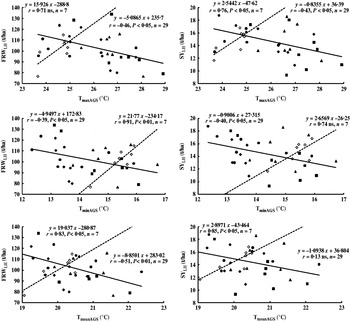
Temperatures (T maxAGS, T minAGS, T meanAGS) were significantly related to yields (Fig. 1). Combining data for the four locations gave significant, negative correlations between temperature and FRWLH, with the T meanAGS-FRWLH correlation being the strongest (r = − 0·51, P < 0·01, n = 29). In Xanthi, significant correlations were found between FRWLH and T minAGS or T meanAGS (Fig. 1). For CDFL, the T maxAGS-SYLH correlation was significant, whereas in Xanthi, SYLH was correlated significantly with T maxAGS and T meanAGS (Fig. 1). For CDAL, quadratic functions were the best-fitted curves for the T maxAGS-FRWLH (R 2 = 0·28, P < 0·01, n = 36) and T maxAGS-SYLH (R 2 = 0·18, P < 0·05, n = 36) relationships, whereas a negative correlation associated the T meanAGS and FRWLH (r = − 0·36, P < 0·05, n = 36). The first derivates of the quadratic functions estimated the optimum T maxAGS for FRWLH and SYLH at 25·5 and 25·1 °C, respectively.
Correlations between yields (FRWLH, SYLH) and average temperatures during the AGS (T maxAGS, T minAGS, T meanAGS) in Xanthi (dashed line, n = 7, ◊) and combined data over the four locations (solid line, n = 29, Larissa: ♦, Plati: ■, Serres: ▲, Orestiada: ●). ns: non-significant.

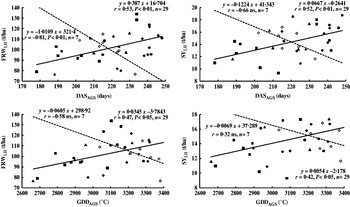
In CDFL, significant positive correlations between DASAGS or GDDAGS and FRWLH or SYLH were found, with the strongest being those between DASAGS and yield (Fig. 2). In Xanthi, the respective correlations were negative but weak, with only that between DASAGS and FRWLH found to be significant (r = − 0·81, P < 0·01, n = 7). In CDAL, DASAGS and yields (FRWLH, SYLH) were positively correlated (FRWLH: r = 0·42, P < 0·05, n = 36 and SYLH: r = 0·43, P < 0·01, n = 36), whereas the best-fitting curves between GDDAGS and yields were curvilinear (FRWLH: R 2 = 0·30, P < 0·01, n = 36 and SYLH: R 2 = 0·19, P < 0·05, n = 36).
Plotting yields (FRWLH, SYLH) against DASAGS and GDDAGS in Xanthi (dashed line, n = 7, ◊) and combined data over the four locations (solid line, n = 29, Larissa: ♦, Plati: ■, Serres: ▲, Orestiada: ●). ns: non-significant.

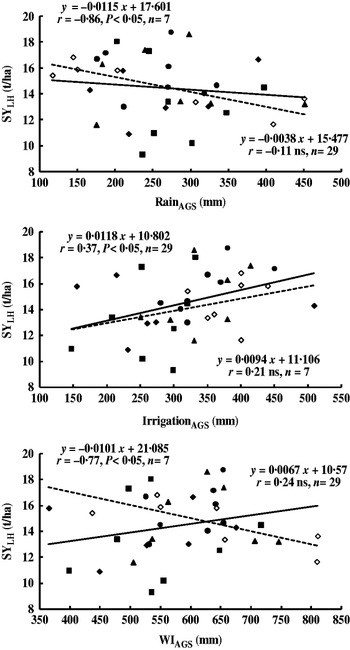
No significant relationship was found between FRWLH and RainAGS, IrrigationAGS or WIAGS in both Xanthi and CDFL. In Xanthi, negative correlations were found between SYLH and RainAGS or WIAGS, while in CDFL, a positive correlation between SYLH and IrrigationAGS was evident (Fig. 3). In CDAL, significant linear and curvilinear relationships were found between SYLH and IrrigationAGS (r = 0·35, P < 0·05, n = 36) and between FRWLH and WIAGS (R 2 = 0·18, P < 0·05, n = 36). The first derivative of the latter function estimated optimum WIAGS for FRWLH at 626·25 mm.
Correlations between SYLH and water variables during the AGS (RainAGS, IrrigationAGS and WIAGS: rain + irrigation) in Xanthi (dashed line, n = 7, ◊) and combined data over the four locations (solid line, n = 29, Larissa: ♦, Plati: ■, Serres: ▲, Orestiada: ●). ns: non-significant.

DISCUSSION
Yields and time of yield maxima
Sugar beet is grown as an irrigated spring crop in central and northern Greece on medium- to heavy-textured soils and under Mediterranean to mild continental conditions. Xanthi, on a sandy loam, showed the most favourable and stable temperatures for sugar beet, recording the highest GDD and the lowest CT25 among locations for both PGS and AGS. Temperature and water availability were most limiting in the southernmost Larissa.
Sugar beet yield is significantly affected by location and year (Märländer et al. Reference Märländer, Hoffmann, Koch, Ladewig, Merkes, Petersen and Stockfisch2003; Hoffmann et al. Reference Hoffmann, Huijbregts, Van Swaaij and Jansen2009) showing high variability (Chloupek et al. Reference Chloupek, Hrstkova and Schweigert2004). Over years, yield was not affected by location but, using CVs as a yield stability index (Peltonen-Sainio et al. Reference Peltonen-Sainio, Jauhiainen and Hakala2009), southern locations (Larissa, Plati, and Serres) showed higher variation. The highest variation was found in Plati and was ascribed to the highly variable DASAGS, which was negatively correlated with temperatures (data not shown). Previously, Richter et al. (Reference Richter, Qi, Semenov and Jaggard2006) reported a negative relationship between sugar beet yield stability and soil water availability.
It is important to harvest sugar beet at the appropriate time in order to maximize sugar extraction and meet daily factory demands. Usually, factories monitor yield trends during the course of the growing season by conducting successive samplings in commercial fields. This process is time-, labour- and consequently, money-intensive. Models evolved to predict yield trends during growing season are based on climatic and soil variables (Spitters et al. Reference Spitters, Kiewiet and Schiphouwer1990; Qi et al. Reference Qi, Kenter, Hoffmann and Jaggard2005; Richter et al. Reference Richter, Qi, Semenov and Jaggard2006; Jaggard et al. Reference Jaggard, Qi and Semenov2007), but their accuracy is acceptable only under specific pre-conditions.
The present paper attempts to define the optimum time for sugar beet harvest in each location in terms of DAS and GDD. Based on GDD, optimum harvest time did not differ between locations. Over locations, average GDDMFRW and GDDMSY were estimated at 2639·9 and 2792·5 °C, respectively, being lower than 2900 °C, defined as a limit for spring crops to complete their growth cycle (Matzarakis et al. Reference Matzarakis, Ivanova, Balafoutis and Makrogiannis2007). The five locations differed significantly for DAS necessary for maximum yields, with the northernmost Orestiada requiring the longest period (DASMFRW: 206·4 days, DASMSY: 204·5 days). The means over locations were estimated at c. 190·0 days for both DASMFRW and DASMSY. Elongation of the growing season (early sowing, late harvest) has been proposed as a means for increasing yield in climates where water availability is a limiting factor (Richter et al. Reference Richter, Qi, Semenov and Jaggard2006). Early sowing is considered to be more effective for growing-season elongation because of the earlier canopy closure and thus, the better radiation interception during early crop growth (Richter et al. Reference Richter, Qi, Semenov and Jaggard2006; Malnou et al. Reference Malnou, Jaggard and Sparkes2008). Delayed harvest has a lower impact on yield due to the small yield increment in late autumn as a result of low solar radiation (Tsialtas & Maslaris Reference Tsialtas and Maslaris2008). Moreover, the use of heavy machinery, such as harvesters, late in the season is restricted by wet conditions, especially on clay soils, which causes soil compaction and increases losses (Richter et al. Reference Richter, Qi, Semenov and Jaggard2006). Early sowing could be an effective means of increasing yields in Plati where a wide gap between PGS and AGS climatic variables was evident.
Effects of thermal and water variables on yields (FRWLH, SYLH)
According to Qi et al. (Reference Qi, Kenter, Hoffmann and Jaggard2005), the most important variables affecting sugar beet performance are temperature, solar radiation, rainfall, evapotranspiration and soil water availability. Radiation interception is the major limiting factor in northern Europe and for this reason, yield prediction models are based on this variable (Richter et al. Reference Richter, Jaggard and Mitchell2001; Qi et al. Reference Qi, Kenter, Hoffmann and Jaggard2005). In the Mediterranean basin, high temperatures and water availability during summer determine yield (Jaggard & Qi Reference Jaggard, Qi and Draycott2006; Rinaldi & Vonella Reference Rinaldi and Vonella2006). Optimum mean daily air temperature for sugar beet root growth was defined at 18 °C, corresponding to maximum temperatures of 22–26 °C (Kenter et al. Reference Kenter, Hoffmann and Märländer2006), coinciding with the optimum temperature (25 °C) for sugar beet photosynthesis (D'Ambrosio et al. Reference D'ambrosio, Arena and De Santo2006). In accordance, over locations, optimum T maxAGS for FRWLH and SYLH were estimated at 25·5 and 25·1 °C, respectively. These optima were derived from the conjunction of the positive correlations found for the cooler, sub-optimal temperatures of Xanthi and the negative ones of the warmer, above-optimal temperatures of the remaining locations.
In southern locations and particularly in Larissa, sugar beet is grown under temperatures higher than optimum from as early as May, thereby accumulating higher and more harmful temperatures (CT25AGS). During July and August, maximum daily temperatures higher than 35 °C are common, leading to foliage senescence and thus, diminishing radiation interception. Irrigation is proposed as a means for cooling heat-stressed crops (Mahan et al. Reference Mahan, Mcmichael and Wanjura1995; Qi & Jaggard Reference Qi and Jaggard2006) but, in Larissa, irrigation water is supplied at sub-optimal rates (Analogides Reference Analogides1993) because of its shortage and/or the priority given to the irrigation of cotton. Lower yields under higher T minAGS, and actually under higher night-time temperatures, could be ascribed to increased respiration of sugar beet resulting in higher consumption of carbohydrates composed under the stressful daytime conditions. Low night temperatures increase SC in roots (Ulrich Reference Ulrich1955; Yadollahi & Asadiyeh Reference Yadollahi and Asadiyeh2009), thus compensating for root weight losses and keeping SY unaffected. The findings of the present paper contrast with those of Milford & Thorne (Reference Milford and Thorne1973), who reported that under UK conditions, sugar beet subjected to low night temperatures contained less water and had lower FRW.
Xanthi, a location with different soil type and climatic variables than the other locations, resembles the temperate regions. Average temperatures (T min, T max, T mean), ΔΤ and CT25 during both PGS and AGS were the lowest, while the average T max did not exceed the optimum of 25 °C. Thus, the positive correlations found between temperatures and yields are completely rational. The positive correlation between FRWLH and T minAGS could be ascribed to the higher water content and consequently higher FRW of sugar beet grown under higher night temperatures as reported by Milford & Thorne (Reference Milford and Thorne1973). SY increased with increasing T maxAGS and T meanAGS, which were averaged at 24·5 and 20·0 °C, respectively. The restrictive effect of sub-optimal air temperatures on yield was intensified by higher rainfall during the cooler growing seasons since a negative correlation between the variables was evident (data not shown). In Xanthi, supplemental irrigation (381 mm) exceeded optimum (200 mm) for this location (Analogides Reference Analogides1993), resulting in further cooling of the sugar beet canopy and intensifying the negative effects of the sub-optimal temperatures on productivity (Kincaid et al. Reference Kincaid, Westermann and Trout1993). The light-textured soil and consequently low soil water-holding capacity, along with the high RainAGS variation, led growers to over-irrigate in order to secure ample water supply. Thus, they further lowered sub-optimal temperatures for sugar beet, with detrimental effects on yields. Leaching was not considered as a case relating high WI with low yield because N fertilization was within the recommended range (or even higher) and despite the fact that water was excessively supplied at Xanthi, WI did not exceed the amount (650 mm) necessary for maximum yield (FAO 2012). Moreover, sugar beet is a deep-rooted species pumping up water and nutrients from depth down to 1·8–2·0 m, thereby helping to minimize N losses due to leaching.
Contrary to other locations in Greece, the projected climate change with the projected temperature increase during summer is likely to affect yield positively in Xanthi (Jaggard et al. Reference Jaggard, Qi and Semenov2007). This confirms Donatelli et al. (Reference Donatelli, Tubiello, Peruch and Rosenzweig2002), who reported climate change to have both negative and positive impacts on sugar beet productivity in different regions in the Mediterranean basin.
Regarding thermal variables, it is noteworthy that no significant correlation was found between yields (FRWLH, SYLH) and ΔT AGS (T maxAGS−T minAGS). High day/night temperature amplitude has been reported to increase yield and improve quality since it leads to a highly positive net photosynthate budget (Bakker & van Uffelen Reference Bakker and Van Uffelen1988).
Elongation of AGS (DASAGS) by early sowing and the subsequent increase of GDDAGS would be beneficial for sugar beet grown in warmer locations, but not in Xanthi with its sub-optimal temperatures. Previously, Niwa et al. (Reference Niwa, Seino, Yokobori, Kikuchi and Hongo2008) reported a relationship between GDD and SY in Japan. Actually, elongation of the growing season in warmer locations would affect yield positively through a decrease of average temperatures (T maxAGS, T meanAGS). Adversely, in Xanthi, AGS elongation sub-optimizes growing season temperatures by growing sugar beet under even sub-optimal temperatures and increasing WIAGS (mainly RainAGS).
In conclusion, over the study period, locations differed mainly in thermal variables but they had similar yields (FRWLH, SYLH) and GDDMFRW. However, locations showed significant differences in DASMFRW and DASMSY, with the northernmost Orestiada showing the longest periods (>200 days). Over locations, DASMFRW and DASMSY were estimated at c. 190 days. Temperatures had contrasting effects on yields. Combining data over the four locations (Larissa, Plati, Serres and Orestiada), FRWLH and SYLH were negatively correlated to average temperatures over the AGS (T maxAGS, T minAGS, T meanAGS). In Xanthi, sugar beet was grown under sub-optimal temperatures and yield was increased by higher temperature. Elongation of AGS could eliminate the adverse effects of temperature on yield only in the warmer locations. In Xanthi, projected temperature increase, due to climate change, would be beneficial for sugar beet.
We would like to thank the staff of Hellenic Sugar Industry SA engaged in experimentation and Hellenic National Meteorological Service for providing meteorological data. We are grateful to Dr A. A. Gagianas, Professor Emeritus, Faculty of Agriculture, Aristotle University of Thessaloniki, for his critical reading of the paper.