INTRODUCTION
Radiocarbon (14C) dating of primary carbonates (i.e. aragonite, calcite) requires an estimation of the 14C “reservoir age” (RA), a property that describes the age equivalent of the radiocarbon content of the dissolved inorganic carbon (DIC) in the precipitating solution at the time of mineral deposition.
The 14C RA, tRA, at the time of carbonate precipitation is defined here by the following equation:
 $${{\rm{t}}_{{\rm{RA}}}} = - {1 \over {{ {\lambda }}}} \cdot {\rm{ln}}{{{{\rm{F}}_{{\rm{RA}}}}} \over {{{\rm{F}}_{{\rm{atm,t}}}}}}$$
Where: λ is the Libby decay constant of 14C (1/8033 yr–1, Stuiver and Polach Reference Stuiver and Polach1977); FRA is the fraction of radiocarbon (F is expressed in fraction of modern carbon units [fMC]) in the carbonate mineral (considered to be equal to the fraction of radiocarbon in waterʼs DIC) at the time of its precipitation, t; and Fatm,t is the fraction of radiocarbon in atmosphereʼs CO2 at the same time, t. The time t is the calendar age of organic debris collected from the same stratigraphic horizon as the carbonate mineral, which can be determined also by any independent chronological method, such as U-Th dating, e.g. Schramm et al. Reference Schramm, Stein and Goldstein2000.
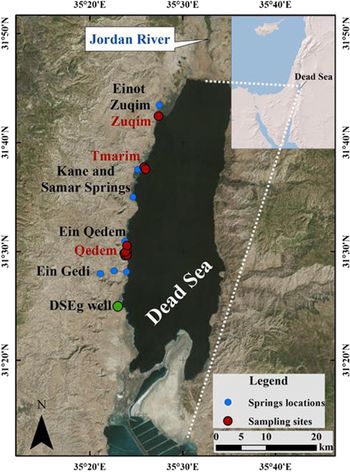
Typically, the DI14C/DIC ratio of the precipitating solution is lower than the 14CO2/CO2 ratio of the contemporaneous atmosphere (F<1) due to mixing with different proportions of older (or even “dead”) carbon. Minerals of Ca-carbonates, typically aragonite, that were formed in the late Quaternary lakes that filled the tectonic depression of the Dead Sea Basin (e.g. the last glacial Lake Lisan and the Holocene Dead Sea, see review in Stein Reference Stein2001) incorporated in their lattice 14C from the lakeʼs DIC (e.g., the pioneering work of W.S. Broecker in: Begin et al. Reference Begin, Broecker, Buchbinder, Druckman, Kaufman, Magaritz and Neev1985; and later works by Stein et al. Reference Stein, Goldstein and Schramm2000; Bookman et al. Reference Bookman, Lazar, Stein and Burr2007; Prasad et al. Reference Prasad, Negendank and Stein2009). The lake received its dissolved 14C from various water types, hence, radiocarbon content in the CaCO3 minerals that precipitated in the lake can be used as a monitor of its hydrological history, provided the age of the mineral is estimated independently (e.g., by U-Th dating, Haase-Schramm et al. Reference Haase-Schramm, Goldstein and Stein2004). The lakes that occupied the Dead Sea basin were fed by different fresh-to-hypersaline water sources characterized by distinct apparent 14C ages, which reflected their hydrological histories (Belmaker et al. Reference Belmaker, Stein, Yechieli and Lazar2007; Stein et al. Reference Stein, Migowski, Bookman and Lazar2004, Reference Stein, Lazar and Goldstein2013). The 14C content in these sources have rather wide range, from ~1 fMC (atmospheric 14C values) for runoff waters, almost equilibrated with the atmospheric CO2 (Belmaker et al. Reference Belmaker, Stein, Yechieli and Lazar2007) to ~0.04–0.1 fMC in the Ein Qedem saline springs (Weber et al. Reference Weber, Yechieli, Stein, Gavrieli, Yokochi, Zappala, Mueller and Lazar2018) that currently discharge to the Dead Sea (Figure 1 for location). The origin of the Ein Qedem springs, based on its chemical composition and radiocarbon content, was attributed to the epilimnetic brine of the last glacial Lake Lisan that infiltrated the marginal aquifers at ~25 cal kyr BP, when the lake reached its highest stand (Weber et al. Reference Weber, Yechieli, Stein, Gavrieli, Yokochi, Zappala, Mueller and Lazar2018). Stein et al. Reference Stein, Migowski, Bookman and Lazar2004 calculated RA of the Holocene Dead Sea using pairs of aragonite and organic debris from the same stratigraphic horizons in a sediment core drilled at Ein Gedi spa (DSEg, see Figure 1 for location). The calculated RA values range from ~6000 to 2200 yr, the high RA value was related to enhanced contribution of an old Ca-chloride brine that discharged from saline springs during low stands of the lake, and the lower RA values were attributed to addition of freshwaters that equilibrated with the atmosphere (Stein et al. Reference Stein, Migowski, Bookman and Lazar2004).
Satellite picture showing the locations of the main springs (solid blue circles, black fonts), the sampling sites (solid red circles, red fonts) and the location of Ein Gedi (DSEg) well (solid green circle, black font) on western shore of the Dead Sea. The inset shows the location of the Dead Sea within the eastern Mediterranean. (Please see electronic version for color figures.)

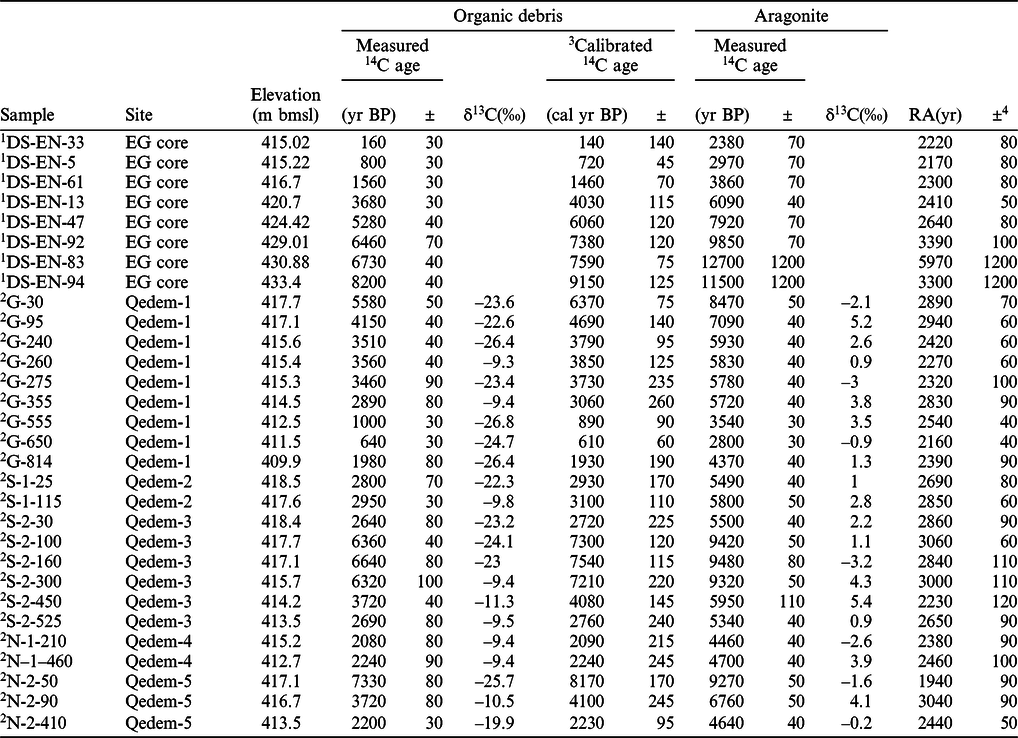
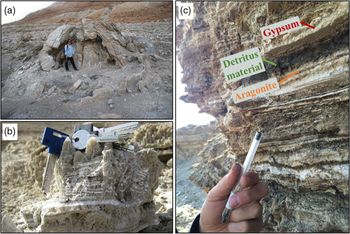
Here, we expand the study on the behavior of radiocarbon (and the RA) in the Holocene Dead Sea and its use as a paleohydrological monitor of the Dead Sea water-system (e.g., the contribution of freshwater to the lake during the Holocene). The work is based on high resolution 14C analyses of organic debris and co-existing primary aragonite from the exposed sections of the Ze’elim Formation that was deposited at the Dead Sea during the Holocene (Ken-Tor et al. Reference Ken-Tor, Agnon, Enzel, Stein, Marco and Negendank2001; Migowski et al. Reference Migowski, Stein, Prasad, Negendank and Agnon2006; Stein, Reference Stein2014) at the Qedem shore (Figure 1). The sedimentary section at the Qedem shore comprises sequences of aragonite and gypsum that appear as layers and crusts (Table 1, Figure 2) that were deposited in the Holocene Dead Sea during the past ~7000 years (part of the Ze’elim Fm.). The Qedem shore is also pitted with “gypsum structures” (Figure 2a, Table 2). We measured the radiocarbon contents in carbonate material and organic debris from the Qedem “gypsum structures” and similar structures that are exposed along the retreating western shores of the Dead Sea. The radiocarbon dating of the “gypsum structures” is a part of the ongoing investigation on their formation mechanism.
14C ages measured on pairs of aragonite and organic debris from the Ze’elim Formation, Holocene Dead Sea. The pairs were sampled from same stratigraphic horizons along the EG core and from columnar sections on the Qedem shore.

1 Data from Stein et al. (Reference Stein, Migowski, Bookman and Lazar2004).
2 Qedem site radiocarbon was measured at the AMS facilities at the University of Arizona.
3 The calibrated age was calculated from the radiocarbon (Libby) age by OxCal software (Oxford University). The reported age is the mean of the obtained range and the error of the age is the range divide by 2.
4 The error on tRA was calculated by the equation:  $\Delta {{\rm{t}}_{{\rm{RA}}}} = \sqrt {\Delta {{\rm{t}}_{real}}^2 + \Delta {{\rm{t}}_{app}}^2} $ where ) Δtreal and Δtapp are the error values of the 14C age of the of organic debris as measured by AMS and Δ the 14C age of the aragonite, respectively.
The main geological features in the study area: (a) large “gypsum structure”, a concentric mound composed of gypsum and aragonite layers; (b) large bladed gypsum crystals with thin layers of aragonite; (c) outcrop of the Ze’elim Formation on the Ein Qedem shore showing layers of gypsum, aragonite and detritus material.

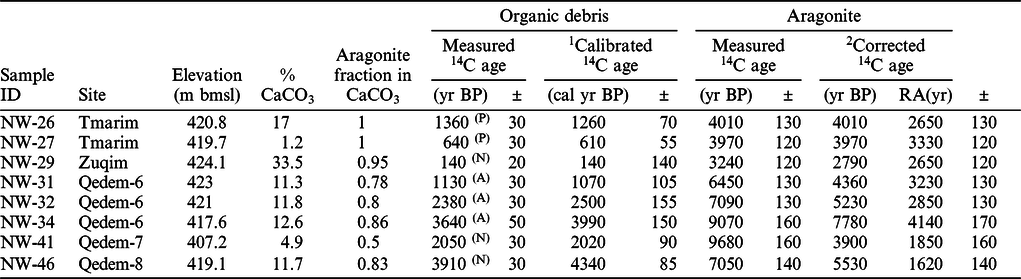
14C ages of aragonite “trapped” in gypsum layers and 14C ages on organic matter from the same stratigraphic horizons in several Holocene exposures along the Dead Sea shore.

Organic debris radiocarbon analyses were measured at ANSTO(A), NOSAMS(N) and Poznan(P).
1 The calibrated age was calculated by OxCal software (Oxford University). The reported age is the mean of the obtained range and the error of the age is the range divide by 2.
2 Corrected 14C age of the aragonite was calculated from the aragonite fraction in sampleʼs CaCO3 according to Eq. 6 of Bookman et al. (Reference Bookman, Lazar, Stein and Burr2007).
SAMPLES AND METHODS
Materials and Analytical Methods
Samples of aragonite, gypsum and organic debris were collected from exposures of the Holocene Ze’elim Formation (Fm.) and from “gypsum structures” at the shores of the Ein Qedem saline springs and at the Tmarim and Zuqim shores (Figures 1 and 2). The samples are listed and described in Tables 1 and 2.
Aragonite samples were collected from five columnar sections of the Ze’elim Fm. (Figure 2c) at the Qedem shore (Figure 1). Two hundred milligrams of physically separated aragonite material were washed 3 times in distilled water to remove soluble salts. The samples were dried under 60°C and were transformed to a preparatory line for extraction of CO2 in the radiocarbon facility at the University of Arizona. The samples were dissolved in H3PO4 (70%) and the released CO2 was collected and graphitized. Radiocarbon was measured at the Accelerator Mass Spectrometry (AMS) facility at the University of Arizona.
Bulk gypsum samples were collected from the “Gypsum cliff” and the “Gypsum structures” along the Qedem shore (five samples), the Tmarim shore (two samples) and the Zuqim shore (one sample) (Table 2, locations are marked in Figure 1 and Figure 2 a,b). The bulk rock “gypsum” samples contain variable amounts of carbonate material (calcite and aragonite) which was used for the radiocarbon analysis. The bulk rock gypsum was ground to powder and the relative amounts of the major mineral phases: gypsum, aragonite and calcite were determined by XRD. The carbonate content was also measured by a “Carbonate Bomb” (computerized and modified version of the “Karbonat-Bombe” of Müller and Gastner, Reference Müller and Gastner1971). Then, targeting to have 3 mg of C, bulk powder was weighted and reacted overnight with H3PO4 that released the CO2 gas directly into a gas accepting ion source connected to the continuous-flow AMS system at the National Ocean Sciences AMS (NOSAMS) facility, Woods Hole (Roberts et al. Reference Roberts, Beaupré and Burton2013). Note that the radiocarbon analyses on the extracted aragonite are less precise than the other radiocarbon analyses (Table 2). This is because they were determined on the NOSAMS gas ion source, which requires rather large carbon content, as compared to the Cs sputtered graphite targets (all other measurements). The gas ion source was utilized because it allowed rapid and inexpensive reconnaissance measurements on a large number of gypsum-carbonate mixtures. Due to the complexity of the existence of aragonite and calcite in these mixtures, these larger uncertainties do not compromise the conclusions (see below).
Organic debris were collected from the same stratigraphic units as the aragonite and gypsum samples. The organic matter comprises small pieces of wood, visible to the naked eye (several cm long), carefully removed by tweezers from the outcrop in the field. The source of these organic debris is from spring vegetation around the lake or vegetation residues that were transported by floodwater from the lakeʼs watershed. The organic debris were prepared for graphitization. Radiocarbon analyses were conducted at the AMS facilities at the University of Arizona (22 samples), Australian Nuclear Science and Technology Organisation (ANSTO) (3 samples), NOSAMS (3 samples) and Poznan Radiocarbon Laboratory, Poland (2 samples). The radiocarbon measurement uncertainty in all laboratories was smaller than 100 years. All the radiocarbon data were corrected for fractionation using δ13C results obtained by the various laboratories.
RESULTS
Radiocarbon measurements on aragonite laminae, or aragonite material within the bulk rock gypsum samples from the “gypsum structures” and their associated organic debris samples (taken from the same unit in the structure) are listed in Tables 1 and 2. The bulk rock gypsum samples contain 1.2–33.5 wt% carbonate (Table 2). In addition, the XRD analyses of the bulk rock gypsum samples show that in 6 of 8 samples the carbonate phase comprises a mixture of aragonite and calcite. The aragonite is a primary carbonate phase in this depositional environment while the calcite is detrital, derived from very old carbonate rocks (e.g., Haliva-Cohen et al. Reference Haliva-Cohen, Stein, Goldstein, Sandler and Starinsky2012). Together, these mineral phases are considered as the “carbonate material” that was dissolved by the phosphoric acid. Hence, the measured radiocarbon age for primary aragonite was corrected assuming the calcite fraction contains only “dead carbon” meaning that its 14C content is zero (e.g., Bookman et al. Reference Bookman, Lazar, Stein and Burr2007).
The RA of the lake is calculated according to Eq. (1). Since there is virtually no biological production in the water column of hypersaline Dead Sea, we assume that the sediment contains only detrital organic debris. These organic debris provide the “real” age of the layers (treal in the equations thereafter). treal is then used to obtain the atmospheric 14C content applying IntCal13 and to calculate radiocarbon content of the lake (the F of the aragonite at time treal). Both radiocarbon values (atmospheric and lakeʼs radiocarbon contents) are used to calculate the RA (tRA in Eq. 1) during the time of aragonite deposition. The calculated RA values lie between ~2200 yr for the young samples (~ few hundred 14C years) and ~6000 yr for the (almost) oldest (6730 14C yr) sample.
DISCUSSION
DIC and Radiocarbon Mass-Balance Calculations
The effects of various water inputs to the Dead Sea (that dictate the limnological configuration of the lake) on the RA of the lake, is formulated in the following simple mass balance equations for DIC and DI14C.
The DIC mass-balance is:
 $$\scale95%{{{{\rm{d}}{{\rm{C}}_{{\rm{DS}}}}} \over {{\rm{dt}}}} = {1 \over {{{\rm{V}}_{{\rm{DS}}}}\left( {{\rm{Z}}\left( {\rm{t}} \right)} \right)}}\cdot\left[ {{\rm{DI}}{{\rm{C}}_{{\rm{fl}}}} \cdot {{\rm{Q}}_{{\rm{fl}}}} + {\rm{DI}}{{\rm{C}}_{{\rm{sp}}}} \cdot {{\rm{Q}}_{{\rm{sp}}}} + {\rm{DI}}{{\rm{C}}_{{\rm{ss}}}} \cdot {{\rm{Q}}_{{\rm{ss}}}} + {\rm{DI}}{{\rm{C}}_{{\rm{Jo}}}} \cdot {{\rm{Q}}_{{\rm{Jo}}}}} \right] - {1 \over {{\rm{Z}}\left( {\rm{t}} \right)}}\cdot\left[ {{{\rm{R}}_{{\rm{CaC}}{{\rm{O}}_3}}} + {{\rm{E}}_{{\rm{C}}{{\rm{O}}_2}}}}} \right]$$
Where CDS is the concentration of inorganic carbon [mol·m-3] of the lake, t is time [yr]; DICi is the DIC in source/sink i [mol·m-3], the subscripts fl, sp, ss and jo denote the different water sources influx: floods, springs (fresh or brackish), saline springs and Jordan River, respectively; Qi is the flux of water source i [m3·yr–1]; VDS is the volume of the lake [m3] as a function of depth (the hypsometric curve), Z(t) [m] at any specific time, t; RCaCO3 and ECO2 are the CaCO3 precipitation rate and the net CO2 escape rate from the Dead Sea, respectively [mol·m-2·yr–1]. ECO2 is expressed by the equation:
 $${{\rm{E}}_{{\rm{C}}{{\rm{O}}_2}}} = {{\rm{k}}_{{\rm{PV}}\_{\rm{DS}}}} \cdot {\rm{K}}{{\rm{'}}_{{{\rm{H}}_{{\rm{DS}}}}}}\cdot\left( {{{\rm{P}}_{{\rm{C}}{{\rm{O}}_2}{{\rm{DS}}}}} - 400} \right) \cdot {10^{ - 6}}$$
Where kPV_DS is the operational piston velocity of CO2 in the Dead Sea [m·yr–1], K′HDS is the Henry constant for Dead Sea brine [mol·m-3·atm–1]; PCO2DS is the partial pressure of CO2 in the Dead Sea [μatm] and the numbers 400 and 10-6 are the present day partial pressure of atmospheric CO2 [μatm] and the unit conversion factor from μatm to atm, respectively. We examined the sensitivity of the model to modern PCO2 atmospheric changes for the model that represents the past 40 years (increase by ~75 μatm at Mauna Loa observatory) and found that the model is not sensitive to these changes and therefore uses a fixed, one significant digit figure.
The radiocarbon mass balance equation has similar form to that of Eq. (2), but each member contains a product of a particular source/sink DIC and its radiocarbon fraction (of modern atmospheric CO2), F [fMC]:
 $$\scale96%{{{\rm{d}}({{\rm{C}}_{{\rm{DS}}}} \cdot {{\rm{F}}_{{\rm{DS}}}})} \over {{\rm{dt}}}} = {1 \over {{{\rm{V}}_{{\rm{DS}}}}\left( {{\rm{Z}}\left( {\rm{t}} \right)} \right)}}\cdot\left[\scale96% {{\rm{DI}}{{\rm{C}}_{{\rm{fl}}}} \cdot {{\rm{Q}}_{{\rm{fl}}}} \cdot {{\rm{F}}_{{\rm{fl}}}} + {\rm{DI}}{{\rm{C}}_{{\rm{sp}}}} \cdot {{\rm{Q}}_{{\rm{sp}}}} \cdot {{\rm{F}}_{{\rm{sp}}}} + {\rm{DI}}{{\rm{C}}_{{\rm{ss}}}} \cdot {{\rm{Q}}_{{\rm{ss}}}} \cdot {{\rm{F}}_{{\rm{ss}}}} + {\rm{DI}}{{\rm{C}}_{{\rm{Jo}}}} \cdot {{\rm{Q}}_{{\rm{Jo}}}} \cdot {{\rm{F}}_{{\rm{jo}}}}} \right] - \scale96%{1 \over {{\rm{Z}}\left( {\rm{t}} \right)}}\cdot\left[ {{{\rm{R}}_{{\rm{CaC}}{{\rm{O}}_3}}} \cdot {{\rm{F}}_{{\rm{DS}}}} + {{\rm{k}}_{{\rm{P}}{{\rm{V}}_{{\rm{DS}}}}}} \cdot {{\rm{k}}_{{{\rm{H}}_{{\rm{DS}}}}}}\left( {{{\rm{P}}_{{\rm{C}}{{\rm{O}}_2}{{\rm{DS}}}}} \cdot {{\rm{F}}_{{\rm{DS}}}} - 400 \cdot {{\rm{F}}_{{\rm{atm}}}}} \right) \cdot {{10}^{ - 6}}} \right]$$
Where the subscripts for all variables are the same as for Eq. (2) and Eq. (3). Note that radiocarbon decay was not included in Eq. (4), since the radiocarbon fluxes associated with all sources/sinks are much larger than the 14C decay flux (rate). Using the multiplication rule we separate the Dead Sea radiocarbon time derivative,  ${{{\rm{d}}{{\rm{F}}_{{\rm{DS}}}}} \over {{\rm{dt}}}}$, from the left side of Eq. (4)
 $({{{\rm{d}}({{\rm{C}}_{{\rm{DS}}}} \cdot {{\rm{F}}_{{\rm{DS}}}})} \over {{\rm{dt}}}})$ as follows:
 $${{{\rm{d}}{{\rm{F}}_{{\rm{DS}}}}} \over {{\rm{dt}}}} = {{{{{\rm{d}}({{\rm{C}}_{{\rm{DS}}}} \cdot {{\rm{F}}_{{\rm{DS}}}})} \over {{\rm{dt}}}} - {{{\rm{d}}{{\rm{C}}_{{\rm{DS}}}}} \over {{\rm{dt}}}} \cdot {{\rm{F}}_{{\rm{DS}}}}\left( {\rm{t}} \right)} \over {{{\rm{C}}_{{\rm{DS}}}}\left( {\rm{t}} \right)}}$$
The F of lakeʼs epilimnion at the time of the aragonite deposition, FRA, is calculated from the RA and the F of atmospheric 14C for that time according to IntCal13 (Fatm,t, Reimer et al. Reference Reimer, Bard, Bayliss, Beck, Blackwell, Bronk Ramsey, Buck, Cheng, Edwards and Friedrich2013) by rewriting Eq. (1):
 $$\ln \left( {{{\rm{F}}_{{\rm{RA}}}}} \right) = \ln \left( {{{\rm{F}}_{{\rm{atm}},{\rm{t}}}}} \right) - {{\lambda }} \cdot {{\rm{t}}_{{\rm{RA}}}}$$
The equations presented in this section were used for calculating all parameters present in the following sections.
The Effect of Various Influxes and Lakeʼs Level Changes on the RA of the Lake
Temporal variations in RA of Lake Lisan and the Dead Sea were attributed to hydrologic-limnologic conditions, particularly to the relative contributions of freshwater and Ca-chloride brine (Schramm et al. Reference Schramm, Stein and Goldstein2000; Stein et al. Reference Stein, Migowski, Bookman and Lazar2004, Reference Stein, Lazar and Goldstein2013; Belmaker et al. Reference Belmaker, Stein, Yechieli and Lazar2007). Being a terminal lake, the Dead Sea surface level is sensitive to changes in the regional hydrological regime (Bartov et al. Reference Bartov, Stein, Enzel, Agnon and Reches2002, Reference Bartov, Goldstein, Stein and Enzel2003; Bookman et al. Reference Bookman, Enzel, Agnon and Stein2004; Migowski et al. Reference Migowski, Stein, Prasad, Negendank and Agnon2006; Torfstein et al. Reference Torfstein, Goldstein, Stein and Enzel2013). During periods of low lake stands the enhanced discharge of the saline springs contributed waters with very low 14C to the lake, while during long periods of high stand, a layered limnologic configuration was developed and the 14C in the “isolated” hypolimnion may have partially decayed (Stein et al. Reference Stein, Migowski, Bookman and Lazar2004). According to the carbon mass balance models (Eqs. 2, 4) the variation in the RA of the lake depends directly on the product of water influx and the DIC concentration in this flux (the DIC “load”). This means that two environmental factors determine the RA in the lake: (1) The hydrological conditions that dictate the amount of waters (fresh or saline) entering the lake; and (2) The climate conditions in the lakeʼs watershed that dictate the amount of dissolved carbon in the influx source (e.g. the availability of calcite grains of dust origin that comprise the watershed surface cover, such as mountain soils, that are readily dissolved in the runoff water and make up the DIC of the influx).
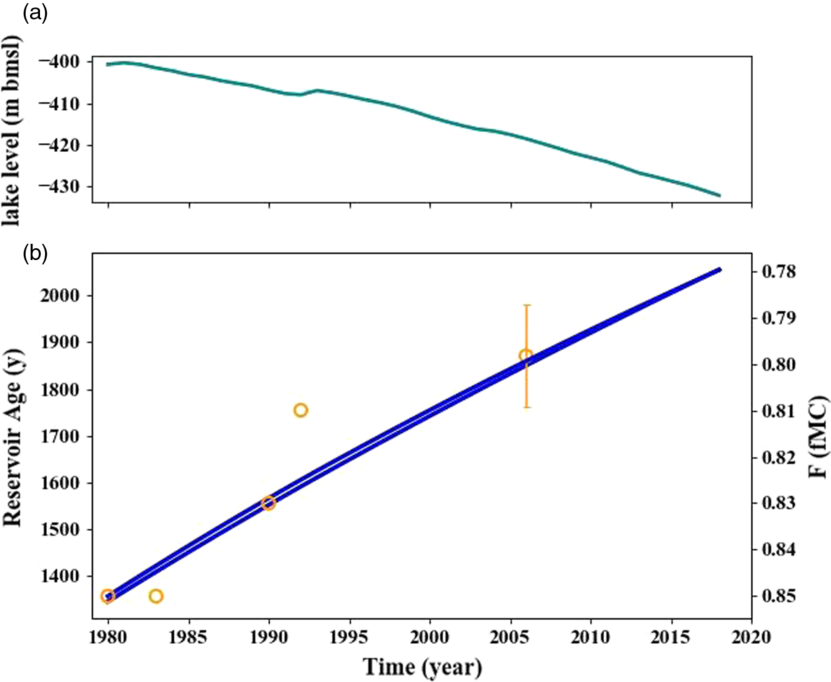
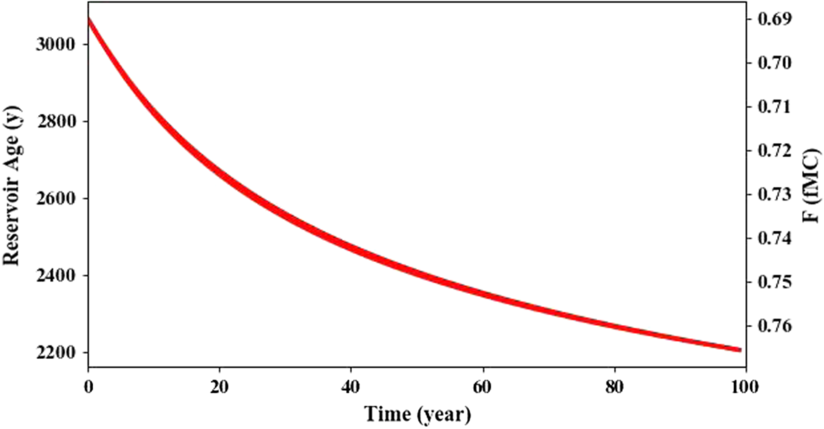
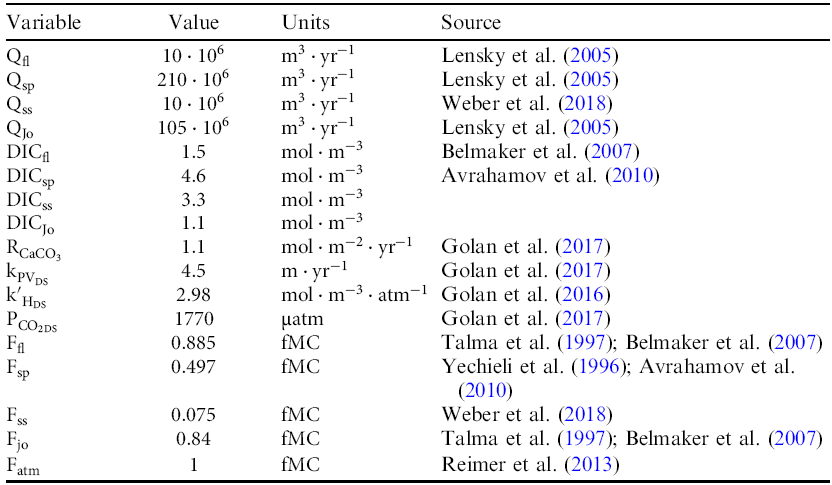
The sensitivity of RA to environmental conditions was tested for two different scenarios of lake level change by running the mass balance model for carbon-radiocarbon as formulated by the equations in the section above. The first scenario was an attempt to reconstruct the RA during the last several decades of continuous lake level decline (Figure 3a) and low freshwater input as a result of anthropogenic manipulations. The radiocarbon content of the lake during this period was measured several times, allowing to calculate RA and testing the applicability of our mass-balance model (Figure 3b). The second scenario is a hypothetical case of rising lake level over a period of 100 yr at a rate of 10 cm·yr–1, resulting from an increase in Jordan River inflow (Figure 4). The input parameters used for calculating these two scenarios using the carbon-radiocarbon models are listed in Table 3. The changes in the volume and the surface area of the lake were calculated by the hypsometric curves of Hall (Reference Hall, Niemi, Ben-Avraham and Gat1997).
(a) Dead Sea level between the years 1980 and 2019, showing a decline from 400 to 432 m bmsl (Hydrological Service of Israel); (b) Reservoir age and 14C fraction of the modern Dead Sea (F) during that time period (open circles) and model result as estimated from the DIC and 14C mass-balance model (blue lines). Note that the right y-axis (F values) is reversed. The error bar for year 2006 represents an average of six values (data from Belmaker et al. Reference Belmaker, Stein, Yechieli and Lazar2007; Talma et al. Reference Talma, Vogel, Stiller, Niemi, Ben-Avraham and Gat1997; Yechieli et al. Reference Yechieli, Ronen and Kaufman1996).

Reservoir age and the fraction of 14C (F) in the lake in response to linear ascending lake level at a rate of 0.1 m·yr–1 during 100 yr as calculated using the DIC and 14C mass-balance model presented above. Note that the right y-axis (F) is reversed.

Carbon, radiocarbon and water flow parameters (reported values presented up to 3 significant digits) used in the mass balance model*.

* The absolute values in this table are approximations for the purpose of running the model. These values are based on estimates from the quoted studies, some of which show ranges of values, which were not taken into account here.
The modern lake level drop (Figure 3): During the last 50 years, the water level of the Dead Sea declined continuously (Figure 3a) as a result of anthropogenic intervention, mainly due to freshwater diversion and brine evaporation by potash industries. The recent level drop rate exceeds 1 m·yr–1, reaching 434.2 m bmsl in January 2020 (Israel Water Authority). In 1979 the water column of the Dead Sea overturned, ending a period of about 300 years of lakeʼs stratification (Steinhorn et al. Reference Steinhorn, Assaf, Gat, Nishry, Nissenbaum, Stiller, Beyth, Neev, Garber and Friedman1979; Stiller and Chung, Reference Stiller and Chung1984). Before the overturn, the epilimnion was characterized by higher radiocarbon content than the hypolimnion (0.78 fMC and 0.72 fMC, respectively, Neev and Emery, Reference Neev and Emery1967). After the overturn, the lake was characterized by high radiocarbon of 0.85 fMC (Talma et al. Reference Talma, Vogel, Stiller, Niemi, Ben-Avraham and Gat1997). This increase in the Dead Sea 14C might be due to the time gap between the sampling before and after the overturn and expresses mainly the effect of “bomb” 14C, entering the Dead Sea via freshwater runoff between 1960 to 1976 before the overturn (Talma et al. Reference Talma, Vogel, Stiller, Niemi, Ben-Avraham and Gat1997). In the model, we used the documented data for the time interval 1980 to present, the time after the 1979 lakeʼs overturn. We assume that during this period, several geochemical-limnologic parameters remained unchanged: runoff flow rate, partial pressure of dissolved CO2 in the lake, CaCO3 calcification rate, the operative piston velocity and the Henry constant. The model shows that during this period, the reservoir age of the Dead Sea increases monotonously by 700 yr, from 1350 yr to 2050 yr, and 14C content dropped from 0.85 fMC (the value of 1980, after the overturn, Talma et al. Reference Talma, Vogel, Stiller, Niemi, Ben-Avraham and Gat1997) to 0.78 fMC (Figure 3b). These trends fit rather well the documented 14C data for the lake (Figure 3b), demonstrating the feasibility of this simple model for reconstructions of the 14C content of the lake.
Hypothetical case of ascending lake level (Figure 4): This scenario assumes linearly ascending lake level at a rate of 0.1 m·yr–1 during 100 yr (e.g., from 400 to 390 m bmsl), e.g. due to increased inflow of the Jordan River. The Jordan River flow corresponding to this ascending level rate was estimated from modeled relationship between the total yearly freshwater inflow to the Dead Sea, the annual precipitation rate and the corresponding lake level change (using the model of Morin et al. Reference Morin, Ryb, Gavrieli and Enzel2018). Here we arbitrarily started with RA of 3000 yr (a reasonable value estimated for historical lake level rise, Stein et al. Reference Stein, Migowski, Bookman and Lazar2004) and calculated the change in RA over 100 yr (Figure 4). In the calculation, we assumed that the partial pressure of dissolved CO2 in the lake and CaCO3 precipitation rate were dependent on the amount of DIC in the lake; and that during that period, thermodynamic constants did not vary. The simulation of the mass-balance model shows that the response to lake level rise is a decrease in RA by ~1000 yr and an increase in F by 0.08 fMC (Figure 4).
Radiocarbon Reservoir Age (RA) and the Age of Primary Aragonite
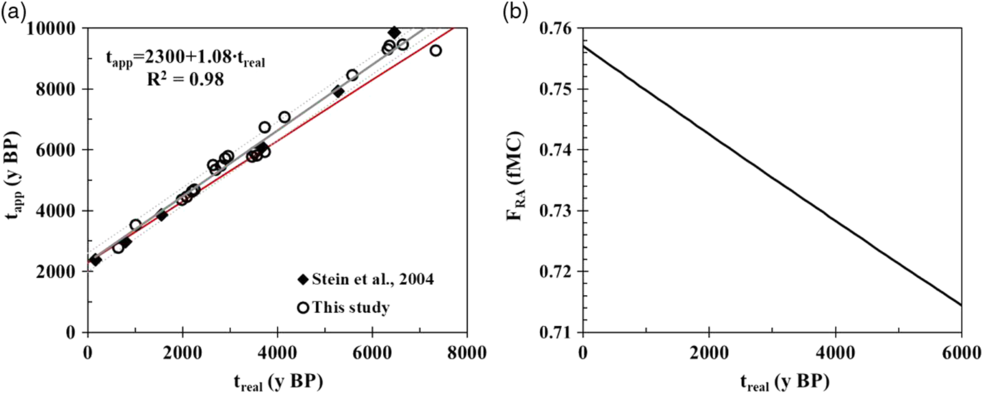
A plot of radiocarbon ages of the primary aragonites from the late Holocene section as a function of the radiocarbon ages of organic debris from the same stratigraphic unit shows a very good linear correlation (R2=0.98, Figure 5a). The linear correlation suggests that during that period, lakeʼs RA remained rather stable (the intercept of the linear fit in Figure 5a), since large variations in RA would produce large deviations from a linear behavior. The stable RA in turn, is consistent with stable hydro-climate conditions in the lake watershed, namely that the supply of freshwater and brines was quite uniform. The good linear correlation between the radiocarbon ages of aragonites and organic debris provides a way to correct the apparent aragonite ages in section of the late Holocene Ze’elim Fm. where organic debris are not found (see below).
(a) tapp (the 14C age of aragonite sediments) versus treal (14C age of organic matter from the same sample) at various locations in Holocene sections from the Dead Sea shore (data from Table 1). The gray line is the linear regression of the data (Eq. 8), the dashed lines are the borders of mean squared error of the points in relation to the regression line (±300 yr) and the red line is a linear line with slope 1 with the same intercept as in Eq. (8) (2300 yr); (b) plot of Eq. (11) showing that for the time interval of 6000 yr, the exponential decrease of FRA with time is in fact undistinguished from linear (see text).

Another noteworthy observation is that the correlation line between the apparent aragonite ages (tapp in Figure 5a) and the organic debris “real” ages (treal in Figure 5a) is higher by ~8% than unity (slope of 1.08, Figure 5a). The meaning of this small but distinct deviation from a unity slope is explained in the following paragraphs.
Three different ages were discussed above: (1) treal - “real” 14C age of the organic debris as measured by AMS from the same horizon as the aragonite; (2) tRA - the reservoir age (RA) at the time of aragonite precipitation; and (3) tapp - “apparent” 14C age of the aragonite as calculated from its measured 14C content.
If for the time interval under discussion (the last 6 kyr) the reservoir age (tRA) is constant, then the apparent age (tapp) as a function of the “real” age (treal) should define a linear trend with slope a1 = 1 and intercept a0 = tRA:
 $${{\rm{t}}_{{\rm{app}}}} = {{\rm{t}}_{{\rm{RA}}}} + {{\rm{t}}_{{\rm{real}}}}$$
However, the best fit for the tapp vs. treal line during the last 6 kyr (Figure 5a) is actually:
 $${{\rm{t}}_{{\rm{app}}}} = 2300 + 1.08 \cdot {{\rm{t}}_{{\rm{real}}}}$$
This means that in Eq. (8), a0 = tRA = 2300 yr and a1 = 1.08, suggesting that tRA (and hence also FRA as defined in Eq. 1) is not constant, but rather increases linearly with time, during the last 6 ky, as shown by rewriting Eq. (8) to the form:
 $${{\rm{t}}_{{\rm{app}}}} = {{\rm{t}}_{{\rm{RA}},0}} + 0.08 \cdot {{\rm{t}}_{{\rm{real}}}} + {{\rm{t}}_{{\rm{real}}}}$$
tRA,0 in Eq. (9) is tRA=2300 yr (Eq. 8), which represents the average present-day reservoir age (at time zero). The reservoir age increases linearly with age (with a slope of 1.08–1=0.08) according to the equation:
 $${{\rm{t}}_{{\rm{RA}}}} = {{\rm{t}}_{{\rm{RA}},0}} + 0.08 \cdot {{\rm{t}}_{{\rm{real}}}}$$
This implies that the reservoir age, tRA, decreased with time: it was ~2780 yr at 6 ka and is ~2300 yr at present.
Substituting Eq. (10) into the exponential form of Eq. 1 yields:
 $${{\rm{F}}_{{\rm{RA}}}} = {{\rm{F}}_{{\rm{atm}}}} \cdot {{\rm{e}}^{ - {{\lambda }} \cdot \left( {{{\rm{t}}_{{\rm{RA}},0}} + 0.08 \cdot {{\rm{t}}_{{\rm{real}}}}} \right)}}$$
Eq. (11) shows that the F of the Dead Sea (FRA) increased exponentially (with respect to the F of the present atmosphere) over the past ~6 kyr. However, in reality, at that time period, FRA behaves nearly linearly with time (Figure 5b). Indeed, an expansion of Eq. (11) shows a linear behavior of the form (see details in Appendix 1):
 $${{\rm{F}}_{{\rm{RA}}}} = {{\rm{e}}^{ - {{\lambda }} \cdot {{\rm{t}}_{{\rm{RA}},0}}}} - {{\rm{e}}^{ - {{\lambda }} \cdot {{\rm{t}}_{{\rm{RA}},0}}}} \cdot {{\lambda }} \cdot 0.08 \cdot {{\rm{t}}_{{\rm{real}}}}$$
Eq. (12) shows that FRA is a linear function of time with intercept of:  ${{\rm{F}}_{{\rm{RA}},0}} = {{\rm{e}}^{ - {{\lambda }} \cdot {{\rm{t}}_{{\rm{RA}},0}}}}$ and a slope of:
 $ - {{\rm{e}}^{ - {{\lambda }} \cdot {{\rm{t}}_{{\rm{RA}},0}}}} \cdot {{\lambda }} \cdot 0.08$. The linear Eq. (12) reproduces extremely well the FRA values obtained from Eq. (8) up to treal = 3000 yr and yields a slightly lower FRA value at treal=6000 yr. The small linear increase in FRA (the slope of Eq. 12) over the last 6 kyr is further elaborated in the next section, which discusses the secular trend in reservoir ages of the Holocene Dead Sea and its hydro-geological meaning.
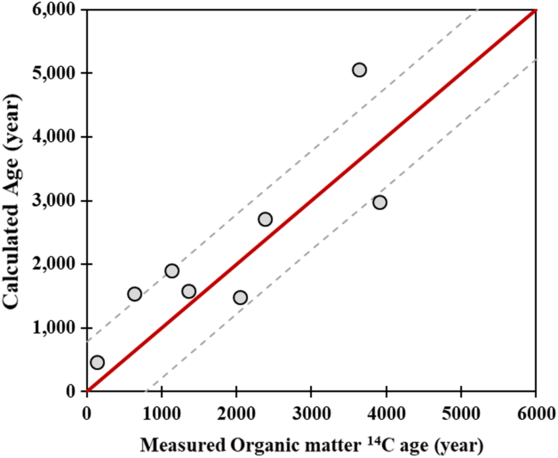
The good linear correlation between tapp and treal (Figure 5a) provides a possibility to apply Eq. (8) for calculating “real” ages of various authigenic (evaporite) deposits on the shores of the mid Holocene Dead Sea that are deficient of organic debris. The applicability of this dating method is demonstrated by the rather good correlation with an uncertainty of ~ ±800 yr between 14C ages of aragonite “embedded” within the bulk gypsum that were calculated by Eq. (8) and the 14C ages determined on organic debris from the same stratigraphic units (Figure 6). The section below discusses the hydro-geological meaning of lakeʼs FRA trend during the last several thousand years.

Reservoir Ages and Hydro-Geological Settings of the Holocene Dead Sea
RA in the last glacial (MIS2) Lake Lisan was relatively low and its F approached the atmospheric value (Schramm et al. Reference Schramm, Stein and Goldstein2000; van der Borg et al. Reference van der Borg, Stein, de Jong, Waldmann and Goldstein2004). This reflects the enhanced bicarbonate load of freshwater (the product DICtotal input·Qtotal input which is the sum of all inputs into the lake, in the mass-balance model described by Eq. 2) that equilibrated with atmospheric CO2 (Schramm et al. Reference Schramm, Stein and Goldstein2000; Belmaker et al. Reference Belmaker, Stein, Yechieli and Lazar2007; Stein et al. Reference Stein, Lazar and Goldstein2013). The high bicarbonate load in the brine during the Lisan period resulted from both, high freshwater runoff and high dust flux to the watershed that supplied fine calcite grains for dissolution (elaborated below). The transition from the late Lake Lisan to the Holocene Dead Sea was characterized by significant lake level drop, from ~200 to ~400 m bmsl, reflecting more arid conditions in the watershed and hence, reduced supply of freshwaters to the lake (e.g. Stein Reference Stein2001; Migowski et al. Reference Migowski, Stein, Prasad, Negendank and Agnon2006). The changes in the hydrologic conditions in the lakeʼs watershed was accompanied by changes in the sedimentary facies that comprise the sedimentary sequences. While the typically high stand Lake Lisan was characterized by sedimentation of annual couplets of primary aragonite and silty detritus (e.g. the so-called aad facies, Machlus et al. Reference Machlus, Enzel, Goldstein, Marco and Stein2000), the Holocene Dead Sea precipitated mainly sequences of silty detritus or “muds” (the ld facies, Haliva-Cohen et al. Reference Haliva-Cohen, Stein, Goldstein, Sandler and Starinsky2012). Nevertheless, the past 3000 yr in the history of the Dead Sea were characterized by deposition of sequences of the aad couplets or detritus, aragonite and gypsum triplets, both marking a resumed supply of freshwaters loaded with bicarbonate and sulfate to the lake (Migowski et al. Reference Migowski, Stein, Prasad, Negendank and Agnon2006; Kagan et al. Reference Kagan, Langgut, Boaretto, Neumann and Stein2015; Belmaker et al. Reference Belmaker, Lazar, Stein, Taha and Bookman2019).
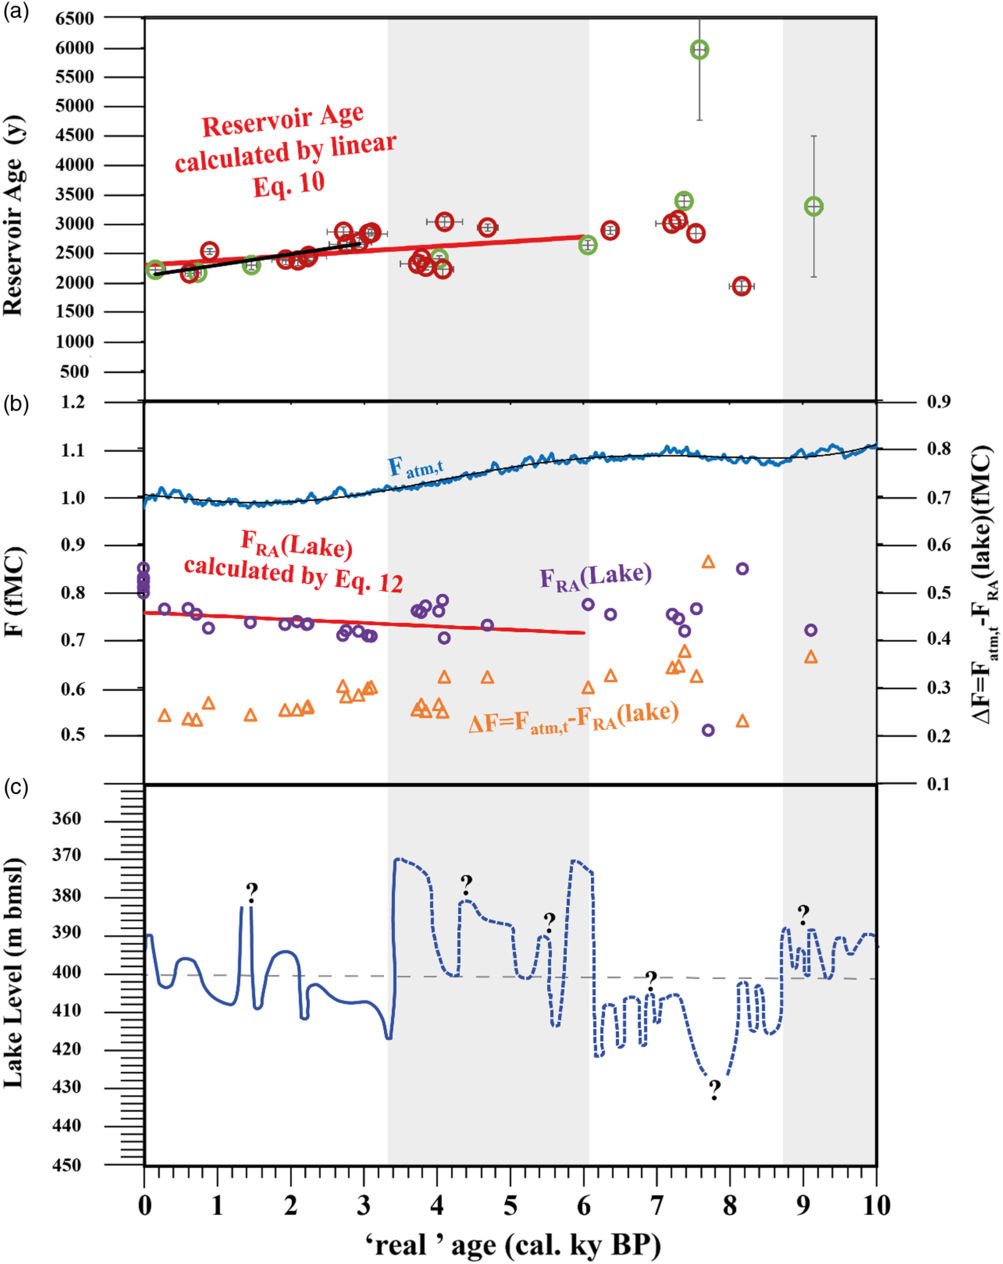
At the early Holocene (from ~10 to ~6.2 cal kyr BP) the RA (and FRA) fluctuated between 1940 and 7590 (Figures 7a, b), while the atmospheric 14C values at that time remained almost constant (Figure 7b, IntCal13, Reimer et al. Reference Reimer, Bard, Bayliss, Beck, Blackwell, Bronk Ramsey, Buck, Cheng, Edwards and Friedrich2013). A maximum RA of 6 kyr (minimum FRA) (Figures 7a, b), is recorded at ~8 cal kyr BP, when the lake receded to a minimum level of less than 420 m bmsl (Figure 7c). This extremely high RA (and low FRA) was explained by an enhanced contribution of saline waters with very low fMC (Stein et al. Reference Stein, Migowski, Bookman and Lazar2004). The outflow of saline springs waters may have been larger just after the major lake level decline than their present flow (e.g., the Ein Qedem saline hydrothermal spring system, Weber et al. Reference Weber, Yechieli, Stein, Gavrieli, Yokochi, Zappala, Mueller and Lazar2018).
Secular variations of radiocarbon related parameters in the Holocene Dead Sea. (a) Measured RA (red circles data from this study and green circles data from Stein et al. Reference Stein, Migowski, Bookman and Lazar2004), the crosses represent the propagated error calculated from 14C uncertainties on organic matter and aragonite (see footnote of Table 1), RA calculated by Eq. (10) for the last 6000 yr (red line) and the linear relation in the past 3000 yr (black line); (b) Fatm,t represents the IntCal13 of the Northern Hemisphere recalculated in fMC units (blue line, data from Reimer et al. Reference Reimer, Bard, Bayliss, Beck, Blackwell, Bronk Ramsey, Buck, Cheng, Edwards and Friedrich2013), the FRA of the lake at the time that the aragonite precipitated (purple circles) calculated from the difference between aragonite radiocarbon and the radiocarbon of organic material from the same stratigraphic horizon, the FRA calculated by Eq. (12) (red line) and ΔF, which is the difference between IntCal13 curve (Fatm,t) and FRA of the lake (orange triangles, secondary y-axis); (c) Fluctuations in lake level during the last 10 kyr (after Migowski et al. Reference Migowski, Stein, Prasad, Negendank and Agnon2006). The two gray shaded areas mark periods of lake level ≥ 400 m bmsl.

This rather “noisy” behavior of FRA (and RA) was replaced by a good linear FRA increase and RA decrease starting at ~ 6 cal kyr BP (Figures 5 and 7a, b). During the Mid-Holocene period (~6–3.6 cal kyr BP), Dead Sea levels were relatively high (Figure 7c), reaching ~380 m bmsl, with several large and fast fluctuations (Migowski et al. Reference Migowski, Stein, Prasad, Negendank and Agnon2006). These fluctuations in lake level are reflected as deviations from the linear trends in the RA and FRA (the red lines in Figures 7a, b). For example, during the sharp rise in lake level at ~4–3.6 cal kyr BP (Figure 7c), when the lake rose from ~400 to ~380 m bmsl, FRA plots above the trend line (which represents the long-term FRA increase in the lake, see discussion below), while the RA plots below the trend line. We suggest that enhanced inflow of freshwater (e.g. Jordan River and runoff from Judea Mountains), represented by the sharply ascending lake level, contributed high radiocarbon DIC to the lake, similar to the scenario shown in Figure 4.
During the past 3 ky, lake level was relatively low and showed a slow long-term level increase (by ~ 15 m) with several fluctuations (Figure 7c). The best linear fit for the plot of RA vs. treal during this period (Figure 7a, black line) has a higher slope than the slope of the trend line for the entire past 6 kyr period (Figure 7a, red line). This suggests that the effect of lake level change on the FRA of the Dead Sea during the last 3 kyr was larger than its overall (average) effect during the last 6 kyr. A plot of the difference between FRA and Fatm,t (orange triangles in Figure 7b), as a proxy for RA, shows that it decreased due to the change in the radiocarbon content of the lake and not due to variation in atmospheric radiocarbon.
We suggest that the long-term RA decrease during the past 3 kyr period reflects an enhanced supply of bicarbonate ions by freshwater runoff where radiocarbon equilibrated with the atmosphere. The enhanced bicarbonate load occurred during periods of lakeʼs low stands, stems probably from the high input of dust to the region at the end of the African wet period (Belmaker et al. Reference Belmaker, Stein, Beer, Christl, Fink and Lazar2014, Reference Belmaker, Lazar, Stein, Taha and Bookman2019; Kagan et al. Reference Kagan, Langgut, Boaretto, Neumann and Stein2015; Stein Reference Stein2014). Enhanced dust input increased the DIC (as well as calcium) in the runoff due to preferential dissolution of the fine calcite grains that make up ~30–40% of the dust transported to the regional drainage area (Belmaker et al. Reference Belmaker, Stein, Yechieli and Lazar2007; Palchan et al. Reference Palchan, Stein, Goldstein, Almogi-Labin, Tirosh and Erel2018b). The Sr isotopic composition of lakeʼs brine (both the Holocene Dead Sea and Lake Lisan) and present-day runoff support this suggestion. The 87Sr/86Sr ratios of the lakeʼs brine and runoff is ~0.7080, similar to that of the detrital calcites comprising the desert dust, but differ significantly from the 87Sr/86Sr ratios of the Cretaceous carbonates (limestone and dolomite) exposed in the watershed (Palchan et al. Reference Palchan, Erel and Stein2018a). It is likely that the availability of easily dissolved fine calcite particles, increased the bicarbonate load of the runoff (the product DICtotal input·Qtotal input, see above) by increasing its DIC, despite the rather low, but steadily increasing, flow rate (Q), which is reflected in the rise of the lake level (see Figure 7c and discussion above). In contrast to the observed long-term decrease in RA as discussed above (Figure 7a), during the last ~40 yr the Dead Sea shows a substantial RA increase by ~700 yr and FRA decrease by ~0.07 (Figure 3b). The long-term trends reversed as a result of the sharp decline in lake level (not shown in Figure 7c, but the last 38 y are shown in Figure 3a) caused by modern anthropogenic perturbations, mainly freshwater diversion and evaporite minerals production.
The RA values of the last glacial Lake Lisan show a continuous decrease during its high stand period (~30–17.4 cal kyr BP), when the lake deposited sequences of primary aragonite and silty detritus that mark supply of dissolved bicarbonate ions to the lakes (Stein et al. Reference Stein, Lazar and Goldstein2013). Both last glacial and late Holocene periods were characterized by enhanced transport of desert dust from the north Sahara deserts to the southern Levant, forming the surface cover of the Dead Sea watershed (Haliva-Cohen et al. Reference Haliva-Cohen, Stein, Goldstein, Sandler and Starinsky2012). The dissolution of the detrital calcites comprising the surface cover appears to impact the radiocarbon budget of the lake.
SUMMARY
The fraction of radiocarbon in the Dead Sea is dictated by two major sources, a “very young” DIC (dissolved inorganic carbon with high radiocarbon content) in runoff freshwater that interacted with atmospheric CO2 and “old” carbon supplied by underground brines (e.g., the saline springs of Ein Qedem). Secular variations in these radiocarbon sources during the last 6 kyr are recorded in the sedimentary sections of the Holocene Dead Sea (Ze’elim Fm.) as variations in lakeʼs reservoir age (RA). The RA of the lake is defined as the difference between the radiocarbon age of the aragonite in the section (a primary authigenic mineral) at time of its precipitation (representing lakes’ DIC) and the age of contemporaneous organic debris (representing atmospheric radiocarbon). Lakeʼs RA is determined by the regional hydrological regime, hence, secular variations in RA can be used as regional paleo-hydrological proxies.
In this study, we report on new radiocarbon data of organic debris and primary authigenic aragonite sampled from exposures of the Holocene Ze’elim Fm. along the retreating shores of the modern Dead Sea. We used these new data together with earlier radiocarbon data to reconstruct the history of radiocarbon in the Holocene Dead Sea and discuss the hydro-geological processes controlling its RA. The Holocene data are considered in light of radiocarbon content of the modern lake and are compared with previous radiocarbon data on both the Holocene Dead Sea and the last glacial Lake Lisan.
A simple mass-balance box model for DIC and radiocarbon was constructed to evaluate the effect of various inputs and outputs and lakeʼs level changes on the RA of the modern Dead Sea. The model shows that during the sharp anthropogenic lake level drop of the past 40 yr, RA of the Dead Sea increased monotonously by ~700 yr, and its 14C content decreased due to the steady shrinking in lakeʼs size. The modern sharp decreasing trend of the lake level reversed the long-term trend of the 6 kyr of gradual RA decrease (with short occasional reversals).
During the past 6 kyr, radiocarbon ages of the aragonites of the Holocene section correlate linearly with the radiocarbon ages of organic debris from the same stratigraphic unit (R2=0.98). This correlation can be used to estimate ages of primary (evaporite) deposits on the shores of the mid-Holocene Dead Sea where organic debris are not available.
The RA during this period was quite uniform and changed only by ~480 ± 300 yr, decreasing from 2890 to 2300 yr. This uniformity in the RA reflects the overall stability of the hydrological-climate conditions in the Dead Sea watershed that dictated uniform input of dissolved bicarbonate to the lake. The RA of the Dead Sea during early Holocene showed larger fluctuations between ~6 and ~3 cal kyr BP. The highest RA values are recorded in early Holocene lake at 8.5-8.1 cal kyr BP, possibly reflecting the significant decrease in the freshwater input and lake level at that time and an enhanced contribution of saline waters with very low radiocarbon content (e.g. Ein Qedem type). It appears that just after the major lake level decline, the outflow of these saline springs was larger than their present flow.
The fluctuations in RA around the linear trend mean that the overall uniform hydro-climate conditions in the late Holocene Dead Sea watershed were punctuated by short episodes of enhanced/reduced freshwater supply to the lake that were reflected by abrupt lake rises and drops.
During the past 3 kyr, the RA show a small temporal decrease from 3100 to 2200. A similar decrease (~2000 yr) was reported for the last glacial MIS2 (~30–17.4 cal kyr BP) Lake Lisan. Both decreases are explained by continuous supply of bicarbonate from the lake by freshwater runoff that dissolved detrital calcites comprising the surface cover of the lakes’ watershed.
ACKNOWLEDGMENTS
The paper is dedicated to the late Prof. Wally Broecker, who pioneered the investigation of radiocarbon in the Dead Sea lacustrine system. We thank Tim Jull and team of the NSF-BSF radiocarbon facility at Arizona. We thank the staff of the National Ocean Sciences Accelerator Mass Spectrometry (NOSAMS) facility, Woods Hole Oceanographic Institution (WHOI), Woods Hole, MA, for providing the first author (NW) a working space, helping her in the submission of a successful travel grant and in the analytical process. We wish to thank the associate editor Quan Hua, the reviewer Mariana Stiller and an additional anonymous reviewer for their fruitful and insightful comments and suggestions that helped to improve the manuscript. We thank the BSF Rahamimoff Travel Grant for Young Scientists which funded the travel expenses of NW to NOSAMS. This work was supported by the Israeli government under GSI DS project 40573, the PALEX project ”Paleohydrology and Extreme Floods from the Dead Sea ICDP Core”, funded by the DFG, Germany (Grant No. BR2208/13-1/-2 to BL and MS) and the Dead Sea Excellence Center of the Israel Science Foundation (grant 1736/11 to BL).
APPENDIX 1
Linear Expansion of Eq. (11)
Eq. (11),  ${{\rm{F}}_{{\rm{RA}}}} = {{\rm{F}}_{{\rm{atm}}}} \cdot {{\rm{e}}^{ - {{\lambda }} \cdot \left( {{{\rm{t}}_{{\rm{RA}},0}} + 0.08 \cdot {{\rm{t}}_{{\rm{real}}}}} \right)}}$, is in fact a linear equation because the value of λ·0.08·treal, the second term in the exponent of Eq. (11), is very close to zero for treal of several thousand years (the time interval discussed here). Rewriting Eq. (11) yields:
 $${{\rm{F}}_{{\rm{RA}}}} = {{\rm{F}}_{{\rm{atm}},{\rm{t}}}} \cdot {{\rm{e}}^{ - {{\lambda }} \cdot {{\rm{t}}_{{\rm{RA}},0}}}} \cdot {{\rm{e}}^{ - {{\lambda }} \cdot 0.08 \cdot {{\rm{t}}_{{\rm{real}}}}}}$$
Expansion of the right-hand term in Eq. (i),  ${\rm{f}}\left( {\rm{t}} \right) = {{\rm{e}}^{ - {{\lambda }} \cdot 0.08 \cdot {{\rm{t}}_{{\rm{real}}}}}}$, by Maclaurin infinite series of a function
 ${\rm{f}}\left( {\rm{x}} \right) = \sum\nolimits_{{\rm{n}} = 0}^{{\rm{n}} = \infty } {({{{\rm{f}}{{\left( 0 \right)}^{\left( {\rm{n}} \right)}}} \over {{\rm{n}}!}} \cdot {{\rm{x}}^{\rm{n}}})} $ around the value x = 0, which for the function f(x) = e(x) (where
 ${\rm{x}} = - {{\lambda }} \cdot 0.08 \cdot {{\rm{t}}_{{\rm{real}}}}$) yields:
 $${{\rm{e}}^{\rm{x}}} = 1 + {\rm{x}} + {1 \over 2} \cdot {{\rm{x}}^2} + \cdot \cdot\cdot\cdot\cdot $$
Substituting just the linear part of Eq. (ii) (ex = 1 + x) into Eq. (i) yields a linear function of time:
 $${{\rm{F}}_{{\rm{RA}}}} = {{\rm{F}}_{{\rm{atm}},{\rm{t}}}} \cdot {{\rm{e}}^{ - {{\lambda }} \cdot {{\rm{t}}_{{\rm{RA}},0}}}} \cdot \left( {1 - {{\lambda }} \cdot 0.08 \cdot {{\rm{t}}_{{\rm{real}}}}} \right)$$
Defining Fatm = 1 (for present day) Eq. (iii) becomes Eq. (12):
 $${{\rm{F}}_{{\rm{RA}}}} = {{\rm{e}}^{ - {{\lambda }} \cdot {{\rm{t}}_{{\rm{RA}},0}}}} - {{\rm{e}}^{ - {{\lambda }} \cdot {{\rm{t}}_{{\rm{RA}},0}}}} \cdot {{\lambda }} \cdot 0.08 \cdot {{\rm{t}}_{{\rm{real}}}}$$