INTRODUCTION
Understanding how animals respond to climate variation, and the mechanisms underlying changes in species distributions, are key scientific challenges (Pennisi, Reference Pennisi2005). One of the most common ways to address these challenges is to compare geographical differences in physiological tolerance and plasticity between populations, species and communities across latitudes (see Gaston et al., Reference Gaston, Chown, Calosi, Bernado, Bilton, Clarke, Clusella-Trullas, Ghalambor, Konarzewski, Peck, Porter, Pörtner, Rezende, Schulte, Spicer, Stillman, Terblanche and van Kleunen2009 for recent review). Estimates of physiological limits can then be combined with climate envelope models to improve predictions of how patterns of biodiversity will change in the future (Helmuth, Reference Helmuth2009; Peck et al., Reference Peck, Clark, Morley, Massey and Rossetti2009). Studies have, however, highlighted the importance of comparing physiological traits at an environmental scale that is relevant to the variability of the organisms experienced microhabitat, otherwise there may be a poor match between species range (realized niche) and the range predicted by physiological tolerance (physiological niche, Helmuth, Reference Helmuth2002; Helmuth et al., Reference Helmuth, Harley, Halpin, O'Donnell, Hofmann and Blanchette2002; Sanchez-Fernandez et al., Reference Sanchez-Fernandez, Aragón, Bilton and Lobo2012).
Whilst many physical and biological factors are known to affect the distribution of marine ectotherms, temperature is pervasive, as it affects the rates of all biochemical reactions (Hochachka & Somero, Reference Hochachka and Somero2002). When testing temperature limits, the rate of warming markedly affects the measured temperature limit, which is set by a combination of the magnitude and duration of temperature exposure; limits are expected to be lower at slower rates of warming (Mora & Moya Reference Mora and Moya2006; Terblanche et al., Reference Terblanche, Deere, Clusella-Trullas, Jannion and Chown2007; Chown et al., Reference Chown, Jumban, Sørensen and Terblanche2009; Peck et al., Reference Peck, Clark, Morley, Massey and Rossetti2009). However, if the rate of warming is slow enough, then animals may be able to adjust their physiology to a new stable state, with this acclimation is expected to lead to an increase in temperature limits (Beneficial Acclimation Hypothesis; e.g. Leroi et al., Reference Leroi, Bennett and Lenski1994). Different life history stages may have different degrees of physiological plasticity, potentially altering their vulnerability. Acclimatory capacity may, therefore, be the component of phenotypic plasticity that confers most resistance to environmental change (Somero, Reference Somero2010; Peck et al., Reference Peck, Morley, Richard and Clark2014). Modelling relationships of species’ thermal limits at different rates of warming has recently been developed as a technique for extrapolating the results of short term laboratory experiments, run over hours to months, towards annual and decadal scales, which are more closely related to the scales over which climate is changing (Peck et al., Reference Peck, Clark, Morley, Massey and Rossetti2009; Barnes et al., Reference Barnes, Peck and Morley2010). The upper temperature limits of ectotherms are set by a combination of both the magnitude of temperature exposure and the duration of that exposure. This results in ectotherms having higher lethal limits at faster rates of warming and lower limits at slower rates. If the lethal limits of species within an assemblage are tested at different rates of warming in the laboratory, then long term limits can be estimated from the resultant relationship (Peck et al., Reference Peck, Clark, Morley, Massey and Rossetti2009). The shape of the relationship also allows assessment of the relative vulnerability of different assemblages to the rate at which climate is warming. The intercept indicates the maximum CTmax of the assemblage which is expected to be correlated with habitat temperature. A steeper relationship between CTmax and the rate of warming will indicate a reduced ability to cope with long term warming. The slope will also be shallower if species within an assemblage have the capacity to acclimate their physiology at slower rates of warming.
Assemblage level studies have shown that marine species from the Antarctic (Peck et al., Reference Peck, Clark, Morley, Massey and Rossetti2009) and coastal tropics (Nguyen et al., Reference Nguyen, Morley, Lai, Clark, Tan, Bates and Peck2011), which experience stable year round water temperatures, are more sensitive to acute elevated temperature than temperate species, which experience a wider annual range (Richard et al., Reference Richard, Morley, Thorne and Peck2012). A similar pattern was found for the ability of the same marine ectotherms to acclimate their physiology; tropical and polar species had reduced physiological capacity compared to temperate species (Peck et al., Reference Peck, Morley, Richard and Clark2014). This differs from findings for a range of terrestrial species, which are more sensitive in the tropics than temperate regions, but also have increased tolerance capacities to cope with the hugely variable air temperature range in high latitudes (Deutsch et al., Reference Deutsch, Tewksbury, Huey, Sheldon, Ghalambor, Haak and Martin2008; Tewksbury et al., Reference Tewksbury, Huey and Deutsch2008; Sunday et al., 2012).
To further test the global patterns of thermal sensitivity in shallow subtidal marine ectotherms, this study presents the first, preliminary, data on the effect of different rates of temperature change on the upper temperature limit of common shallow subtidal marine ectotherms, collected from additional tropical (the oceanic Island of Ascension), temperate (Dunedin New Zealand) and Antarctic (McMurdo Sound) locations. Methodologies were standardized so that data sets could be directly compared with published data for a coastal tropical site in Singapore (Nguyen et al., Reference Nguyen, Morley, Lai, Clark, Tan, Bates and Peck2011), temperate regions (Richard et al., Reference Richard, Morley, Thorne and Peck2012) and the Antarctic Peninsula (Peck et al., Reference Peck, Clark, Morley, Massey and Rossetti2009).
MATERIALS AND METHODS
Shallow water subtidal species were collected by divers from less than 20 m depth; four species were studied from Ascension Island, five from Dunedin, New Zealand and six from McMurdo Sound, Antarctica (Table 1). Apart from Ascension, which is tropical, all samples were collected in summer. For these trials, the size-range of each species was deliberately limited to reduce the variability in thermal limits attributable to size (e.g. Peck et al., Reference Peck, Clark, Morley, Massey and Rossetti2009). Ascension Island is an isolated volcanic Island on the Mid-Atlantic Ridge (7.89°S 14.38°W) and is subject to an annual seawater temperature range of 22–28°C (Irving, Reference Irving1989; Weber et al., Reference Weber, Blount, Godley, Witt and Broderick2011). The Island has a narrow shelf and is surrounded by deep water, which leads to a cooler and more variable sea surface temperature than many coastal tropical sites (e.g. Singapore, 27–31°C (Chou & Lee, Reference Chou and Lee1997)). Species were collected from Dunedin Harbour on the south-east coast of New Zealand (45°49.67′S 170°38.49′E) and Doubtful Sound, on the south-west Fiordland coast (45°25′S 167°6′E). Dunedin Harbour has a narrow entrance with an annual temperature range of 7.1–16.1°C (Shaw et al., Reference Shaw, Kavalieris and Vennell1999). Doubtful Sound is a narrow fjord, surrounded by mountains, and has a reduced annual temperature range, at 15 m, of 12–18°C (Goodwin & Cornelisen, Reference Goodwin and Cornelisen2012). Species were also collected from McMurdo Sound, by US Antarctic Program divers (77°51′S 166°40′E). McMurdo Sound has the coldest and one of the most stable marine temperature regimes (−1.9 to −0.5°C (Hunt et al., Reference Hunt, Hoefling and Cheng2003)). In each location specimens were transported in insulated containers to marine aquarium systems, in the nearest laboratory facility. During trials carnivores were fed to satiation twice a week on pieces of fish, whilst herbivores were fed on recently collected macroalgae, algal cultures or algae in the water column, which were replaced through daily water changes or a flow-through system in longer incubations at Portobello Marine Laboratory. Daily water exchange, with water pre-heated to the experimental temperature, also ensured water quality never deteriorated. Mortality in controls (at ambient temperature) was monitored to check for any adverse effects of culture conditions. Any species that suffered significant mortality of control animals was removed from the analysis.
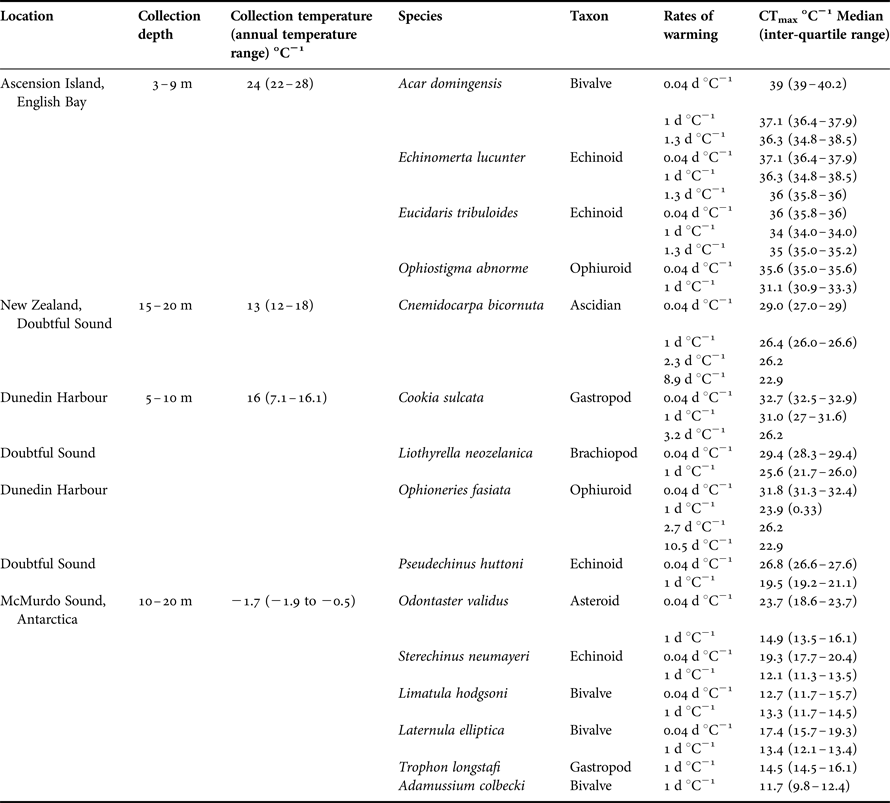
Rates of warming, species used and higher taxon in experiments on species collected from three locations; Ascension Island, Dunedin in New Zealand and McMurdo Sound, Antarctica.

In Ascension Island, specimens were transported to the Ascension Island Conservation Office where they were placed in 100 l aerated water baths with 500 W titanium heaters (Aqua Medic) controlled by a 0.1°C digital thermostat (MJA Heat trace Ltd). The species were separated, with two compatible species in each water bath, and then temperature was either kept at ambient (control 26.1 ± 0.1°C; mean ±1 standard error), or raised at one of three rates 0.04 d °C−1, 1 d °C−1 and 1.3 d °C−1 (Table 1; Supplementary Figure S1). Trials at slower rates of warming were not possible because of logistical constraints.
In New Zealand, specimens were transported to a flow-through aquarium system at the Portobello Marine Laboratory. Controls were kept at ambient aquarium temperature, 18.7 ±0.3°C (Supplementary Figure S1). Acute temperature tolerance tests were conducted in insulated jacketed tanks attached to thermocirculators (Grant Instruments, LTDG20) which were able to maintain seawater temperature to a precision of ±0.1°C. Temperatures were raised at 0.04 d °C−1 (1.0°C h−1) and 1 d °C−1 (1.0°C d−1). Longer term temperature tolerance was estimated following the methodology of Peck et al (Reference Peck, Clark, Morley, Massey and Rossetti2009). Animals used in longer term experiments were housed in insulated flow-through aquaria (~10 l). Briefly, seawater was heated in a header tank (50 l) with 50 W aquarium tank heaters and inflow was via gravity into aquaria at a rate of 60 ml min−1 (controlled by the diameter of the outflow valves). Flow of cold seawater into the header tank was maintained with a float valve so that the header pressure remained constant. Temperature was raised at 5 d °C−1 until target temperatures of 22.9 ±0.3°C and 26.2 ±0.6°C were reached. These temperatures were then maintained until more than 50% mortality had occurred. The number of days that 50% of individuals survived at elevated temperature was converted into a rate of temperature change by dividing the number of degrees that temperature was elevated by the number of days (following Peck et al., Reference Peck, Clark, Morley, Massey and Rossetti2009).
At Scott Base (Antarctica New Zealand) animals were transferred to a flow-through aquarium at ambient temperature (−1.7°C). Acute temperature tolerance tests were conducted in insulated jacketed tanks attached to thermo-circulators which were able to maintain seawater temperature to a precision of ±0.1°C. Temperatures were raised at 0.04 d °C, 0.6 d °C−1 and 1 d °C−1. Trials at slower rates of warming were not possible.
Mortality was assessed every hour in 0.04 d °C−1 experiments or two to three times a day at slower rates of temperature change (after the method of Peck et al., Reference Peck, Clark, Morley, Massey and Rossetti2009). For species that normally live attached to the substratum, e.g. starfish, sea urchins and gastropod molluscs, the first sign that competence had been compromised was when they lost their ability to remain attached. Unattached individuals were stimulated with a blunt seeker to illicit a response; non-response (loss of equilibrium) was recorded as CTmax and the size of each individual was measured. Temperature limits for individual species in the current study were not normally distributed even after transformation, and so non-parametric Mann–Whitney multiple comparisons were used with a Bonferroni corrected acceptance probability. The global comparison of temperature limits was conducted using a linear mixed effects model with species as a random factor and natural logarithm of rate of change as the covariate. The model fit and residual behaviour were visually inspected to ensure that the test assumptions were met; to normalize the residual variance the variance for each location was modelled independently using the function ‘varIdent’ and the form ~1|Location applied as a weights argument.
RESULTS
Ascension Island
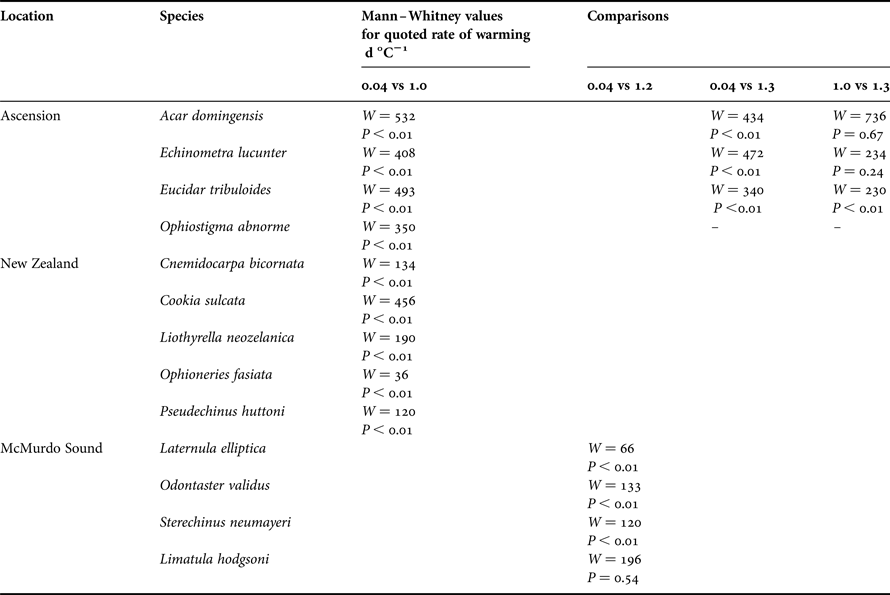
There was no mortality of control animals. All species had a significantly higher CTmax at the fastest rate of change (Tables 1, 2). At warming rates of 0.04 d °C−1 and 1 d °C−1, the bivalve, Acar domingensis was the most temperature tolerant (medians of 39.0 and 37.1°C, respectively; Tables 1, 2) and the brittlestar, O. abnorme, was the least tolerant at both these rates of change (35.6 and 31.1°C respectively; Tables 1, 2). At the slowest rate of change, 1.2 or 1.3 d °C−1, there was no difference in the temperature limits of Acar domingensis or Echinometra lucunter, but Eucidaris tribuloides had a significantly higher temperature limit at 1.3 d °C−1 than at 1.0 d °C−1.
Mann–Whitney comparison tests of thermal limits of 4 species of invertebrate at the fastest rates of temperature change.
New Zealand
After 45 d there were mortalities in controls of Pseudechinus huttoni (8 out of 12) and Liothyrella neozelanica (9 out of 13). Data from beyond 30 d were, therefore, not used for these species. Mortalities in controls of Cnemidocarpa bicornata (N = 2), Cookia sulcata (N = 1) and Ophioneries fasiata (N = 1) were low, and so mortality could be estimated from long term trials. This was with the exception of C. sulcata, which did not suffer 50% mortality during the incubation period at 22.9°C. Long term mortality could, therefore, not be estimated at 22.9°C for this species.
In all cases upper temperature CTmax was lower at 1 d °C−1 than at the fastest rate of warming, 0.04 d °C−1 (Tables 1, 2). 50% of Cnemidocarpa bicornata survived for a median of 17 and 37.5 d at 26.2°C and 22.9°C, for which calculated rates of change were 2.3 d °C−1 and 8.9 d °C−1 respectively. 50% of Cookia sulcata survived for a median of 23 d at 26.2°C which gave a rate of change of 3.2 d °C−1. 50% of Ophioneries fasiata survived for a median of 20 and 44 d at 26.2°C and 22.9°C for which calculated rates of change were 2.7 d °C−1 and 10.5 d °C−1, respectively.
McMurdo Sound
In all but Limatula hodgsoni upper temperature limits were lower at 1 d °C−1 than at the fastest rate of warming, 0.04 d °C−1 (Tables 1, 2).
Global comparisons between assemblages
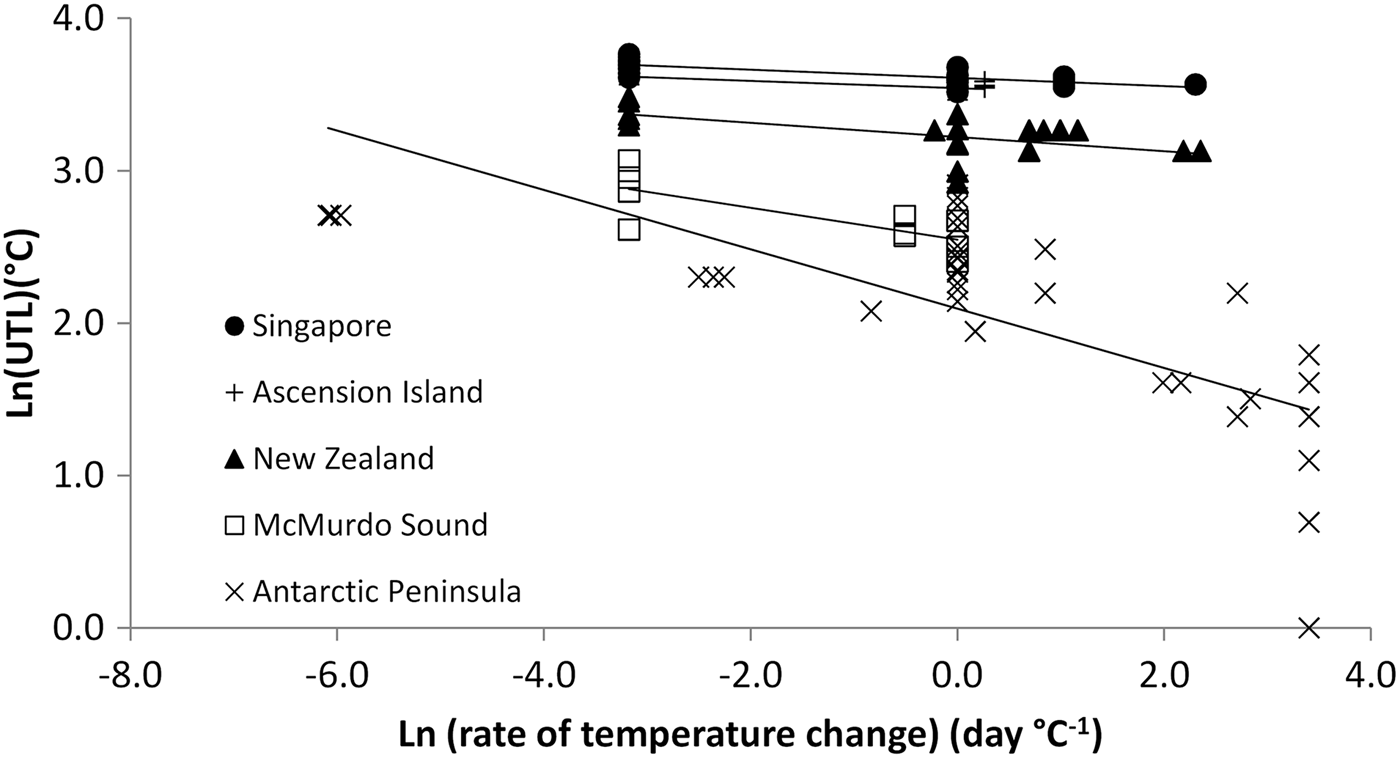
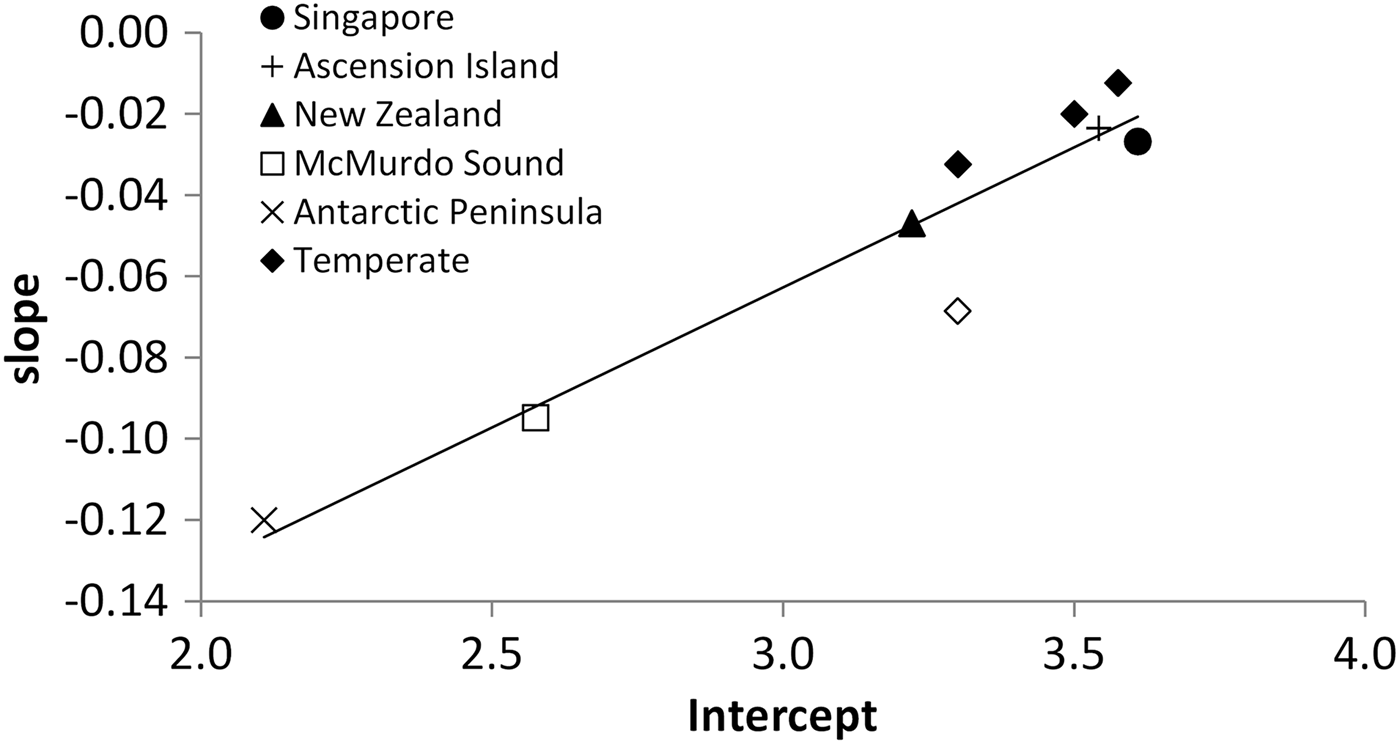
In the global comparison of CTmax, at 1 d °C−1, each assemblage had a tolerance that was positively correlated with their mean environmental temperature, except McMurdo Sound, which although a colder environment than the Western Antarctic Peninsula, had a higher tolerance than the Western Antarctic Peninsula. Singapore had a significantly higher intercept than Ascension Island (Figure 1; Table 3), and New zealand fauna were between these. Ascension Island, Singapore and New Zealand assemblages had slopes that were not significantly different. The slopes for the two Antarctic faunal assemblages were significantly steeper than the warmer-water species. There was, therefore, a strong relationship between the slope and intercept across assemblages (Figure 2). Assemblages that had higher intercepts (higher CTmax) also had shallower slopes than those from cooler environments (Figure 2).
Temperature limits of different faunal assemblages from the tropics to the Antarcic. Tropical Singapore data from Nguyen et al. (2012), Antarctic Peninsula data from Peck et al. (Reference Peck, Clark, Morley, Massey and Rossetti2009), and new data from Ascension Island, New Zealand and McMurdo Sound. Fitted lines from linear mixed effect regression fits (Table 3).
For groups of marine invertebrates from different locations, the slope of the regression between upper temperature limit and rate of warming (as in Figure 1) is plotted against the intercept. Singapore data from Nguyen et al. (2012), temperate data from Richard et al. (Reference Richard, Morley, Thorne and Peck2012) with the Peruvian upwelling fauna indicated with an open diamond, Antarctic Peninsula data from Peck et al. (Reference Peck, Clark, Morley, Massey and Rossetti2009). The regression line was fitted excluding this outlying Peruvian fauna. Slope = 0.071intercept–0.27, R 2 = 0.97, F = 252, P < 0.01.
Summary table for the linear mixed effects model estimates fitted using restricted maximum likelihood for the global relationship of upper temperature limit as a function of the predictor, the rate of temperature change, with location as a factor and species as a random factor. WAP, Western Antarctic Peninsula. Akaike information criterion = 145.8; log likelihood = 88.9; SE, standard error; d.f., degrees of freedom.
DISCUSSION
As expected, CTmax values were generally lower at slower rates of warming. The only species that had a temperature limit that was significantly higher at a slower rate of warming was the urchin Euchidaris tribuloides from Ascension Island. This is the first evidence that a shallow water Ascension Island species has the capacity to rapidly adjust its physiology. Tropical species are expected to have limited acclimatory capacity as they live in thermally stable environments, with little variation in temperature through the year (Spicer & Gaston, Reference Spicer and Gaston1999; Deutsch et al., Reference Deutsch, Tewksbury, Huey, Sheldon, Ghalambor, Haak and Martin2008; Tewksbury et al., Reference Tewksbury, Huey and Deutsch2008; Peck et al., Reference Peck, Morley, Richard and Clark2014). However, the shelf seas around Ascension Island are surrounded by deep oceanic water and so the water temperature is cooler and more variable than in coastal tropical locations. The near-shore water temperature rose gradually between September 2012 and June 2013, from 24 to 28°C (Brickle, unpublished data). If this is a predictable seasonal change in seawater temperature, then Ascension Island marine species may have evolved the plasticity to adjust their physiology in response to this variation. When warm water species have the capacity to acclimate their physiology, acclimation is expected to be rapid, occurring within a few hours to days (Spicer & Gaston, Reference Spicer and Gaston1999; Verberk & Calosi, Reference Verberk and Calosi2012; Peck et al., Reference Peck, Morley, Richard and Clark2014). In polar waters, which are also thermally stable through the year, species are similarly expected to have limited acclimatory capacity (Peck et al., Reference Peck, Morley, Richard and Clark2014). When acclimation of invertebrates does take place at the poles, it may take many months. For example, the acclimation of the Antarctic limpet, Nacella concinna, took between 2 and 5 months (Peck et al., Reference Peck, Morley, Richard and Clark2014). It is possible that longer duration experiments will find that McMurdo Sound fauna will also have limited acclimation capacity but the preliminary experiments conducted here do not allow this to be tested.
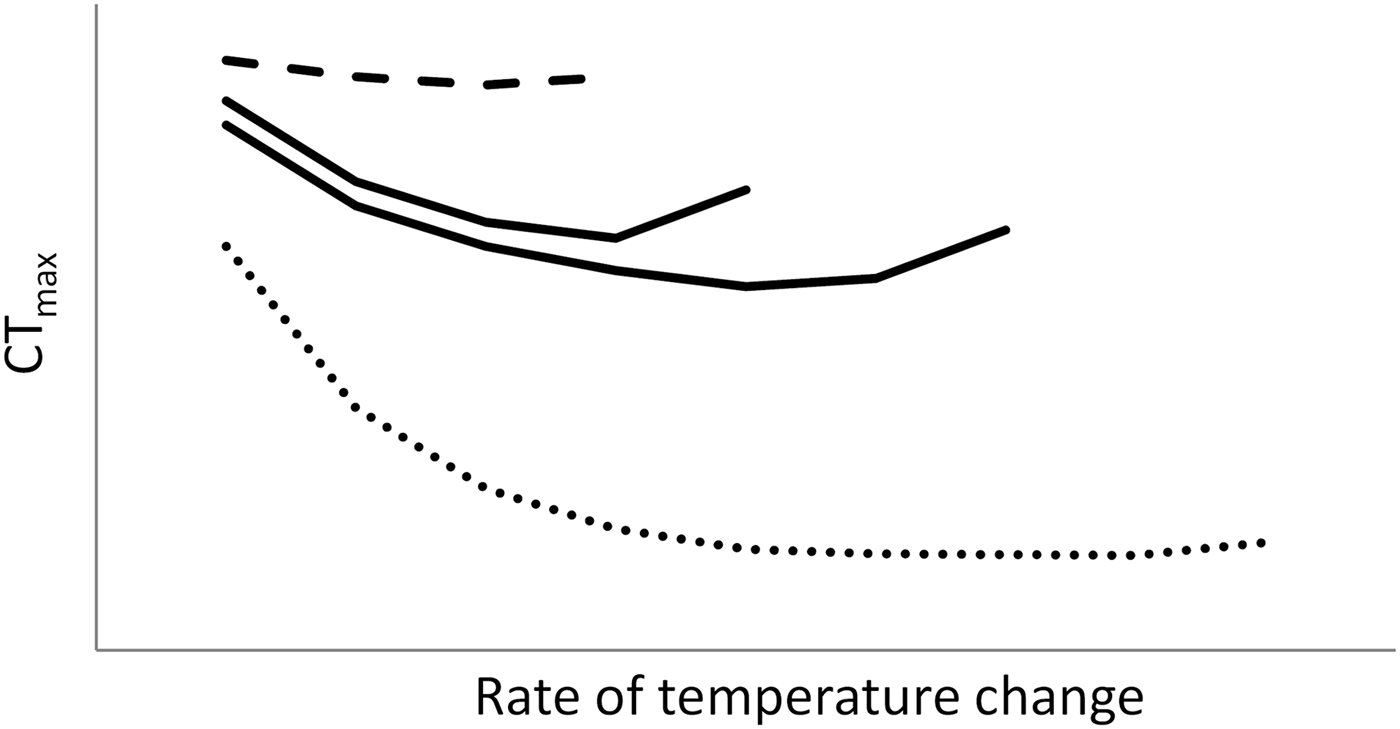
Assemblages from warmer environments had higher intercepts, indicating their higher CTmax (Deutsch et al., Reference Deutsch, Tewksbury, Huey, Sheldon, Ghalambor, Haak and Martin2008; Tewksbury et al., Reference Tewksbury, Huey and Deutsch2008; Sunday et al., Reference Sunday, Bates and Dulvy2011). The overall relationship shows that the CTmax of each assemblage was negatively correlated to the slope of the relationship between CTmax and the rate of warming; the slope was also shallower in assemblages from warmer environments (Figure 3). Tropical species are often thought to be living at temperatures close to the upper limit that can be sustained through acclimatization and, therefore, have limited ability to further adjust their temperature limits (Stillman & Somero, Reference Stillman and Somero2000; Stillman, Reference Stillman2003; Deutsch et al., Reference Deutsch, Tewksbury, Huey, Sheldon, Ghalambor, Haak and Martin2008; Richard et al., Reference Richard, Morley, Thorne and Peck2012). This is thought to result in tropical species having temperature limits that are only slightly above their experienced environmental temperatures and a rates-of-warming relationship with a reduced slope. Temperate marine assemblages, such as the New Zealand fauna tested here, generally live in cooler, but more variable environments, and their intercepts and slopes are closer to those of tropical species than polar ones. To cope with the variability of their environments they have evolved higher thermal tolerances with higher buffers above their experienced environmental maxima (Deutsch et al., Reference Deutsch, Tewksbury, Huey, Sheldon, Ghalambor, Haak and Martin2008; Tewksbury et al., Reference Tewksbury, Huey and Deutsch2008; Sunday et al., Reference Sunday, Bates and Dulvy2011). The increased acclimatory capacity of temperate species would also tend to reduce the slope of the rates-of-warming relationship closer to those of tropical rather than polar species (Figure 3). Whilst the maintenance of physiological heat tolerance is expensive and is generally expected to be lost in species from colder latitudes (Stillman & Somero, Reference Stillman and Somero2000), the reduced, and extended duration of, acclimatory capacity in polar species leads to the steeper slope of the relationship for this assemblage (Figure 3), indicating their increased sensitivity to long term elevated temperature. The compression of upper temperature limits, and therefore shallower slopes, at higher temperatures was also apparent when the slopes and intercepts of temperate species were compared between summer and winter (Richard et al., Reference Richard, Morley, Thorne and Peck2012).
Theoretical representation of the effect of the rate of warming on the lethal limits of marine ecotherms across latitudes. The dashed line represents a tropical assemblage with a shallow slope, due to rapid but limited acclimation capacity. The solid lines represent a temperate assemblage with an intermediate slope, a slower rate of acclimation, but with greater acclimation capacity. Two examples are shown with different rates of acclimation. The dotted line represents a polar assemblage with a steep slope and very slow and limited acclimation capacity.
Isolated oceanic islands are often regions of upwelling, as they have narrow shelves and are surrounded by deep water (Pinheiro et al., Reference Pinheiro, Gasparini and Joyeux2010). Rapid changes in temperature, of up to 2.5°C in less than 24 h, were recorded at Ascension Island, particularly during March and April 2013 (Brickle, unpublished data). Whilst the occurrence of upwelling events at Ascension Island may be predictable enough that faunal species have sufficiently regular cues to acclimate their physiology, the assemblage living in the Peruvian upwelling region, studied by Richard et al. (Reference Richard, Morley, Thorne and Peck2012), did not have the ability to respond to the episodic warming associated with El Niño events. When the slopes of regression fits were plotted against the intercept for each assemblage (following Richard et al., Reference Richard, Morley, Thorne and Peck2012), the relationship was consistent across assemblages, except for the Peruvian upwelling fauna. This indicates that the Peruvian faunal species have a reduced long term temperature tolerance, compared to other temperate assemblages, and are less likely to be able to adjust their thermal tolerance to cope with the warmer temperatures experienced during unpredictable El Niño warming events (Figure 1). This is supported by evidence that species experience large scale mortality during these periods. Although further data are required, the fact that Ascension Island fauna fit with the general pattern provides preliminary evidence that the annual variation in temperature at Ascension (6°C) is sufficiently variable yet predictable, that some of the marine fauna have the ability to acclimate their physiology. The Ascension experiments were conducted in August, when the water temperature was close to its annual minimum of 22°C. If Ascension Island invertebrates can acclimatize their physiology in response to seasonal changes in temperature, they might be expected to have higher temperature limits when water is at its annual maximum (28°C). Experiments testing more species, and at different times of year, are required to confirm the presence of seasonal plasticity. Comparisons of thermal tolerance across environments are often, out of necessity, conducted in different years and whilst temperate and polar experiments were conducted in summer, there can be inter-annual differences in thermal limits (e.g. Morley et al., Reference Morley, Martin, Bates, Clark, Ericson, Lamare and Peck2012). Assessing long term thermal limits through projections based on different rates of warming are likely to reduce the impact of differences between years and give a better assessment of the differences between assemblages.
The relationship between CTmax and the rate at which temperature is increased measures a combination of acute thermal tolerance and acclimatory capacity. These relationships between CTmax and the rate of warming help explain why tropical species, which are already living close to their upper limits, have limited capacity for acclimation to warmer temperatures (Stillman & Somero, Reference Stillman and Somero2000; Stillman, Reference Stillman2003), whilst temperate latitude freshwater beetles with higher CTmax’s had higher acclimation capacity (Calosi et al., Reference Calosi, Bilton and Spicer2008). The global relationship between these parameters is consistent across assemblages allowing long term thermal sensitivities to be predicted for other assemblages. This pattern, however, only holds in environments where predictable temporal cues have lead to the development of the ability to respond to environmental variability.
ACKNOWLEDGEMENTS
Bev Dickson and the staff at both Portobello and Doubtful Sound provided vital technical support in New Zealand. Jess Ericson, Tom and Linnaea Bird helped maintain the long term incubations in Portobello Marine Laboratory. The United States Antarctic Program divers, under the leadership of Rob Robbins, collected specimens at McMurdo. We are grateful to the Shallow Marine Surveys Group and the South Atlantic Environmental Research Institute for organizing the expedition. We are also very grateful to the Ascension Island Government, the members of staff at the Conservation Centre and Ascension Island Dive Club for their cooperation, accommodation and hospitality.
FINANCIAL SUPPORT
This research was funded by NERC British Antarctic Survey Polar Science for Planet Earth funding (Adaptations and Physiology work package), the University of Otago Research Committee, Antarctica New Zealand (event no. K-068), the TransAntarctic Association (TAA05/08). A.E.B. was funded by a Natural Science and Engineering Research Council of Canada post-doctoral fellowship. The funding for work in Ascension came from a grant to Dr Paul Brickle from the Darwin Initiative (EIDCF012).
SUPPLEMENTARY MATERIALS AND METHODS
The supplementary material referred to in this article can be found online at journals.cambridge.org/mbi.