1. Introduction
Four related markets have been resilient during the COVID-19 pandemic: pension risk transfer, longevity risk transfer, funded reinsurance, and life reinsurance capital raising, which today is often occurring through sidecars [see, e.g., Blake (Reference Blake2018), Blake et al. (Reference Blake, Cairns, Dowd and Kessler2019, section 12.3)]. These markets all have one thing in common—longevity and mortality exposure. And everything about these markets is resilient, including supply, demand, price, capital, people, technology, and market confidence.
In February and March of 2020, just at the beginning of the COVID-19 crisis, several large pension funds began asking the question, “Why would I transfer longevity risk during a pandemic?” And, despite that early skepticism, these markets haven't skipped a beat. Instead, they've been incredibly vibrant.
In our opinion, the market prevailed because of key research, published in May 2020, showing that pensioner life expectancy would not be materially impacted by the pandemic [Cairns et al. (Reference Cairns, Blake, Kessler and Kessler2020)]. In fact, life expectancy for the surviving elderly and projections of pension liabilities have changed only very modestly because of COVID-19. We feel this finding was the foundation for the market's resilience because it enabled market participants to price and transact confidently throughout the crisis.
The paper is organized as follows. Section 2 looks at recent developments in the pension risk transfer and longevity risk transfer markets. Section 3 examines the new funded reinsurance market. Section 4 considers capital raising and the role of sidecars in life reinsurance. Section 5 concludes.
2. Pension risk transfer and longevity risk transfer
Let us look first at the pension risk transfer and longevity risk transfer markets, in which pension funds transfer some, or all, of their risk to insurers and reinsurers. Pension and longevity risk transfer is now growing steadily, with more than $620 billion in transactions having been completed in the US, UK, and Canada alone. In the United States, $199 billion of transactions have been executed and the vast majority are pension buy-outs (Figure 1).
Cumulative pension risk transfer transactions by country and product (in USD). Sources: LIMRA, Hymans Robertson, LCP, and Prudential Financial, Inc. (PFI) analysis at year-end 2020.

2.1 Cumulative pension risk transfer transactions by country and product
In the UK, there have been $236 billion of pension buy-outs and buy-ins, and $156 billion of pension longevity swaps. The UK is the size of California but has almost double the transaction volume as the entire United States. The UK also boasts a much more diverse set of transactions, with buy-outs, buy-ins, and longevity swaps all readily available to pension schemes to allow transactions to be customized. In Canada, there has been $31 billion in transactions, and this market continues to grow steadily—but compared with the size and depth of the US and UK, it continues to lag.
Why is the global pension risk transfer market growing so quickly? We believe it's because we are in a time of transformation designed to navigate away from risk. As McKinsey pointed out, “In industry after industry, scenarios that once appeared improbable are becoming all too real, prompting boards and CEOs … to embrace the T-word: transformation.”Footnote 1
And Deloitte concurred: “In a world of unprecedented disruption and market turbulence, transformation today revolves around the need to generate new value—to unlock new opportunities, to drive new growth, to deliver new efficiencies.”Footnote 2
No matter the industry, company after company is announcing that they are in transformation. Between climate change and increased volatility in markets, scenarios that were once improbable are not only all too real but happening all too often. And it's prompting boards and CEOs to embrace this idea of transformation, and transformation that is designed specifically to unlock new value, improve growth and efficiency, and significantly reduce downside risk.
Consequently, many companies are leveraging pension de-risking as a material part of their transformation away from risk. Pension risk transfer can:
• Decrease or eliminate future pension contributions and eliminate the risk of cash calls from the pension fund when rates or assets fall.
• Redirect cash flow to research and development or mergers and acquisitions, and increase focus on restructuring initiatives, whether launching new growth opportunities or shedding businesses that underperform.
• Improve investor returns—especially compared with pension-heavy peers.
• Secure the pensions and financial wellness of employees and retirees by insuring their pensions.
2.2 US pension plan funded status volatility
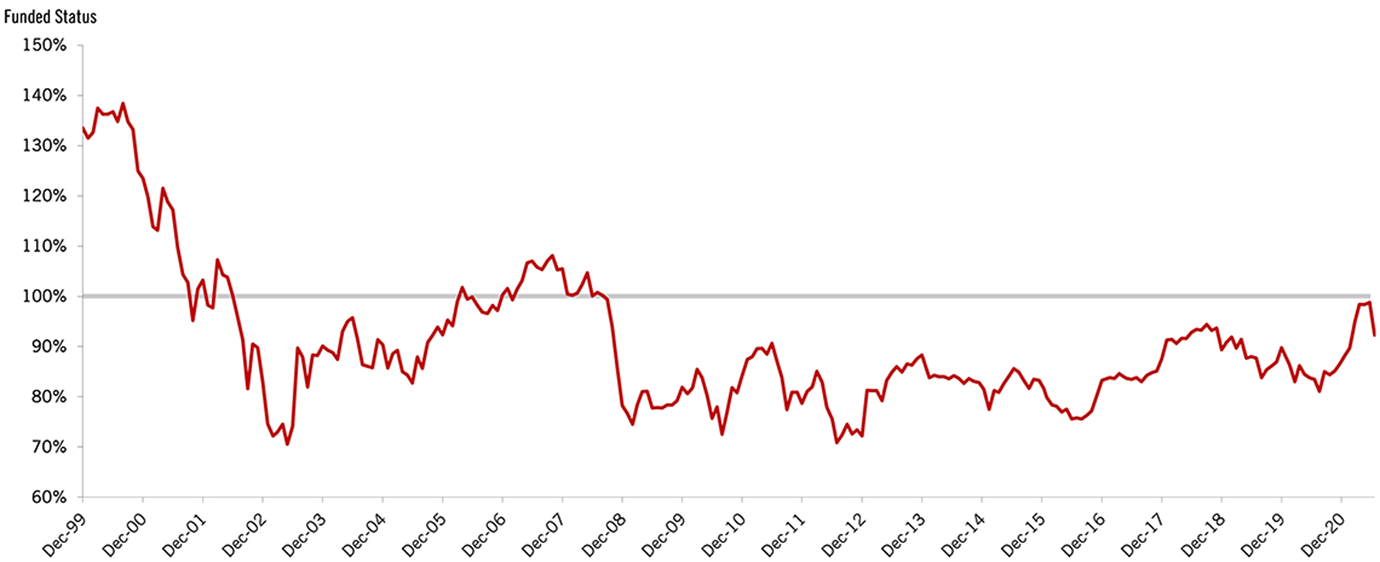
In the pension risk transfer market, it is funded status volatility that is driving the secular move to exit risk—and there has been so much volatility. Figure 2 shows the funded status of US pension plans going back to 2000. It's been a tumultuous ride. First there was the dot.com bust, and then the recovery. US plan sponsors deposited $275 billion in cash and returned to good health just in time for the financial crisis of 2008, which sent funded status plummeting again.
US pension plan funded status volatility. Source: Milliman 100 Pension Funding Index, The 100 Largest US Corporate Pension Plans, March 31, 2021 (98.4%).

Since the end of the crisis, US plans moved mostly sideways despite a further $448 billion in contributions. The lack of progress was due to risk and leverage and a massive mismatch between assets and liabilities. We believe US pension funds could have managed this better.
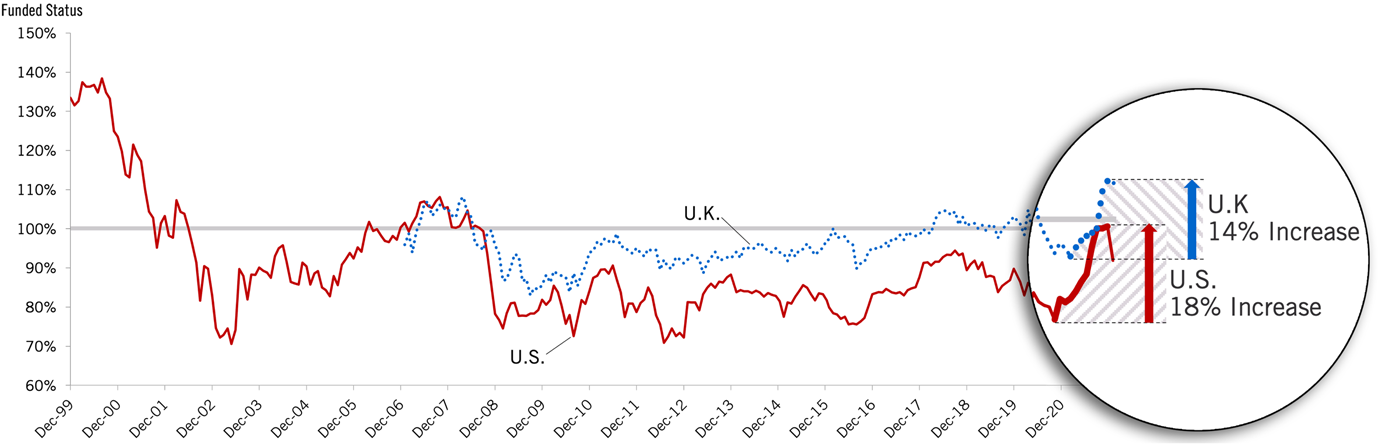
Figure 3 shows how UK schemes, with their higher funded status and higher fixed income allocations, have fared much better than their US counterparts.
US and UK pension plan funded status volatility. U.S. Source: Milliman 100 Pension Funding Index, The 100 Largest U.S. Corporate Pension Plans, March 31, 2021 (98.4%). FTSE 100 Source: Aon Hewitt, “Aon Hewitt Global Pension Risk Tracker,” as of March 31, 2021 (98.4%). https://PensionRiskTracker.aon.com, accessed April 23, 2021. Funding ratio (cumulative assets/liabilities) of all pension schemes in the FTSE 100 index on the accounting basis.

2.3 US and UK pension plan funded status volatility
Let's focus on the funded status volatility seen during the pandemic. In the US, we started the pandemic at roughly 90% funded. And pension funds in the US typically lost about 10 percentage points, falling to around 80% funded in the middle of 2020. As rates stabilized and equities improved, US plans then experienced an 18% increase in funded status, almost reaching 100% funded. This improvement drove a significant uptick in volume for the fourth quarter of 2020 in the US pension risk transfer market.
The UK had a similar experience, where they began the pandemic at about 105% funded, and that was driving a very robust market. However, they quickly lost more than 10% funded status early in 2020. And then, in the second half of last year, they gained 14% back, bringing the average UK funded status well above 105%. And, of course, fueling a lot of pension risk transfer transactions. Funded status is a bit lower now in both countries, driving a more muted market thus far in 2021. It's worth asking, then, why is the funded status so important?
Because any time funded status increases, hedging becomes more affordable. And any time volatility increases, hedging becomes more valuable. Between the healthy funded status that we've seen, and the volatility we've experienced, all these factors point toward the decision to transfer the risk.
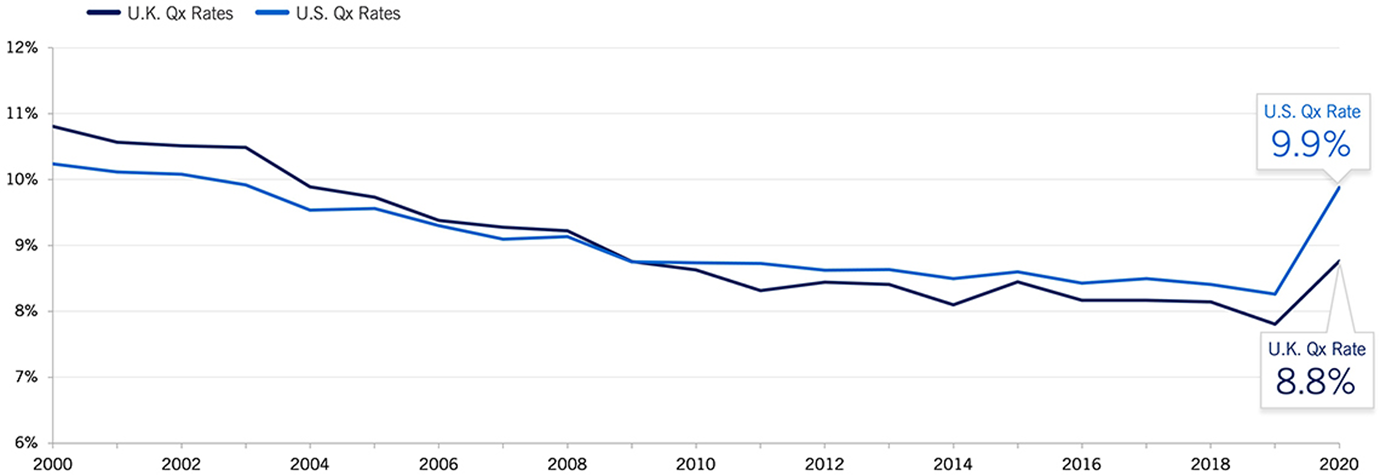
In the pandemic, nothing has been more volatile than short-term longevity improvements. Figure 4 shows base mortality rates for retirees in the US and UK since 2000.
Base mortality rates for the US and UK. Sources: UK rates based on ONS data, S3P industry tables, and 50/50 M/F split. US QX rates based on Social Security Administration/CDC data, PruInf18 White Collar tables, and 50/50 M/F split.

2.4 US and UK base mortality rates
What you can see is very steady improvements in the UK, with average mortality rates falling by 3% from the year 2000 to the beginning of the pandemic. In the pandemic, however, literally 11 years of progress was given back in the UK. The pandemic may be temporary, but for the year and a half it has been raging, we've experienced mortality as high as 11 years ago, temporarily erasing 11 years of improvement.
And in the US, it's been even more dramatic, with the pandemic temporarily erasing 17 years of improvement. While nothing has been more volatile than short-term longevity improvements, there's certainly been plenty of market volatility as well.
Interestingly, market volatility resulted in better pricing for pension buy-ins and buy-outs during the pandemic. It may seem counterintuitive, but a crisis often brings pricing opportunities into the pension buy-in and buy-out markets. And the pandemic has been no exception because widening credit spreads resulted in the most attractive pricing seen in years due to quantitative easing and market intervention.
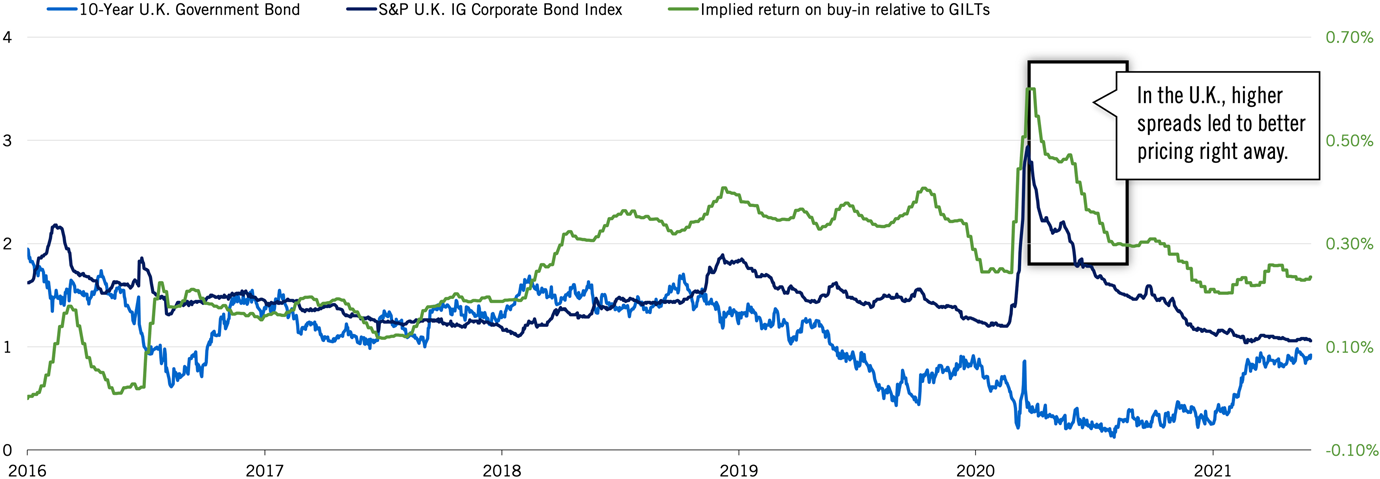
Figure 5 shows the 10-year UK government bond. When rates fall as they did during the pandemic, credit spreads often widen. And while government bond rates were falling at the beginning of the pandemic, credit spreads widened. This is because the pandemic kicked off an important credit cycle where some industries benefited from the economic shifts taking place, but many sectors were harmed—such as hospitality and commercial real estate.
Widening credit spreads during the pandemic. U.S. Sources: Willis Towers Watson De-risking Report, 2021. 10-year US Treasury and Bank of America US Corporate Index. OAS were sourced from the Federal Reserve Bank of St. Louis. UK Sources: 10-year UK Government Bond rates were sourced from the Bank of England website. S&P UK Investment Grade Corporate Bond Index rates were sourced from S&P Dow Jones Indices.

2.5 The more a buy-in returns relative to gilts, the more cost-effective and attractive it is
That, combined with the inevitable economic recession, led to these much wider credit spreads. Insurance companies put buy-in and buy-out portfolios together using spread-bearing assets, and when spreads widen, invariably pricing on buy-ins and buy-outs improves. In Figure 5 you can see that as government bond rates were falling and spreads were spiking at the beginning of the pandemic, it led to better pricing in the UK for buy-ins and buy-outs right away. These pricing improvements are shown in the solid line for implied returns on buy-ins relative to gilts. The more a buy-in returns relative to gilts, the more cost-effective and attractive it is.
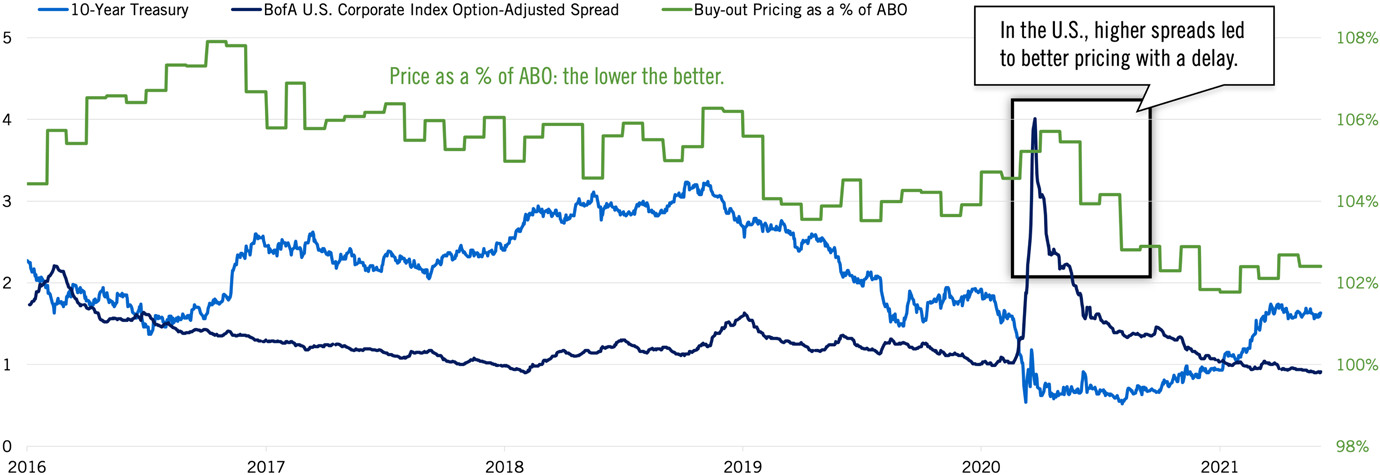
In the US, a similar pattern unfolded with bond rates plummeting at the beginning of 2020, then slowly moving toward pre-pandemic levels. When these signs of crisis appeared, spreads widened, which should have improved buy-out pricing, but it didn't right away. There was a delay—a delay that is worth examining.
Figure 6 shows the buy-out price as a percent of the accounting liability—so the lower the better. When the pandemic began and spreads widened, there was real concern among US insurers that the recession would kick off a credit cycle that would lead to lots of bond defaults. And while US insurers wrestled with that, buy-out pricing got worse.
Price as a percent of accumulated benefit obligation. US Sources: Milliman Pension Buy-out Index (MPBI), May 2021. 10-year US Treasury and Bank of America US Corporate Index AOS were sourced from the Federal Reserve Bank of St. Louis. UK Sources: 10-year UK Government Bond rates were sourced from the Bank of England website. S&P UK Investment Grade Corporate Bond Index rates were sourced from S&P Dow Jones Indices.

2.6 The less a buy-out costs relative to ABO, the more cost-effective and attractive it is
That was temporary, however, and the higher spreads did lead to better pricing—just with a delay. By end of 2020, buy-out pricing in the US was just about the best ever seen. These pricing improvements are shown in the solid line for buy-out price as a % of accumulated benefit obligation.Footnote 3 The less a buy-out costs relative to the accounting liability, the more cost-effective and attractive it is. This is noteworthy, and what we will examine next is how the rebound in funded status combined with historically attractive buy-out prices led to a very busy fourth quarter of 2020 in terms of transaction volume (Figure 7).
Mature market history of US funded status (in USD billions) and US buy-in and buy-out market volume. US Source: LIMRA Group Annuity Risk Transfer Survey, Q4 2020. Includes single premium buy-outs, buy-ins, and terminal funding. US Funded Status Source: Milliman 100 Pension Funding Index, the 100 largest US corporate pension plans, March 31, 2021 (98.4%).

2.7 Mature market history of US funded status and US buy-in and buy-out market volume
In 2020, US market volume was actually the third-highest in recorded history. The year closed with $27.2 billion of transactions, and that full-year total was only down approximately 11% from 2019. The different shades in the 2020 bar show market volume by quarter, and volume for the first three quarters of the year were muted until the market rebounded in the fourth quarter—and it rebounded for two reasons. First, pricing improved to the best levels in years; and second, funded status was rising quickly from its lows in the middle of 2020 to levels that made transactions much more affordable. These two factors drove an impressive fourth quarter and full year volume not far off from 2019 (Figure 8).
Mature market history of UK funded status (in USD billions) and UK buy-in and buy-out market volume. Total market volume as reported by Lane, Clark & Peacock, translated into USD at a rate of $1.27. FTSE Source: Aon Hewitt, “Aon Hewitt Global Pension Risk Tracker,” as of March 31, 2021 (98.4%). https://PensionRiskTracker.aon.com, accessed April 23, 2021. Funding ratio (cumulative assets/liabilities) of all pension schemes in the FTSW 100 index on the accounting basis.

2.8 Mature market history of UK funded status and UK buy-in and buy-out market volume
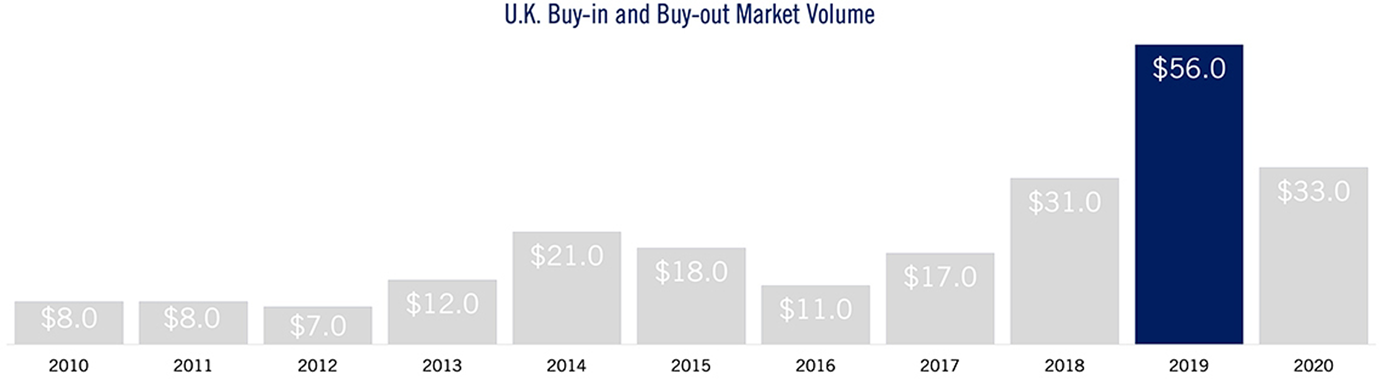
In the UK, buy-in and buy-out volume was second highest in history, second only to 2019 when $56 billion was transacted—because market conditions were ideal in 2019. One thing that was ideal was funded status, which was above 100% for most of 2019, helping the market achieve transaction volume of $56 billion.
As funded status fell at the beginning of the pandemic, transaction volume returned to more normal levels of $33 billion for 2020. In a crisis as severe as the pandemic, watching market volume return to normal levels and crossing the finish line as the second-highest year in recorded history is true resilience.
The last part of this pension and longevity risk transfer market to explore is the longevity swap market. This is where pension schemes keep their asset risk and transfer just the longevity risk to reinsurers (Figure 9).
UK longevity swap transaction volume (£ billions). Source: Hymans Robertson and PFI analysis of announced transactions, as of May 2021.

2.9 UK longevity swap transaction volume (£ billions)
Since 2010 there's been over £110 billion worth of this activity. The best years ever were 2014 and 2020. Like buy-ins and buy-outs, the 2020 longevity swap market put up its second-best year in recorded history during the pandemic, demonstrating tremendous resilience. And in the first half of 2021, as the pandemic continued, there was almost $10 billion in transaction volume, making the first half of 2021 a good year by any measure, and this is another market holding up well under pressure.
Why is it these markets all held up so well and put up their second- or third-highest transaction volume ever amid such a severe crisis? How did market participants rise above the early skepticism around transferring longevity risk in a pandemic? How did they price risk, and know at what price risk should be transferred?
We believe the answer lies in key research published in May 2020 that demonstrated pensioner life expectancy would not be materially impacted by the pandemic. The research was led by Andrew Cairns and David Blake, while Marsha Kessler and I also participated [Cairns et al. (Reference Cairns, Blake, Kessler and Kessler2020)].
2.10 Impact of coronavirus on life expectancy pre- to post-pandemic
As a team we examined how much the pandemic would impact life expectancy of the surviving elderly population. What we found was not surprising. Early predictions of COVID-19 mortality gave a range between 70,000 and 500,000 UK deaths. What we believed and then proved was that deaths anywhere in that range—though tragic—were not enough to materially impact the life expectancy of the surviving elderly population. In Figure 10, Cairns has graphed three scenarios with very plausible levels of UK pandemic deaths ranging from 120,000 to 180,000 people—and the resulting percentage increase in life expectancy is very, very small.
Impact of coronavirus on life expectancy pre- to post-pandemic. Source: Cairns, Andrew J.G., “Looking Forward: What Lessons Can We Learn From the COVID-19 Pandemic?” July 2021.

We measured life expectancy pre-COVID vs. life expectancy post-COVID for the survivors and found that if a person is age 65, their adjusted post-pandemic life expectancy for a healthy survivor is less than 1/10th of 1% higher than that same person's pre-COVID life expectancy. Even at age 90, the impact is still modest. This leads to a very small impact on the overall life expectancy of the survivors. And because this research was available to the market so early—May 2020—it joined a growing conversation about the fact that coronavirus deaths would not materially change the life expectancy of the surviving elderly population, and therefore would not materially change pricing for liabilities in pension and longevity risk transfer transactions. This was a crucial turning point that helped the market maintain its momentum through a time of uncertainty.
There were further findings as well. It was discovered that COVID-19 had basically doubled each cohort's mortality rate during the most severe outbreaks. And, when looking at pensioners, the groups most impacted were those whose mortality rates were highest before the pandemic—the frail elderly, people with significant co-morbidities, the most deprived among us, and by extension, communities of color.
With regard to pension risk transfer, these same groups make up a relatively small portion of the overall pension liabilities, either because their life expectancy is low, or their pension benefit is small. In our opinion, this understanding enabled the pension risk transfer market to continue to price liabilities—and allowed pension schemes to transact to manage volatility and uncertainty.
3. Funded reinsurance
Let's turn now to a different market altogether—the market for funded reinsurance. Growth in the UK buy-in and buy-out market has caused insurers to seek reinsurance partners with capital and asset management expertise. With funded reinsurance, an insurer—perhaps one that has done a pension risk transfer deal—transfers both asset risk and longevity risk from its annuities to a reinsurer and receives indirect access to the reinsurer's asset management capabilities and illiquid asset origination.
The arrival of funded reinsurance has been important for the pension de-risking market because funded reinsurance supports continued growth. Earlier we looked at the graph below of UK buy-in and buy-out market volume—and especially at the record $56 billion of transactions that occurred in 2019.
3.1 Arrival of funded reinsurance supports continued growth in UK pension de-risking market
As Figure 11 shows, the funded reinsurance market also took off in 2019. Such dramatic growth in the UK buy-in and buy-out market was causing the insurance companies there to seek reinsurance partners who could bring both capital and asset management expertise to support explosive growth.
The arrival of funded reinsurance supports continued growth in the UK pension de-risking market (in USD billions). Source: Total market volume as reported by Lane, Clark, and Peacock, translated into USD at a rate of $1.27.

We consider 2019 a key turning point in this funded reinsurance market, where reinsurance support was needed to allow the UK market to achieve such heights. At least five reinsurers have closed funded reinsurance transactions, resulting in meaningful volume and capacity to support the growth in the UK.
3.2 Funded reinsurance market is dominated by North American and Bermudian companies
As Figure 12 shows, the funded reinsurance market is dominated by North American and Bermudian companies, where the regulatory frameworks and the capital availability are both very good.
Funded reinsurance market is dominated by North American and Bermudian companies. Source: PFI.

Prudential entered this market in 2020 and has closed several transactions for insurers. RGA has closed over £3 billion in transactions to date, and AIG entered the market in 2018. These are the North American players. Shifting to Bermuda, Athene Life Re has been active in funded reinsurance for a decade. Pac Life Re announced its first deal in 2021, and other reinsurers such as Global Atlantic and Somerset Re are also active in this market.
4. Life reinsurance capital raising and sidecars
There is one more spot where market activity during the pandemic has been at unprecedented levels—and it's truly remarkable. In life reinsurance and sidecar arrangements, capital is flowing in to support the growth in the global PRT and annuity markets.
Just in the UK PRT market there's been significant equity capital raised by L&G and Pension Corporation during the pandemic. And globally, there's been an increase of private equity investment in insurers. For example, KKR acquired Global Atlantic, Apollo went from owning a minority stake in Athene to owning all of it, and Blackstone has purchased an All-State life business. It has been our experience that when private equity players acquire insurance platforms or invest in insurance blocks, they often do so through sidecars. And sidecars are a fascinating part of the traded longevity market.
Five years ago, we said that capital market solutions were slow to materialize, but that sidecar investing might be preferred as we developed a deeper and more robust traded market for longevity. As it turns out, this sidecar market has expanded—and it has expanded during the pandemic.
What is a reinsurance sidecar? It's a financial structure established to allow investors to take on the risk and benefit from the return of specific books of insurance and reinsurance business—often these days in the annuity space. These are usually set up by existing reinsurers looking to partner with third-party investors who bring a fresh source of capital (Figure 13).
How reinsurance sidecars work. Source: PFI internal data.

4.1 How reinsurance sidecars work
Here is how it works: In a normal pension risk transfer deal, the pension scheme pays an insurer a premium, and the insurer covers the benefits due to the pensioners for as long as they live and no matter what happens to the assets.
In a funded reinsurance deal, a reinsurer supports the insurer to take some or all the risk of the pension liability. In a sidecar transaction, a third-party investor will invest alongside that reinsurer, providing capital to support the growth in the pension risk transfer and annuity market. This is exactly how investor capital flows into these markets today. There is a traded market here—it's happening with sophisticated investors coming into these transactions through sidecars. Third-party investors are attracted to sidecars because in today's low-rate environment, it is challenging to identify investments with reliable return potential. Sidecars enable third-party investors to share with the reinsurer any profits or losses of the transaction, and to benefit from the insurance and actuarial expertise—as well as the access to big data—reinsurers use to analyze these opportunities.
When we first examined this trend, it was very new. It had been going on for some time in the property and casualty space but was just getting started in the life and annuity business. Just since 2018, $20 billion in investor capital has been leveraged for the life and annuity markets, and that's supporting almost $400 billion in liabilities. In Figure 14, these are the companies—and in many cases the partnerships—that have formed to engage in this activity. Let's examine the different kinds of business each of these platforms is focused on.
Since 2018, there has been over $20 billion in investor capital leveraged for the life and annuity markets, supporting nearly $400 billion in liabilities. Source: PFI internal data as of 2021.

First there is plain spread business, like pension risk transfer, fixed annuities, or fixed indexed annuities. Almost every one of these platforms is focused on this group of spread-based products. A few are also focused on mortality risk to put this risk in the same sidecar as annuity risk. This strategy is ideal because balancing longevity and mortality exposure within a sidecar is capital-efficient and an excellent way to manage these biometric risks.
Variable annuity is a third and more esoteric category where fewer firms will focus. Figure 14 shows the platforms that have made variable annuities a part of their strategy. Others may be willing to consider variable annuities, but only if they come as part of a much larger, attractive block. During the pandemic, there were many months when an announcement came every week for another platform, or another major transaction, fueled by this sidecar activity.
4.2 Alternative capital has grown to 15% of global reinsurance market capital
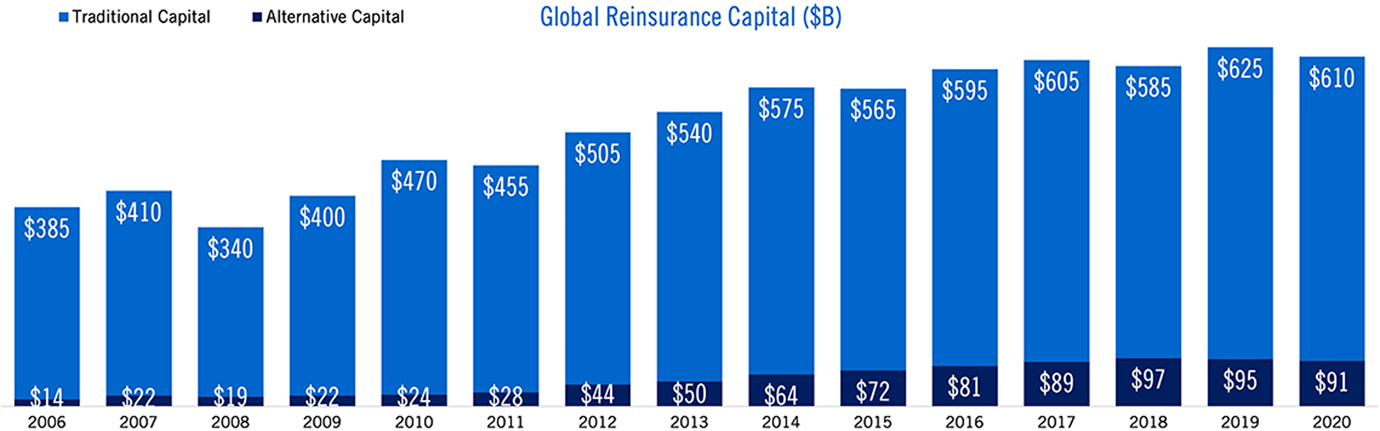
With this activity, alternative capital is growing very steadily. And with interest rates as low as they are, it's not surprising that alternative capital has grown to 15% of global reinsurance market capital as shown in Figure 15. In the past, that alternative capital had been very focused on property and casualty risk. Today it's focused on many more lines of business, including the life and annuity sector, and it's coming from a much larger group of investors.
Global reinsurance capital. Source: Artemis.bm, Aon Business Intelligence, Aon Securities, Company filings.

4.3 Many of the world's largest investors are focused on life insurance and reinsurance sidecars
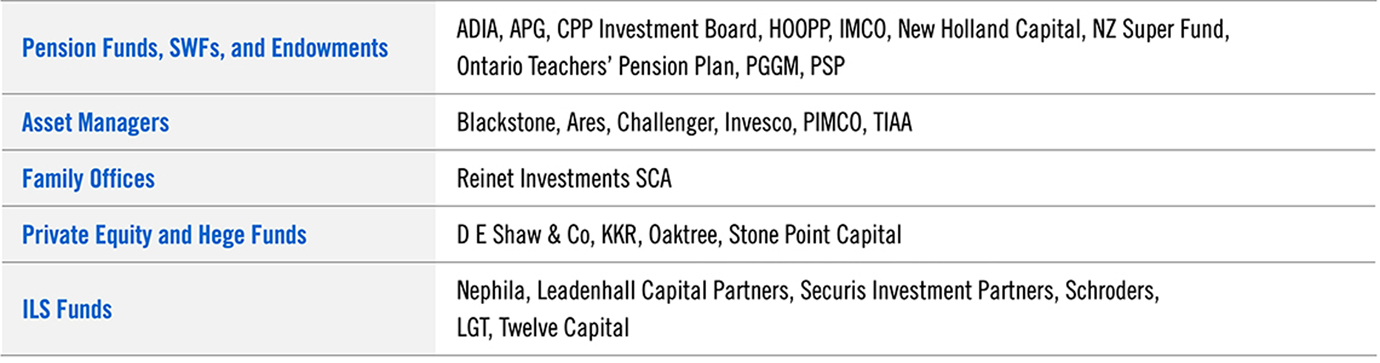
Given the low-rate environment and the hunt for uncorrelated risk, many of the world's largest investors are focusing on life insurance and reinsurance sidecars. This is because the longevity, mortality, and behavioral risks in insurance liabilities are uncorrelated with most investment and credit risk inherent in many public assets and offer a diversification of the risk for the portfolio. As shown in Figure 16, there are pension funds and endowments, sovereign wealth funds, asset managers, family offices, hedge funds, private equity, and insurance-linked securities funds all pouring into this sidecar space, and this is just a selection of who is investing in the market to support this activity going forward.
Many of the world's largest investors are focusing on life insurance and reinsurance sidecars. Source: PFI internal data.

5. Conclusion
Reflecting on a volatile 2020 and continued uncertainty in 2021, these four markets have remained remarkably resilient. Pension risk transfer and longevity risk transfer are now powerful secular trends. Companies are de-risking pension plans in near-record volumes and have continued to confidently do so during the pandemic at or near the most attractive prices in years.
On both sides of the Atlantic, the arrival of funded reinsurance is bringing reinsurer capital and scarce private assets to support the continued growth in the pension risk transfer market. Finally, the low-rate environment and hunt for uncorrelated risk has the world's largest investors directing billions into life reinsurance sidecars. With the recent expansion in sidecars, there is a vibrant traded market for longevity indeed. And one that has proven its resilience during the COVID-19 pandemic.
Conflict of interest
This document has been prepared for discussion purposes only. This document does not constitute an offer or an agreement, or a solicitation of an offer or an agreement, to enter into any transaction (including for the provision of any services). In preparing and distributing this document, neither Prudential Financial, Inc. (PFI) nor any of its affiliates is providing legal, regulatory, tax, investment, or accounting advice. Before entering into a transaction or pursuing a strategy of the types described herein, you should consider the suitability of the transaction or strategy to your particular circumstances and independently review the specific financial risks as well as the legal, regulatory, investment, credit, tax, and accounting consequences. This information is provided with the understanding that the recipient will discuss the subject matter with its own legal counsel, auditor, and other advisors.
Certain of the product concepts and case studies discussed in these materials are describing US insurance and UK reinsurance arrangements offered, negotiated, underwritten, and performed by The Prudential Insurance Company of America (PICA) in the United States, and are not intended to mean, and do not mean, that such products are being offered in any jurisdiction.
Insurance and reinsurance products are issued by PICA, of Newark, New Jersey, a wholly owned subsidiary of PFI. PICA is solely responsible for its financial condition and contractual obligations. Neither PICA nor its parent company PFI, headquartered in the United States, is affiliated in any manner with Prudential plc, incorporated in the United Kingdom or with Prudential Assurance Company, a subsidiary of M&G plc, incorporated in the United Kingdom. PICA provides off-shore reinsurance to companies that have acquired UK pension risks through transactions with UK plan sponsors. PICA is not licensed to write insurance or reinsurance within the European Economic Area.
© 2022 Prudential Financial, Inc. and its related entities. Prudential, the Prudential logo, and the Rock symbol are service marks of PFI and its related entities, registered in many jurisdictions worldwide.
1055725-00002-00 PRT_AR_RE13_01-BW
11/2021