I. INTRODUCTION
Magnesium alloys are the lightest structural metallic materials and have received considerable attention for applications in aerospace and automobile industries. Reference Antion, Donnadieu, Perrard, Deschampa, Tassin and Pisch1–Reference Nodooshan, Liu, Wu, Ding and Mahmudi5 However, poor room temperature properties and low high temperature creep resistance and strength limit the wider uses of conventional Mg alloys. Owing to the solid solution and precipitation hardening, addition of rare earth (RE) elements such as Nd, Y, Gd is an effective way to improve the strength of Mg alloys both at room and high temperatures. Reference Li, Lv, Liang, Qi, Zhu and Zhang6–Reference Fu, Peng, Jiang, Ma and Zhai17
Among the Mg–RE alloys, Mg–Gd and Mg–Nd system alloys are widely studied and used due to their enhanced mechanical properties. The Mg–Gd system alloys generally have a high content of heavy RE elements which significantly increase their costs and limit their application. In contrast, with low content of RE elements, Mg–Nd–Zn alloy present high strength, good ductility, and creep resistance by the formation of β″ and β′ phases. Reference Fu, Peng, Jiang, Chang and Zhai8–Reference Sanaty-Zadeh, Luo and Stone10 However, these alloys are not suitable for applications above 250 °C due to the sharp drop of mechanical properties. According to many published studies, addition of Y element is an effective way to improve the mechanical properties of Mg alloys. For instance, Su et al. Reference Su, Liu, Wang and Shu11 reported that with the increase of Y element, the grains of Mg–2.4Nd–0.2Zn–0.4Zr–xY (0, 2.5, 4.0, 6.0 wt%) were refined and higher volume fraction of β′ phase was obtained, which result in the improvement of tensile properties. Hu et al. Reference Hu, Xing, Huang, Zhong and Zhang12 found that a high temperature MgSnY phase promoted the age-hardening response in the Mg–6Zn–1Mn–4Sn alloy with 0.5 wt% Y addition, and high number density of β′ rods was obtained, thus the ZMT-0.5Y alloy exhibited excellent mechanical properties. Zhao et al. Reference Zhao, Zhang, Liu, Wu and Zhang13 reported that 1 wt% Y addition brought grain refinement of Mg–8Li–3Al–2Zn alloy and formation of Al2Y phase, which also enhanced the tensile properties and the addition of Y was helpful to the thermal stability of Mg–8Li–3Al–2Zn alloy. Li et al. Reference Li, Sha, Jie and Ringer14 found that addition of 0.2 wt% Y into the Mg–2.8Nd–0.6Zn–0.4Zr provided a higher yield strength of the alloy in both room temperature and high temperature tensile tests. The improvement tensile strength at high temperatures was attributed to the enhanced precipitation of β″, β′, and β1 precipitates and the co-existence with basal γ-type precipitates.
However, alloys with high content of Y generally present poor ductility, larger density, and higher cost. In contrast, a minor addition of Y becomes more attractive and it is necessary to obtain an optimized alloy by microalloying. In this study, the effect of low content Y addition on microstructure and mechanical properties of Mg–Nd–Zn–Zr alloy was studied to obtain high performance Mg–Nd–Y–Zn–Zr alloy. The solid solution strengthening mechanisms was discussed, and the plastic flow behavior was also investigated.
II. EXPERIMENTAL PROCEDURE
Mg–0.43Nd–xY–0.08Zn–0.11Zr (x = 0, 0.03, 0.06, and 0.12 at.%) alloys were prepared using pure Mg and Zn ingots, Mg–90 wt% Nd, Mg–25 wt% Y, and Mg–30 wt% Zr master alloys in an electric resistance furnace under the protection of a mixed atmosphere of CO2 and SF6. The actual chemical compositions of the alloys were analyzed by Inductive Coupled Plasma Atomic Emission Spectroscopy (ICP-AES) and the results were presented in Table I. Samples cut from the cast ingots were first solution-treated at 540 °C for 6 h and quenched, followed by aged at 200 °C in an oil bath.
Chemical compositions of Mg–0.43Nd–xY–0.08Zn–0.11Zr alloys.

Vickers hardness tests of the alloys were taken with 5 kg load and holding time of 15 s. Rectangular tensile samples with dimensions of 10 mm width, 2 mm thickness, and 30 mm gauge length were cut by an electric-sparking wire-cutting machine. Tensile testing was carried out using Zwick/Roell Z100 tensile testing machine (Zwick Roell Group, Ulm, Germany) at temperature range of 25–300 °C and strain rate of 1 × 10⁻⁴ to 1 × 10⁻². For each test temperature, three specimens were used.
One cross-section of each sample was ground and polished. The as-cast and T6-treated samples were etched in a 4 vol% nital and the solution-treated alloys were etched in a solution of 12 g picric acid + 80 mL acetic acid + 80 mL water + 350 mL ethanol. Subsequently, the microstructure was observed on an optical microscope (OM; ZEISS Axio Observer A1, ZEISS, Oberkochen, Germany), a scanning electron microscope (SEM; JEOL JSM-7800F Prime, JEOL Ltd., Tokyo, Japan) equipped with an energy dispersive spectrometer (EDS) and a TEM (JEOL-2100F, JEOL Ltd., Tokyo, Japan). Phase analyses were examined by X-ray diffractometer (XRD, Ultima IV, Rigaku Corporation, Tokyo, Japan). The grain size was measured from the obtained OM micrographs using Image-Pro plus 6.0 software (Media Cybernetics, Inc., Rockville, Maryland), and it was determined by the linear intercept method using equation D = L/(NV), where L is the total length of test line, N is the number of intercepts, and V the magnification of the photomicrograph. At least three typical images on each sample were measured.
III. RESULTS AND DISCUSSION
A. Microstructure and mechanical properties of as-cast alloy
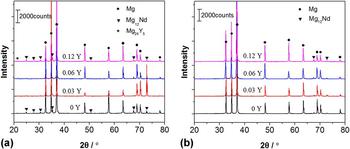
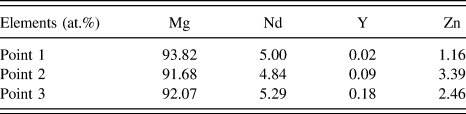
Figure 1 shows the microstructures of as-cast Mg–0.43Nd–xY–0.08Zn–0.11Zr (x = 0, 0.03, 0.06, and 0.12 at.%) alloys. They all mainly consist of equiaxed α-Mg matrix and eutectic compounds which are distributed along the grain boundaries. The black dotted phase (α-Zr) is also observed within α-Mg grains. With the Y content increases from 0 to 0.12 at.%, the grain size slightly decreases from 39 μm [Fig. 1(a)] to 30 μm [Fig. 1(d)]. In Y-containing alloys, some particles (gray needle-like phases) are visible within α-Mg grains [Figs. 1(b)–1(d)] and their amount gradually increases with increasing Y addition. The gray needle-like phase is believed to be Mg12Nd phase according to the XRD patterns [Fig. 2(a)] with a base centered tetragonal structure (a = 1.031 nm, c = 0.593 nm, space group I4/mmm Reference Nie18 ). In addition, new white phase in the grain boundaries is found in the Mg–0.43Nd–0.06Y–0.08Zn–0.11Zr and Mg–0.43Nd–0.12Y–0.08Zn–0.11Zr alloys [the inset SEM micrographs in Figs. 1(c) and 1(d)]. According to the EDS results (Table II) and XRD analysis [Fig. 2(a)], this white phase should be Mg24Y5 phase and it becomes small and dispersively distributed in the grain boundaries as the Y content increases from 0.06% to 0.12%. Therefore, it can be concluded that with the increase of Y addition, Mg24Y5 phase is formed, the grains are refined and the amount of needle-like Mg12Nd phase in the α-Mg grain interior is increased.
Microstructure of as-cast Mg–0.43Nd–xY–0.08Zn–0.11Zr alloys: (a) x = 0; (b) x = 0.03; (c) x = 0.06; (d) x = 0.12.

XRD patterns of (a) as-cast alloys; (b) solution-treated alloys.

EDS results of the secondary phase composition.
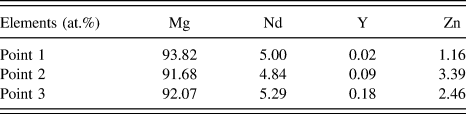
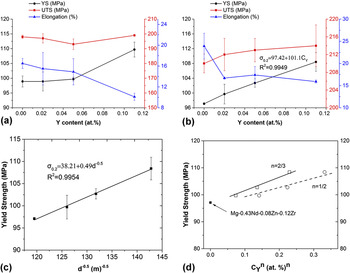
Figure 3(a) presents the tensile properties of the as cast alloys. It can be found that the YS of the alloys is continuously increased from 98.9 to 109.7 MPa with the increase of Y content. The increase in YS should be mainly attributed to the refinement of α-Mg grain size and strengthening effect of needle-like Mg12Nd phase. However, the brittle Mg24Y5 phase increases with increasing Y addition, and the cracks always develop along the eutectic phases during tensile testing. Therefore, UTS almost keep unchanged (about 198 MPa) and the elongation gradually decreases from 16.5% to 10.1%.
(a), (b) are tensile properties of the as-cast and solution-treated alloys, respectively; (c), (d) are YS of solution treated alloys as a function of grain size and CY n , respectively.

B. Microstructure and mechanical properties of solution-treated alloy
Figure 4 shows the OM microstructure of solution-treated Mg–0.43Nd–xY–0.08Zn–0.11Zr alloys. The grain size decreases significantly from 70 to 49 μm as the Y element increases from 0 to 0.12%. Without Y addition, the eutectic Mg12Nd compounds nearly completely dissolve into the α-Mg matrix after solution treatment [Fig. 4(a)], which is also indicated by the XRD patterns in Fig. 2(b). In the Y-containing alloys, Mg24Y5 phase almost dissolve into the α-Mg matrix, while residual eutectic Mg12Nd compounds are observed at the triple points of grain boundaries [Figs. 4(b)–4(d)] and they can also be detected by XRD analysis [Fig. 2(b)]. The gray needle-like Mg12Nd phase [Figs. 1(b)–1(d)] within the α-Mg grains nearly all dissolve and some long-rod-like phase occur (will be further discussed in Sec. III.C).
Optical micrographs of the solution-treated Mg–0.43Nd–xY–0.08Zn–0.11Zr alloys: (a) x = 0; (b) x = 0.03; (c) x = 0.06; (d) x = 0.12.

Figure 3(b) presents the mechanical properties of the Mg–0.43Nd–xY–0.08Zn–0.11Zr alloys after solution treatment. The YS and UTS of the alloy increase gradually with increasing content of yttrium due to the refinement of α-Mg grain size and solution strengthening of Mg24Y5 phase. However, the elongation is decreased from 23.9% to 15.9% with the Y content increasing from 0% to 0.12%, which may be attributed to the observed residual eutectic Mg12Nd compounds at the grain boundaries. During tensile texting, cracks easily develop across these residual brittle eutectic compounds, resulting in the fracture of the sample and the decrease of alloy ductility. The specimens with the highest Y content (0.12 at.%) exhibit the highest YS (108 MPa). The YS increases linearly with the Y content (at.%) following the equation (R 2 = 0.9949):
 $${\sigma _{0.2}} = 97.4 + 101{C_{\rm{Y}}}\quad .$$
It reveals that the strengthening rate (dσ0.2/dC Y) of the Mg–0.43Nd–xY–0.08Zn–0.11Zr alloy (101 MPa/at.%) is higher than those of Mg–yNd–0.08Zn–0.12Zr alloy (38 MPa/at.%) and Mg–0.52Nd–zZn–0.12Zr (50 MPa/at.%). Reference Li, Fu, Peng, Wang and Jiang15 The relation between YS and the average grain size of solution treated Mg–Nd–Zn–Y–Zr alloys is analyzed in Fig. 3(c). It is well known that the relationship between the YS (σ0.2) and the average grain size (d) could be described by the Hall–Petch law as Reference Toda-Caraballo, Galindo-Nava and Rivera-Díaz-del-Castillo19 :
 $${\sigma _{0.2}} = {\sigma _0} + k{d^{ - 1{\rm{/}}2}} = {\sigma _{{\rm{CRSS}}}} + {\sigma _{\rm{P}}} + \Delta {\sigma _{\rm{s}}} + k{d^{ - 1{\rm{/}}2}}\quad ,$$
where k is the strength coefficient, σ0 is the friction stress. σCRSS is correlated with the critical resolved shear stress, σP is a residual stress, and Δσs is the solid solution strengthening contribution which can be assumed by Δσs = k i C i n , where C i is the atomic fraction of solute i and k i is a constant for element i, n = 1/2 or n = 2/3 according to the Fleischer’s approach Reference Fleischer20 and Labusch’s approach. Reference Labusch21 Therefore, the YS of solution-treated Mg–0.43Nd–xY–0.08Zn–0.11Zr can be expressed as:
 $${\sigma _{0.2}} = {\sigma _{{\rm{CRSS}}}} + {\sigma _{\rm{P}}} + {k_{{\rm{Nd}}}}{\left( {{C_{{\rm{Nd}}}}} \right)^n} + {k_{\rm{Y}}}{\left( {{C_{\rm{Y}}}} \right)^n} + {k_{{\rm{Zn}}}}{\left( {{C_{{\rm{Zn}}}}} \right)^n} + k{d^{ - 1{\rm{/}}2}}\quad .$$
The date points in Fig. 3(c) may be fitted to the linear equation (R 2 = 0.9954):
 $${\sigma _{0.2}}({\rm{MPa}}) = 38.2 + 0.49{d^{ - 0.5}}\quad .$$
In indicates that σ0 is about 38.2 MPa, and the grain boundary strengthening is 0.49d −0.5. The strengthening coefficient value of k (0.49 MPa m1/2) is a little larger than that of Mg–yNd–zZn–xZr (0.42 MPa m1/2) Reference Li, Fu, Peng, Wang and Jiang15 and they are both in good agreement with the previously published studies about grain boundary strengthening in Mg alloys. Reference Do Lee22,Reference Gao, Chen and Han23 Figure 3(d) shows the YS in Mg–0.43Nd–xY–0.08Zn–0.11Zr alloys as a function of CY n base on Akhtar and Teghtsoonaian model. Reference Akhtar and Teghtsoonian24 The fitted value in this work k Y = 34 MPa (at.%)−1/2 or 50 MPa (at.%)−2/3. It is reported that the strengthening model with n = 2/3 presents a better description for Mg–Nd–Zn–Zr system alloy than that with n = 1/2. Reference Li, Fu, Peng, Wang and Jiang15 For Mg–0.43Nd–xY–0.08Zn–0.11Zr alloy, the value k Nd = 18 MPa (at.%)−2/3 can be obtained under the condition of σCRSS = 5 MPa, σP = 15 MPa, k Zn = 40 MPa (at.%)−2/3. Reference Toda-Caraballo, Galindo-Nava and Rivera-Díaz-del-Castillo19
C. Microstructure and mechanical properties of T6-treated alloy
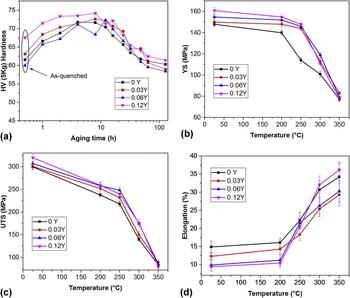
Figure 5(a) shows the age hardening curves of solution-treated Mg–0.43Nd–xY–0.08Zn–0.11Zr alloys after aged at 200 °C. With Y content increases from 0 to 0.12%, the peak hardness slightly increases from 71 HV to 74 HV. The peak is delayed by Y addition, Mg–0.43Nd–0.08Zn–0.11Zr alloy takes about 6 h, while Y containing alloys need 8 or 12 h. The decline in overage hardness of the alloys are similar.
(a) Hardness evolution as a function of aging time during isothermal aging at 200 °C for Mg–0.43Nd–xY–0.08Zn–0.11Zr alloys; (b), (c) and (d) are tensile properties of the T6 treated alloys at temperature range of 25–350 °C.

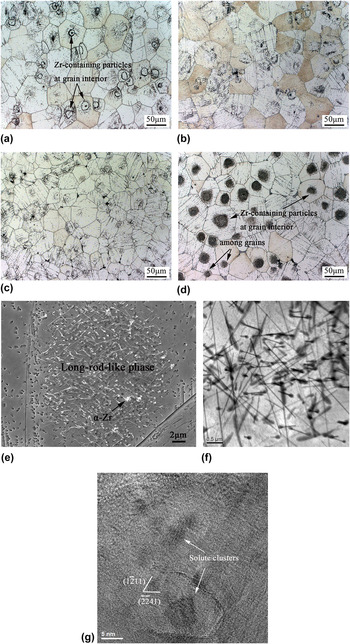
Figures 6(a)–6(d) presents the microstructure of the T6-treated Mg–0.43Nd–xY–0.08Zn–0.11Zr alloys. With Y content increases from 0 to 0.12%, the grain size decreases from 71 to 57 μm. For Mg–0.43Nd–0.08Zn–0.11Zr alloy, some black precipitates can be observed and the Zr-containing particles still exist at grain interior [compared Fig. 6(a) with Fig. 4(a)]. With the increase of yttrium, the amount of black precipitates is increased. For the Mg–0.43Nd–0.12Y–0.08Zn–0.11Zr alloy, the Zr-containing particles at grain interior or among α-Mg grains are found, and a significant increase of black precipitates is observed [compared Fig. 6(d) with Fig. 3(d)]. As shown in SEM image [Fig. 6(e), the white long-rod-like phase] and TEM image [Fig. 6(f), the black long-rod-like phase], these black precipitates are long-rod-like phases with several microns in length and about 200 nanometers in width, and they are network distributed with different orientations and interlaced with each other. In addition, the long-rod-like phase is determined to be Zn2Zr3 phase which has a tetragonal structure (a = 0.768 nm, c = 0.699 nm, space group P42/mnm Reference Liu, Yang, Luo and Jie25 ). The Zn2Zr3 phase is not found in the as cast microstructure, and its amount is increased after age treatment, thus the formation of this phase may be attributed to the reaction of Zr particles with dissolved Zn atoms during solution treatment and the reaction of undissolved Zr particles with segregation of Zn atoms during the age treatment.
Optical micrographs of the T6-treated Mg–0.43Nd–xY–0.08Zn–0.11Zr alloys: (a) x = 0; (b) x = 0.03; (c) x = 0.06; (d) x = 0.12. (e) and (f) are SEM and TEM micrographs of the long-rod-like precipitates in the T6-treated Mg–0.43Nd–0.12Y–0.08Zn–0.11Zr alloy, respectively. (g) is the HRTEM image of solute clusters in the T6-treated Mg–0.43Nd–0.12Y–0.08Zn–0.11Zr alloy.

Figure 6(g) shows the HRTEM image of solute clusters in the T6-treated Mg–0.43Nd–0.12Y–0.08Zn–0.11Zr alloy. The strong-clustering phenomenon observed by the HRTEM image is in consistent with that observed by APT in previous work Reference Li, Sha, Jie and Ringer14 which indicated that the solute clusters were Nd and Zn rich phases. Moreover, the significant increase of Zn2Zr3 phase [compared Fig. 6(d) with Fig. 4(d)] further confirm that solute clusters also formed in the alloy. For Mg–3Nd–0.2Zn alloy, the precipitation sequence is: super saturated solid solution (SSSS) → clusters of atoms → G. P. Zones (I, II, III) → β′ → β2 → β1/γ → β. Reference Sanaty-Zadeh, Luo and Stone10 With minor Y addition, the precipitation sequence of the alloy before the peak hardness was identified as: solute clusters → β″ → β′ → β1/γ. Reference Li, Sha, Jie and Ringer14 It is well known that the atom clustering often occurs during the age treatment. With addition of Y element, the solute-rich features in the alloy were enhanced, and thus the strength of the Mg–Nd–Y–Zn alloy presented higher strength than that of the Mg–Nd–Zn alloy. Reference Li, Sha, Jie and Ringer14 However, the Zn enriched γ series occurred with a high amount of Zn addition (higher than 0.5 wt%), and the most effective precipitation hardening β series in rare-earth containing magnesium alloys were restricted. Reference Sanaty-Zadeh, Luo and Stone10 Therefore, the γ series which serve as obstacle for nonbasal slipping of dislocations would not be observed in this work (Table I, the Zn content is about 0.2 wt%), and the prismatic β-type precipitates in the alloy is believed to play an important role to enhance alloy’s mechanical properties. Therefore, the enhanced strength (hardness increase of 6 HV in the T4-treated alloy, 3 HV in the T6-treated alloy) is lower than the value in previous work (hardness increase of 15 HV in the T4-treated alloy, 7 HV in the T6-treated alloy), while the properties of Mg–0.43Nd–0.12Y–0.08Zn–0.11Zr alloy in this study are higher than those of Mg–0.49Nd–0.06Y–0.24Zn–0.11Zr (at.%) alloy. Reference Li, Sha, Jie and Ringer14
The YS, UTS, and elongation of the T6 treated samples with temperature of all studied alloys are shown in Figs. 5(b)–5(d). From Fig. 5(b), it can be found that the YS of the alloy is decreased with the increase of test temperature. In addition, the YS increases with increasing Y content, and the Mg–0.43Nd–0.12Y–0.08Zn–0.11Zr alloy shows the highest YS at all test temperatures. An addition of 0.12Y at.% provide a clear improvement in the YS of the alloy in all conditions, which should be attributed to the grain refining, solute strengthening, and the enhanced precipitation hardening of β-type precipitates according to the above analysis. In particular, the YS of the 0.12Y at.%-containing alloy is 11 and 23% higher than that of Y-free alloy at 200 °C and 250 °C, respectively.
Figure 5(c) presents the variation of UTS at different temperatures. The Y-containing alloys show higher UTS at all temperatures. With the Y content increases from 0 to 0.12 at.%, the UTS of the alloy gradually increases from 300 to 320 MPa at room temperature. The UTS of the 0.12Y at.%-containing alloy is 9% and 10% higher than those of Y-free alloy at 200 °C and 250 °C, respectively. Figure 5(d) shows the effect of Y on the elongation of the Mg–Nd–xY–Zn–Zr alloys at different temperatures. The elongation increases continuously with increasing test temperatures. Furthermore, with increasing Y content, elongation decreases at temperatures below 200 °C. When the temperature exceeds 200 °C, the elongation of 0.06Y-containing and 0.12Y-containing alloys show higher elongation than the 0.03Y-containing alloy, and the 0.12Y-containing alloy presents higher value than the Y-free alloy when the temperature is higher than 300 °C.
D. Fracture behavior and plastic flow behavior
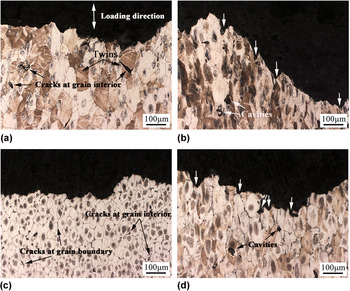
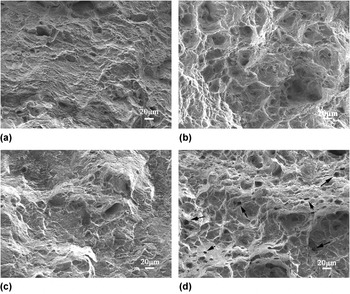
Figure 7 presents the side views of fracture surfaces of the T6 treated Mg–0.43Nd–xY–0.08Zn–0.11Zr alloys tested at different temperatures. Figure 8 shows the corresponding SEM micrographs of the fracture surfaces. For Mg–0.43Nd–0.08Zn–0.11Zr alloy, cracks always propagate across the grain interior at 200 °C [Fig. 7(a)], and small dimples are observed in the fracture surface [Fig. 8(a)]. While testing at 250 °C, grains extend to tensile direction and large cavities occur within the grains, and many large-sized pits [Fig. 8(b)] which correspond to the grooves [marked by arrows in Fig. 7(b)] can be found in the fracture surface. For Mg–0.43Nd–0.12Y–0.08Zn–0.11Zr alloy, cracks develop along the grain interior or grain boundary at 200 °C [Fig. 7(c)]. Under the present condition, the eutectic phases hindered the growth of the α-Mg grains [compared with Figs. 7(a) and 7(c)], and some cracks initiated along these brittle eutectic phase, which may pin the grain boundary sliding and strengthen the boundaries, resulting in the higher YS and UTS and lower elongation (compared with those of Mg–0.43Nd–0.08Zn–0.11Zr alloy). Furthermore, less dimples are observed in the fracture surface [Fig. 8(c)]. When testing at 250 °C, the grain size is also smaller than that of Mg–0.43Nd–0.08Zn–0.11Zr alloy [compared with Figs. 7(b) and 7(d)] and more smaller cavities are formed at the grain boundary or within the grains [Fig. 7(d)]. Many small-sized pits (marked by arrows) which correspond to the grooves [marked by arrows in Fig. 7(d)] are observed in the fracture surface [Fig. 8(d)].
Side views of fracture surfaces of the T6 treated Mg–0.43Nd–0.08Zn–0.11Zr (a–b) and Mg–0.43Nd–0.12Y–0.08Zn–0.11Zr alloys (c–d) at different temperatures: (a and c) 200 °C, (b and d) 250 °C.

Tensile fracture of the T6 treated Mg–0.43Nd–0.08Zn–0.11Zr (a–b) and Mg–0.43Nd–0.12Y–0.08Zn–0.11Zr alloys (c–d) at different temperatures: (a and c) 200 °C, (b and d) 250 °C.

During tensile testing of T6-treated Mg–Nd–Zn alloys at room temperature, twin nucleation is easy, and the crack initiation behavior is mainly determined by the twin boundaries cracking and grain boundaries cracking. Reference Tang, Liu, Chen, Liu and Deng26,Reference Yue, Fu, Li and Peng27 When the test temperature is below 200 °C, the basal slip and twinning are the main deformation mechanisms. Under the present condition, most of the cracks for Mg–0.43Nd–0.08Zn–0.11Zr alloy at testing temperature of 200 °C are found along the grain interior, which should locate at twin grain boundaries [Fig. 7(a)]. While with Y addition, the grain is refined and the cracks are noted to form along twin grain boundaries or grain boundaries [Fig. 7(c)]. The change of fracture mode should be attributed to the strengthening of residual Mg12Nd phase and the enhanced precipitation hardening of Zn2Zr3 phase and β-type phase.
With the rise of testing temperature, pyramidal slip operates and the numbers of slip systems are increased, Reference Agnew, Yoo and Tome28 thus the plasticity of Mg–0.43Nd–xY–0.08Zn–0.11Zr alloys is significantly enhanced [Fig. 5(d)]. In addition, the percentage of twin is decreased and dynamic recrystallization may happen as the testing temperature raising to 250 °C. Reference Zheng, Luo, Dong, Sachdev and Ding29 Therefore, cavities are easily formed in the side views at the temperature of 250 °C [Fig. 7(b)]. Similar phenomenon is also found in the high temperature testing of Mg–Gd–Y–Zr alloys. Reference Nodooshan, Wu, Liu, Wei, Li and Zhang30 In this study, the addition of Y to the Mg–Nd–Zn–Zr alloy bring hinder growth effects of α-Mg grains and cavities, thus the number of cavities is increased by comparing the 0.12Y-containing alloy and Y-free alloy [compared Figs. 8(b) and 8(d)]. The coarsening of dispersively distributed precipitates and easy gliding on nonbasal planes facilitate the deformation of grains, thus the elongation is increased and its value of 0.12Y-containing alloy is higher than that of Y-free alloy as the temperature raising to 300 and 350 °C [Fig. 5(d)].
In addition, the flow behavior of Mg–0.43Nd–0.12Y–0.08Zn–0.11Zr alloy is studied to further understand the enhanced tensile properties by comparing with the Y-free alloy. Arrhenius relationship Reference Zheng, Luo, Dong, Sachdev and Ding29,Reference Maksoud, Ahmed and Rödel31 is often used to describe the constitutive behavior of different materials at high temperatures:
 $$\dot \varepsilon = A'{\sigma ^{n'}}\exp \left( {{{ - Q} \mathord{\left/ {\vphantom {{ - Q} {RT}}} \right. \kern-\nulldelimiterspace} {RT}}} \right)\quad ,$$
where
 $\dot \varepsilon$
is the strain rate, A′ and n′ are constants, σ is the stress, Q is the activation energy for deformation, R is the molar gas constant, and T is the test temperature. Based on the experimental results and Eq. (5), the following model is established to quantify the effect of deformation temperature and strain rate on the flow stress of the Mg–0.43Nd–0.12Y–0.08Zn–0.11Zr alloy (the calculation method can be found in Ref. Reference Zheng, Luo, Dong, Sachdev and Ding29):
 $$\sigma = {\left( {169.69\dot \varepsilon \exp \left( {{{223045} \mathord{\left/ {\vphantom {{223045} {RT}}} \right. \kern-\nulldelimiterspace} {RT}}} \right)} \right)^{0.098}}\quad .$$
The stress exponent value n′ for Mg–0.43Nd–0.12Y–0.08Zn–0.11Zr alloy presented is about 10.2, which is higher than the value of 8.4 reported for NZ30K alloy. Reference Zheng, Luo, Dong, Sachdev and Ding29 The two values are greater than 5, which indicates that climb-controlled dislocation creep is the main deformation mechanism in the two alloys at elevated temperatures. Reference Hirai, Somekawa, Takigawa and Higashi32 The Q value calculated is 223 kJ/mol which is higher than that reported in the literature for the NZ30K alloy (207 kJ/mol). Reference Zheng, Luo, Dong, Sachdev and Ding29 The obtained higher value of stress exponent and activation energy may be attributed to the effect of resisting dislocation moving by the dispersed Zn2Zr3 phase and β-type phase. In addition, the Q value of Mg–0.43Nd–0.12Y–0.08Zn–0.11Zr alloy is also higher than the values reported in the previous studies for the WE54 alloy (217 kJ/mol) Reference Galiyev, Kaibyshev and Gottstein33 and AZ31 alloy (147 kJ/mol Reference Maksoud, Ahmed and Rödel31 or 153 kJ/mol Reference Barnett34 ). From the above analysis, it can be suggested that minor addition of Y into the Mg–Nd–Zn–Zr alloy is an effective way to improve the alloy’s high temperature properties by strengthening precipitation hardening of Zn2Zr3 phase and β-type phase.
IV. CONCLUSIONS
In this study, the effects of minor Y addition on the microstructure and mechanical properties of Mg–0.43Nd–xY–0.08Zn–0.11Zr (x = 0, 0.03, 0.06, and 0.12) alloys have been investigated and some conclusions can be drawn as follows:
-
(1) With the increase of Y content, the average grain size of the as-cast alloy is decreased and the amount of needle-like Mg12Nd phase (within the α-Mg matrix) is increased. In addition, small amount of Mg24Y5 phases are formed in the Y-containing alloys and they are dispersively distributed in the grain boundaries of Mg–0.43Nd–0.12Y–0.08Zn–0.11Zr alloy.
-
(2) The needle-like Mg12Nd phase and Mg24Y5 phase nearly completely dissolved into the α-Mg matrix and the long-rod-like Zn2Zr3 phase occurred after solution treatment. However, residual Mg12Nd phase in the grain boundaries of Y-containing alloys is observed. Based on the experimental results, the YS of the solution-treated Mg–0.43Nd–xY–0.08Zn–0.11Zr alloys is estimated by a model combining different contributions.
-
(3) Aging hardening effect of Mg–0.43Nd–xY–0.08Zn–0.11Zr alloys increases with the increase of Y addition. The amount of long-rod-like Zn2Zr3 phase in the 0.12Y-containing alloy is significantly increased after age treatment and it is more than that in Y-free alloy due to the solute cluster of Zn in the Y-containing alloy.
-
(4) Mg–0.43Nd–0.12Y–0.08Zn–0.11Zr alloy shows the best combination of strength and elongation in all conditions, especially exhibits enhanced YS in the temperature range of 200–300 °C. The improvement of mechanical properties is attributed to grain refining, solute strengthening, and the enhanced precipitation hardening of Zn2Zr3 phase and β-type phase.
-
(5) An Arrhenius model is established to quantify the effect of deformation temperature and strain rate on the flow stress of the Mg–0.43Nd–0.12Y–0.08Zn–0.11Zr alloy:
 $\sigma = {\left( {169.69\dot \varepsilon \exp \left( {223045{\rm{/}}RT} \right)} \right)^{0.098}}$
. The stress exponent value and activation energy value are higher than those of Y-free alloy.

ACKNOWLEDGMENTS
This work is supported by National Key Research and Development Program of China (No. 2016YFB0701205), Science Innovation Foundation of Shanghai Academy of Spaceflight Technology (Nos. SAST2015047 and SAST2016048).