1. Introduction
As human activities expand in high-latitude regions, large floating ice sheets over bodies of water are increasingly used to support transportation systems. In these areas, seasonal roads are built on the ice to facilitate the transport of goods to remote locations. When the ice sheets are thick enough, they can even support the takeoff and landing of large aircraft. Therefore, it is essential to investigate their dynamic behaviour under moving loads to ensure the safe and efficient use of these floating ice sheets.
Aircraft taking off or landing, as well as vehicles travelling on floating ice sheets, can be classified as mobile pressure sources. These dynamic sources generate waves that propagate along the ice–fluid interface, known as hydroelastic or flexural-gravity waves. Hydroelastic waves are grounded in classical water wave theory, incorporating additional considerations for elastic effects present at the free surface and elucidating fluid–structure interactions. Research on hydroelastic waves dates back to a paper published by Greenhill (Reference Greenhill1886), in which he derived the dispersion relation for waves occurring in deformable, homogeneous ice sheets of infinite extent, resting on an incompressible, inviscid fluid of constant depth. During World War II, there were endeavours to use floating ice sheets as platforms for mechanised transportation systems (Kubo Reference Kubo1980). This initiative prompted extensive theoretical and experimental investigations into the effects of loads moving across floating ice sheets.
The seminal experiments conducted by Wilson (Reference Wilson1958) on Mille Lacs in Minnesota marked the beginning of modern research on vehicles travelling on ice sheets. The experimental data derived from Wilson’s investigations demonstrate that when a vehicle traverses the ice at the minimum phase velocity of hydroelastic waves, the resultant deflection of the ice sheet is at least three times greater than the static deflection. This observation substantiates the existence of a critical velocity necessary for such dynamic interactions. Moreover, the waveform recorded during the experiment indicates that the maximum deflection does not occur directly beneath the vehicle. Building on the experimental data gathered from Lake Diefenbaker, Eyre (Reference Eyre1977) categorised the ice’s response to a moving load into four distinct modes: quasi-static, symmetric transition, asymmetric transition and wave-generating modes. Notably, the critical velocity identified in Eyre’s experimental data is consistent with the theoretical predictions for deep water proposed by Kheysin (Reference Kheysin1963). In addition, Beltaos (Reference Beltaos1981) conducted similar experiments at Joseph Lake and Cold Lake to qualitatively characterise the deflection profiles that emerge when a load moves across an ice sheet. Distinguishing his methodology from that of previous researchers, Beltaos (Reference Beltaos1981) employed a deflectometer using a slope transducer for his measurements. Based on the work of Eyre (Reference Eyre1977) through field measurements at Lake Saroma, Takizawa (Reference Takizawa1985) identified five stages of deflection patterns: quasi-static, early-transition, late-transition, two-wave and single-wave stages. Takizawa also highlighted the significance of the lag between the load and the maximum ice deflection, providing a detailed discussion of this phenomenon. The water depth in Eyre’s experiments is
 $36\,\mathrm{m}$
, that in Takizawa’s experiments is
 $6.8\,\mathrm{m}$
, and those in Beltaos’ experiments are
 $4\,\mathrm{m}$
,
 $11\,\mathrm{m}$
,
 $27\,\mathrm{m}$
and
 $54\,\mathrm{m}.$
All of these experiments fall under finite water depth conditions. By contrast, the experiments conducted by Squire et al. (Reference Squire, Robinson, Langhorne and Haskell1988) near McMurdo Sound took place in waters ranging from 350 to 450 m deep. Additionally, Squire et al. (Reference Squire, Robinson, Haskell and Moore1985) introduced innovative measurement instrumentation, using specially developed strain gauges to monitor the effects of moving loads. Advances in technology have led to the development of new measurement methods, culminating in the recent application of satellite synthetic-aperture radar by Van Der Sanden & Short (Reference Van Der Sanden and Short2017) to measure ice sheet displacements, which represents a novel experimental approach.
Early theoretical investigations primarily concentrated on linear theory. Kheysin (Reference Kheysin1963) analysed the deflection of a plate caused by point and line loads moving at uniform speeds. His study identified two critical velocities at which the deflection becomes unbounded for line-load configurations. However, he incorrectly claimed that no critical velocities exist for point loads. Nevel (Reference Nevel1970) extended Kheysin’s analysis to a load uniformly distributed over a circular area, correcting the error from the earlier work. Davys, Hosking & Sneyd (Reference Davys, Hosking and Sneyd1985) theoretically explored the steady far-field waves generated by a steadily moving load on an ice sheet, using asymptotic Fourier analysis to reveal complex wave patterns. Milinazzo, Shinbrot & Evans (Reference Milinazzo, Shinbrot and Evans1995) built upon the findings of Davys et al. (Reference Davys, Hosking and Sneyd1985) by examining the steady response of ice sheets to the uniform motion of a rectangular load. His numerical results were consistent with the experimental observations made by Takizawa (Reference Takizawa1985).
While these linear theories partially align with experimental observations, notable discrepancies persist between theoretical predictions and experimental measurements, particularly near the critical velocity. This gap has prompted researchers to explore more complex models incorporating additional physical effects. Early studies primarily treated ice sheets as elastic thin plates, which led to the initial exploration of viscoelastic effects. Several methods have since been developed to integrate these viscoelastic effects into the models. Hosking, Sneyd & Waugh (Reference Hosking, Sneyd and Waugh1988) established a viscoelastic model that uses a memory function. This model demonstrates that viscoelastic effects result in a finite response at the critical velocity and explains the observed lag in maximum deflection just behind the load. Wang, Hosking & Milinazzo (Reference Wang, Hosking and Milinazzo2004) extended this viscoelastic model to address time-dependent scenarios involving an impulsively applied load. Additionally, Zhestkaya (Reference Zhestkaya1999) incorporated viscoelastic effects by modelling the ice sheet as a Kelvin–Voigt material and introducing a relaxation time. More recently, Dinvay, Kalisch & Părău (Reference Dinvay, Kalisch and Părău2022) derived linear analytical solutions for the two above-mentioned viscoelastic models and conducted a comparative analysis of their numerical results under a moving load.
In addition to viscoelasticity, nonlinear effects can also be significant as the velocity approaches the critical value. Părău & Dias (Reference Părău and Dias2002) explored these nonlinear effects, finding that, similar to viscosity, nonlinearity can limit ice deflection to finite values when the moving load is near the criticality. Bonnefoy, Meylan & Ferrant (Reference Bonnefoy, Meylan and Ferrant2009) employed a higher-order spectral method to calculate the nonlinear response of the ice sheet to a moving load in two dimensions. Their results closely aligned with those of Părău & Dias (Reference Părău and Vanden-Broeck2002). Dinvay, Kalisch & Părău (Reference Dinvay, Kalisch and Părău2019) developed a fully dispersive, weakly nonlinear model to study the response of a floating elastic plate to a moving load, incorporating factors such as damping, nonlinearity and external forcing. The numerical results from this model show good agreement with experimental observations. Johnsen, Kalisch & Părău (Reference Johnsen, Kalisch and Părău2022) extended the work of Dinvay et al. (Reference Dinvay, Kalisch and Părău2019) to investigate the wave patterns induced by loads moving on ice sheets along curved paths. However, Meng & Wang (Reference Meng and Wang2022) criticised this model, pointing out that by only including nonlinear terms up to the second order, the resulting nonlinear Schrödinger equation differs from that derived from the full Euler equations. To tackle this issue, Meng & Wang (Reference Meng and Wang2022) proposed a cubic model that incorporates nonlinear terms up to the third order for two-dimensional (2-D) problems. The cubic model was validated against experimental data from Takizawa (Reference Takizawa1985) and Squire et al. (Reference Squire, Robinson, Langhorne and Haskell1988), demonstrating its effectiveness in capturing the responses of ice sheets under moving loads.
In addition to viscoelastic and nonlinear effects, Miles & Sneyd (Reference Miles and Sneyd2003) demonstrated that accelerating a load to pass the critical velocity can prevent the singularity predicted by linear theory for a constant-moving load. Hosking & Milinazzo (Reference Hosking and Milinazzo2022) expanded on Miles & Sneyd’s research and found that the singularity also disappears when a load decelerates through the criticality. Their findings indicate that a load decelerating from supercritical speed towards rest can result in constructive interference, significantly increasing the magnitude of deflection. Similar results were reported by Dinvay et al. (Reference Dinvay, Kalisch and Părău2019). Shishmarev et al. (Reference Shishmarev, Serykh, Naydenova and Virts2022) investigated the response of a porous ice plate to moving loads using the linear theory of hydroelasticity and revealed that porosity has a damping effect. Notably, three-dimensional (3-D) theory indicates that the long-wave limiting velocity differs from the critical velocity (Milinazzo et al. Reference Milinazzo, Shinbrot and Evans1995), which marks a significant deviation from the 2-D case. Moreover, a 3-D system offers more pathways for energy transfer compared with a 2-D system, resulting in a shorter response time when an impulsive load is applied (Nugroho et al. Reference Nugroho, Wang, Hosking and Milinazzo1999). Therefore, the effects of three-dimensionality are also significant and should not be overlooked.
In addition to investigations of continuous ice sheets, recent research has increasingly focused on fragmented ice sheets. Guyenne & Părău (Reference Guyenne and Părău2017) proposed a numerical model to simulate the propagation of nonlinear ocean waves through fragmented sea ice. In this model, fragmented sea ice is represented by allowing spatial variations in the coefficient of flexural rigidity. Two-dimensional numerical simulations were conducted to examine how solitary waves are attenuated through scattering in an irregular array of ice floes. Subsequently, Guyenne & Părău (Reference Guyenne and Părău2017) introduced diffusion terms into the governing equations to account for viscous dissipation in the ice, allowing for an analysis of how both scattering and damping contribute to the attenuation of solitary waves. Building on the work of Guyenne & Părău (Reference Guyenne and Părău2017), Xu & Guyenne (Reference Xu and Guyenne2023) further explored the effects of nonlinearity on wave groups propagating through a fragmented ice field. Their consideration of inertia in the water–ice model provides a basis for the present study.
In this paper, we build upon the research conducted by Dinvay et al. (Reference Dinvay, Kalisch and Părău2019) and Meng & Wang (Reference Meng and Wang2022) by improving the fully dispersive, weakly nonlinear model. Our enhancements involve the incorporation of more effective nonlinearities (including cubic nonlinear terms associated with the Dirichlet–Neumann operator and fully nonlinear elasticity), generalisation of the model to three dimensions, and improvements to its viscous terms. This newly proposed model, which we refer to as the cubic model, is used to numerically evaluate the response of ice sheets to a uniformly moving load under controlled experimental conditions through the pseudo-spectral method. The numerical results are compared with experimental observations, confirming the model’s effectiveness. Furthermore, we use the cubic model to simulate the response of ice sheets to uniformly accelerated and decelerated loads. These results are then compared withthe exact solutions derived from linear theory, further demonstrating the model’s capability to address time-dependent problems.
The structure of the paper is organised as follows. In the next section, we derive the governing equations for the 3-D hydroelastic wave problem and discuss the dispersion relation when viscous effects are neglected. Section 3 presents the exact solution of the linearised system using the Fourier and Laplace transforms. In § 4, we develop the cubic model in three dimensions and establish the BRDS equation for both the quadratic and cubic models. The quadratic model referenced here is similar to the one proposed by Dinvay et al. (Reference Dinvay, Kalisch and Părău2019), although it incorporates a more complicated elastic bending model. Additionally, by comparing with the Euler equations, we confirm that the cubic model is significantly more accurate than the quadratic one. Section 5 further demonstrates the effectiveness of the cubic model by comparing its results with experimental observations. Sections 6.1 and 6.2 use the cubic model to simulate the response of ice sheets to uniformly accelerating and decelerating loads, respectively. Finally, § 7 provides a summary of our findings.
2. Formulation
We conceptualise the ice sheet as a thin elastic plate of thickness
 $d$
, floating atop an inviscid and incompressible fluid with a depth
 $h$
. We introduce a Cartesian coordinate system
 $(x,y,z)$
, where the
 $z$
-axis is oriented vertically upwards, opposing the direction of gravity. The initially quiescent system features a flat, impermeable bottom at
 $z=-h$
. The surface of the fluid, which also serves as the interface between the fluid and the ice sheet, is described by
 $z=\eta (x,y,t)$
, where
 $t$
represents time. Furthermore, we assume that the fluid motion is irrotational, allowing us to introduce a velocity potential function
 $\phi (x,y,z,t)$
that satisfies the 3-D Laplace equation:
 \begin{equation} \phi _{xx}+\phi _{yy}+\phi _{zz}=0\quad \text{for}\quad -h\lt z\lt \eta (x,y,t), \end{equation}
with the impermeability boundary condition at the bottom given by
 \begin{equation} \phi _z=0,\quad \text{at}\quad z=-h. \end{equation}
Here, the subscripts indicate differentiation with respect to the corresponding variables. The kinematic and dynamic conditions at the free surface,
 $z=\eta (x,y,t)$
, are given by the following equations:
 \begin{equation} \eta _t=\phi _z-\boldsymbol{\nabla }\!\eta \boldsymbol{\cdot }\boldsymbol{\nabla }\!\phi \end{equation}
and
 \begin{equation} \phi _t+\frac {1}{2}\big (\phi _x^2+\phi _y^2+\phi _z^2\big)+g\eta +\frac {P}{\rho }=p, \end{equation}
where
 $\boldsymbol{\nabla }=(\partial _x,\partial _y)$
denotes the horizontal gradient operator,
 $P$
represents the pressure resulting from the deformation of the ice sheet,
 $p$
is the pressure exerted by the moving load,
 $g$
is the acceleration due to gravity and
 $\rho$
is the fluid density. The load
 $p$
is treated as a distributed pressure that moves along the
 $x$
-axis at a velocity
 $X'(t)$
, defined as
 \begin{equation} p(x,y,t)=\rho f\left (x-X(t),y\right )\!. \end{equation}
In this paper, we define the function
 $f$
as a Gaussian function:
 $f(x,y)=q e^{-(x^2+y^2)}$
, where
 $q$
is a constant determined by the experimental conditions.
The term associated with the vibration of ice sheets, referred to as
 $P$
, involves multiple factors: inertia, elastic bending and viscous dissipation. Modelling the effects of viscoelasticity is complex, while inertia can be addressed more straightforwardly. According to Plotnikov & Toland (Reference Plotnikov and Toland2011), the pressure jump across the free surface resulting from bending can be determined by minimising the total elastic potential energy. Specifically, this can be expressed using a variational derivative, noted as
 $\delta E_b/\delta \eta$
, where
 $E_b$
is defined as
 \begin{equation} E_b=\frac 12\int (\kappa _1+\kappa _2)^2\,{\rm d}S. \end{equation}
In this expression,
 $\kappa _1$
and
 $\kappa _2$
represent the local principal curvatures of the surface,
 ${\rm d}S$
stands for the surface element and the flexural rigidity is given by
 $\mathcal{D}=Ed^3/12(1-\nu ^2)$
, where
 $E$
is Young’s modulus and
 $\nu$
is Poisson’s ratio. In a Cartesian coordinate system, the variational derivative of elastic energy with respect to surface displacement is formulated as
 \begin{equation} \begin{aligned} \frac {\delta E_b}{\delta \eta }=&\,-2\partial _x\! \left (\kappa \frac {\eta _x\eta _{yy}-\eta _y\eta _{xy}}{J}\right )-2\partial _y\! \left (\kappa \frac {\eta _y\eta _{xx}-\eta _x\eta _{xy}}{J}\right ) -2\partial _{xy}\! \left (\kappa \frac {\eta _x\eta _y}{J}\right )\\ &\,+\partial _{xx}\! \left (\kappa \frac {1+\eta _y^2}{J}\right )+\partial _{yy}\! \left (\kappa \frac {1+\eta _x^2}{J}\right )+\frac 52\partial _x\! \left (\kappa ^2\frac {\eta _x}{\sqrt {J}}\right )+\frac 52\partial _y\! \left (\kappa ^2\frac {\eta _y}{\sqrt {J}}\right )\!, \end{aligned} \end{equation}
where
 $J=1+\eta _x^2+\eta _y^2$
and
 \begin{equation} \kappa =\kappa _1+\kappa _2=\frac {(1+\eta _x^2)\eta _{yy}+(1+\eta _y^2)\eta _{xx}-2\eta _x\eta _y\eta _{xy}}{J^{3/2}}. \end{equation}
In this study, we treat the ice sheet as an isotropic material for several reasons. First, incorporating material anisotropy introduces significant complexity through additional elastic parameters, complicating the formulation of a mathematical model for the normal stress distribution. Second, experimental measurements by Takizawa (Reference Takizawa1985) indicate that the difference between the longitudinal and transverse elastic moduli of ice sheets is negligible. Additionally, Squire et al. (Reference Squire, Hosking, Kerr and Langhorne1996) pointed out that the effective elastic modulus is more physically relevant for characterising the behaviour of ice under moving loads than the true modulus. Therefore, this paper adopts a simplified isotropic model, using the effective elastic modulus derived from experimental data.
As mentioned in the introduction, researchers have recognised the significance of energy dissipation in modelling hydroelastic waves. Various methods have been developed to incorporate these effects into the modelling process. A widely used approach considers the ice cover as a Kelvin–Voigt material, characterised by purely elastic behaviour over long time scales along with additional resistance to rapid deformation. This model introduces a strain relaxation time, denoted as
 $\tau _{\!f}$
, which modifies the elastic restoring force from
 $\mathcal{D}{\nabla} ^4\eta$
to
 $\mathcal{D}(1+\tau _{\!f} \partial _t){\nabla} ^4\eta$
. An alternative viscoelastic model, employed by Hosking et al. (Reference Hosking, Sneyd and Waugh1988) and Wang et al. (Reference Wang, Hosking and Milinazzo2004), uses a memory function based on a two-parameter Boltzmann hereditary integral delay in accordance with the fading memory hypothesis. In this paper, we adopt a simplified formulation. The dissipative force is assumed to comprise two components: one that is proportional to the vertical velocity, expressed as a linear damping term
 $b\eta _t$
(where
 $b$
is a constant viscosity coefficient), and the other that captures the rate-dependent stiffening of the Kelvin–Voigt model, represented as
 $\mathcal{D}\tau _{\!f} \partial _t{\nabla} ^4\eta$
. The physical justification for retaining the latter term will be elaborated in subsequent sections. Considering both the inertia and viscoelasticity of the ice sheet, the dynamic boundary condition is expressed as follows:
 \begin{equation} \phi _t+\frac {1}{2}\big (\phi _x^2+\phi _y^2+\phi _z^2\big )+g\eta +\frac {\rho _i d}{\rho }\eta _{tt}+\frac {b}{\rho }\eta _t+\frac {\mathcal{D}}{\rho }\tau _{\!f}\partial _t{\nabla} ^4\eta +\frac {\mathcal{D}}{\rho }\left (\frac {\delta E_b}{\delta \eta }\right )=f, \end{equation}
where
 $\rho _i$
denotes the density of the ice and
 $\rho _id\eta _{tt}/\rho$
signifies the term related to inertia.
To establish a clear physical context for critical velocity, we begin with a brief overview of the dispersion relation. By neglecting the dissipation terms and linearising the model described in (2.1)–(2.4), we derive the dispersion relation for hydroelastic waves in water of finite depth:
 \begin{equation} \omega ^2=\frac {g|\boldsymbol{k}|+\frac {\mathcal{D}}{\rho }|\boldsymbol{k}|^5}{d'|\boldsymbol{k}|+\coth (h|\boldsymbol{k}|)}, \end{equation}
where
 $d'=\rho _id/\rho$
,
 $\omega$
represents the angular frequency and
 $\boldsymbol{k}=(k,l)$
is the wavenumber vector, with
 $|\boldsymbol{k}|=\sqrt {k^2+l^2}$
. From the dispersion relation (2.10), it is evident that hydroelastic waves are isotropic, meaning that the phase velocity aligns with the direction of the group velocity. The magnitudes of these velocities are given by
 \begin{equation} c_{\!p}=\frac {\omega }{|\boldsymbol{k}|}\quad \text{and}\quad c_{\!g}=\frac {\mathrm{d}\omega }{\mathrm{d}|\boldsymbol{k}|} \end{equation}
for the phase and group velocities, respectively. In the case of water of infinite depth, the dispersion relation reduces to
 \begin{equation} \omega ^2=\frac {g|\boldsymbol{k}|+\frac {\mathcal{D}}{\rho }|\boldsymbol{k}|^5}{d'|\boldsymbol{k}|+1}. \end{equation}
As illustrated in figure 1, the magnitude of the phase velocity reaches a global minimum at a specific finite wavenumber, referred to as
 $c_{\textit{min}}$
. This phenomenon occurs regardless of the fluid depth, where the group and phase velocities intersect. The speed at which this intersection happens is known as the critical velocity. For example, in the case of infinite water depth, if we neglect inertia, the critical velocity can be expressed in terms of flexural rigidity and water density as
 \begin{equation} c_{\textit{min}}=2\left (\frac {\mathcal{D}g^3}{27\rho }\right )^{\frac {1}{8}}\!. \end{equation}
We note that the parameters used for the plots in figure 1 are derived from two well-known experiments (see table 1): the shallow-water experiment conducted in Lake Saroma in Hokkaido, Japan (Takizawa Reference Takizawa1985) and the deep-water experiment carried out in McMurdo Sound, Antarctica (Squire et al. Reference Squire, Robinson, Langhorne and Haskell1988).
Physical parameters for two experiments in shallow and deep fluids: Lake Saroma in Hokkaido, Japan (Takizawa Reference Takizawa1985) and McMurdo Sound in Antarctica (Squire et al. Reference Squire, Robinson, Langhorne and Haskell1988).

Linear theories typically fail near the critical velocity, as they predict that the response of the ice sheet to a moving load at this speed becomes unbounded. It is important to differentiate this from another ‘critical’ velocity in shallow water known as the long-wave limit, denoted as
 $c_0=\sqrt {gh}$
. To understand the origin of this specific velocity, we can refer to figure 1(a). The wave generation regimes can be analysed by examining the intersection points between a horizontal line representing the load velocity
 $U$
and the phase velocity curve
 $c_{\!p}(|\boldsymbol{k}|)$
. When
 $U$
is less than the critical velocity
 $c_{\textit{min}}$
, the horizontal line does not intersect the phase velocity curve, indicating that no linear waves are generated. For the range
 $c_{\textit{min}}\lt U\lt c_0$
, there are two intersections, signifying that two types of waves can propagate at the same velocity. The short waves are primarily flexural waves, characterised by a group velocity greater than
 $U$
and occurring ahead of the load. In contrast, the long waves are dominated by gravity waves, which exhibit a group velocity that is less than
 $U$
and are located behind the load. When
 $U\gt c_0$
, a single intersection occurs, indicating that waves are generated only in front of the load, with no waves produced behind it. This region is referred to as the shadow zone, a phenomenon that was first predicted by Davys et al. (Reference Davys, Hosking and Sneyd1985).
Phase speed
 $c_{\!p}$
(black lines) and group speed
 $c_{\!g}$
(blue lines) against wavenumber
 $|\boldsymbol{k}|$
: (a) the parameters derived from the experiments of Takizawa (Reference Takizawa1985); (b) the parameters derived from the experiments of Squire et al. (Reference Squire, Robinson, Langhorne and Haskell1988). The dashed lines illustrate the scenarios without inertia, contrasting with the solid lines that include the inertial effect. The vertical and horizontal axes are measured in m s−1 and
 $\mathrm{m}^{-1}$
, respectively.

The hydroelastic wave system under analysis consists of (2.1) along with the boundary conditions (2.2)–(2.3) and (2.9). For simplicity, we non-dimensionalise the primitive equations using
 \begin{equation} \left (\frac {\mathcal{D}}{\rho g}\right )^{\frac 14}\!,\quad \left ( \frac {\mathcal{D}}{\rho g^5}\right )^{\frac 18}\!,\quad \left (\frac {\mathcal{D}^3g}{\rho ^3}\right )^{\frac 18} \end{equation}
as the units of length, time and velocity potential, respectively. After this rescaling, (2.1)–(2.3) remain unchanged, while the dynamic boundary condition (2.9) is modified to
 \begin{equation} \phi _t+\frac 12\big (\phi _x^2+\phi _y^2+\phi _z^2\big )+\eta +\alpha \eta _{tt}+\beta \eta _t+ \gamma \partial _t{\nabla} ^4\eta +\frac {\delta E_b}{\delta \eta }=f, \end{equation}
where the coefficients of inertia, viscosity and relaxation time are represented respectively by
 \begin{equation} \alpha =\frac {\rho _id}{\rho }\!\left (\frac {\rho g}{\mathcal{D}}\right )^{\frac 14}\!,\quad \beta =\frac {b}{\rho }\!\left (\frac {\rho }{\mathcal{D}g^3}\right )^{\frac 18}\!,\quad \gamma =\tau _{\!f}\!\left (\frac {\rho g^5}{\mathcal{D}}\right )^{\frac 18}\!. \end{equation}
3. Analytical solution of the linearised system
Given the complexity of the governing equation (2.15) and the free-boundary nature of water waves, it is practical to first investigate the linearised problem before progressing to more advanced analyses. Following the works of Miles & Sneyd (Reference Miles and Sneyd2003), Hosking & Milinazzo (Reference Hosking and Milinazzo2022) and Johnsen et al. (Reference Johnsen, Kalisch and Părău2022), we explore the linear system in three dimensions. We begin our analysis by linearising (2.1)–(2.3) and (2.15). Then, we apply the Fourier and Laplace transforms to the resultant equations, which leads to
 \begin{align} \varPhi _{zz}-|\boldsymbol{k}|^2\varPhi =0 \quad &\text{for} \quad -h\lt z\lt \eta, \nonumber \\ \varPhi _z=0,\quad &\text{at} \quad z=-h, \nonumber\\ \varPhi _z=\textit{sH},\quad &\text{at} \quad z=0, \nonumber \\ s\varPhi +\big(1+|\boldsymbol{k}|^4+\alpha s^2+\beta s+\gamma |\boldsymbol{k}|^4s\big )H=F, \quad &\text{at} \quad z=0, \end{align}
where
 \begin{equation} [\varPhi ,H,F]=\int _{-\infty }^{\infty }\int _{-\infty }^{\infty }e^{-\mathrm{i}(kx+ly)}\,{\rm d}x{\rm d}y\int _{0}^{\infty }e^{-st}[\phi ,\eta ,f]\,{\rm d}t\,. \end{equation}
Then, we can easily obtain the solution given by the following expressions:
 \begin{equation} \varPhi =\textit{sH}\frac {\cosh (|\boldsymbol{k}|(z+h))}{|\boldsymbol{k}|\sinh (|\boldsymbol{k}|h)},\quad H=\frac {F|\boldsymbol{k}|\text{tanh}(|\boldsymbol{k}|h)}{\left [1+\alpha |\boldsymbol{k}|\text{tanh}(|\boldsymbol{k}|h)\right ]\left [(s+b_1)^2+b_2^2\right ]}, \end{equation}
where
 $b_1$
and
 $b_2$
are Fourier symbols representing the corresponding pseudo-differential operators, defined as
 \begin{align} &b_1(k,l)=\frac {\left (\beta +\gamma |\boldsymbol{k}|^4\right )|\boldsymbol{k}|\text{tanh}(|\boldsymbol{k}|h)}{2\left [1+\alpha |\boldsymbol{k}|\text{tanh}(|\boldsymbol{k}|h)\right ]}, \\[-12pt]\nonumber \end{align}
 \begin{align} &b_2(k,l)=\sqrt {\frac {\left (1+|\boldsymbol{k}|^4\right )|\boldsymbol{k}|\text{tanh}(|\boldsymbol{k}|h)}{1+\alpha |\boldsymbol{k}|\text{tanh}(|\boldsymbol{k}|h)}-b_1^2}. \end{align}
The time evolution of the free surface, starting from a calm state, can be obtained by performing the inverse Fourier and Laplace transformations. Taking the inverse Laplace transform of
 $H$
yields
 \begin{equation} \widehat {\eta }=\mathscr{L}^{\,-1}\!\left [ \frac {|\boldsymbol{k}|\text{tanh}(|\boldsymbol{k}|h)}{(s+b_1)^2+b_2^2} \right ]*\left [\frac {\widehat {f}}{1+\alpha |\boldsymbol{k}|\text{tanh}(|\boldsymbol{k}|h)}\right ]\!, \end{equation}
where the hat indicates the Fourier transform and
 $\mathscr{L}$
denotes the Laplace transform. In this equation, we have used the convolution theorem, which simplifies the solution to a more computationally manageable form. The first part of the convolution can be solved analytically as
 \begin{equation} \mathscr{L}^{\,-1}\!\left [\frac {|\boldsymbol{k}|\text{tanh}(|\boldsymbol{k}|h)}{(s+b_1)^2+b_2^2}\right ]=\frac {|\boldsymbol{k}|\text{tanh}(|\boldsymbol{k}|h)}{b_2}e^{-b_1t}\sin (b_2t). \end{equation}
It then follows that
 \begin{equation} \eta =\mathscr{F}^{\,-1}\!\left \{\frac {|\boldsymbol{k}|\text{tanh}(|\boldsymbol{k}|h)}{b_2\left [1+\alpha |\boldsymbol{k}|\text{tanh}(|\boldsymbol{k}|h)\right ]}\int _{0}^{t}e^{-b_1(t-\tau )}\sin [b_2(t-\tau )]\widehat {f}(\tau )\,{\rm d}\tau \right \}\!, \end{equation}
where
 $\mathscr{F}$
also denotes the Fourier transform. For the convenience of subsequent numerical computations, the time integral component of the solution can be decomposed as
 \begin{align} \eta =\mathscr{F}^{\,-1}\!\left \{\frac {|\boldsymbol{k}|\text{tanh}(|\boldsymbol{k}|h)}{2\mathrm{i}b_2\left [1+\alpha |\boldsymbol{k}|\text{tanh}(|\boldsymbol{k}|h)\right ]}\int _{0}^{t}\left [e^{-(b_1-\mathrm{i}b_2)(t-\tau )}-e^{-(b_1+\mathrm{i}b_2)(t-\tau )}\right ]\widehat {f}(\tau )\,{\rm d}\tau \right \}\!. \end{align}
Defining
 \begin{align} I_1(t)=\int _0^te^{-(b_1-\mathrm{i}b_2)(t-\tau )}\widehat {f}(\tau )\,{\rm d}\tau \quad \text{and}\quad I_2(t)=\int _0^t e^{-(b_1+\mathrm{i}b_2)(t-\tau )}\widehat {f}(\tau )\,{\rm d}\tau , \end{align}
the following recursive formulae can be directly established:
 \begin{align} I_1(T_{n+1})=&\,e^{-(b_1-\mathrm{i}b_2)\Delta T}I_1(T_{n})+\int _{T_n}^{T_{n+1}}e^{-(b_1-\mathrm{i}b_2)(T_{n+1}-\tau )}\widehat {f}(\tau )\,{\rm d}\tau, \\[-12pt]\nonumber \end{align}
 \begin{align} I_2(T_{n+1})=&\,e^{-(b_1+\mathrm{i}b_2)\Delta T}I_2(T_{n})+\int _{T_n}^{T_{n+1}}e^{-(b_1+\mathrm{i}b_2)(T_{n+1}-\tau )}\widehat {f}(\tau )\,{\rm d}\tau, \end{align}
where
 $T_n$
and
 $T_{n+1}$
are time nodes for numerical simulations, and
 $\Delta T$
is the time step. The solution (3.9) will be used to validate the cubic nonlinear model in later discussions.
4. Modelling and validation
4.1. DNO-truncation models
Following the seminal work of Craig & Sulem (Reference Craig and Sulem1993), which builds on the canonical variables introduced by Zakharov (Reference Zakharov1972), the kinematic and dynamic boundary conditions (2.3) and (2.9) can be recast in terms of the velocity potential at the ice–water interface, defined as
 $\xi (x,y,t)=\phi (x,y,\eta ,t)$
, and the surface displacement
 $\eta$
. To begin, we introduce the Dirichlet–Neumann operator (DNO), which provides the normal velocity at the free surface, as follows:
 \begin{equation} G(\eta ,h)\xi =\big (\phi _z-\phi _x\eta _x-\phi _y\eta _y\big )_{z=\eta }. \end{equation}
It is clear that the kinematic boundary condition can be expressed succinctly as
 $\eta _t=G(\eta ,h)\xi$
. We suppress the dependence of
 $G$
on
 $\eta$
and
 $h$
for simplicity of notation hereafter. By using the DNO, we can subsequently rewrite the dynamic boundary condition as
 \begin{equation} \begin{aligned} \xi _t=&\;\frac {1}{2\big (1+|\boldsymbol{\nabla }\eta |^2\big )}\big [(G\xi )^2+2(G\xi )\left (\boldsymbol{\nabla }\eta \boldsymbol{\cdot }\boldsymbol{\nabla }\xi \right )-|\boldsymbol{\nabla }\xi |^2\big ]\\ &\;-\alpha (G\xi )_t-\beta G\xi -\gamma \Delta ^2G\xi -\eta -\frac {\delta E_b}{\delta \eta }+f, \end{aligned} \end{equation}
where
 $\varDelta$
is the horizontal Laplace operator defined as
 $\varDelta =\boldsymbol{\nabla }\boldsymbol{\cdot }\boldsymbol{\nabla}$
. This approach offers a significant simplification by reducing the 3-D nonlinear wave problem to a 2-D one that is defined solely at the free surface. It also eliminates the need to solve the Laplace equation throughout the entire fluid domain, thereby removing the dependence on the vertical coordinate
 $z$
.
Coifman & Meyer (Reference Coifman and Meyer1985) demonstrated that if both the
 $L^{\infty }$
-norm and the Lipschitz-norm of
 $\eta$
are less than a specified constant, then
 $G$
is an analytic function of
 $\eta$
. As a result, the DNO can be expressed as a Taylor series in
 $\eta$
, represented as
 $G=\varSigma _{j=0}^\infty G_{\!j}(\eta ,h)$
, where
 $G_{\!j}(\eta ,h)$
is homogeneous of degree
 $j$
in
 $\eta$
. Again, we omit the dependence of
 $G_{\!j}$
on
 $\eta$
and
 $h$
for brevity. For finite depth, the first three terms of the Taylor series are given by
 \begin{align} &G_0=|D|\text{tanh}(h|D|), \\[-12pt]\nonumber \end{align}
 \begin{align} &G_1=D\boldsymbol{\cdot }\eta D-G_0\eta G_0, \\[-12pt]\nonumber \end{align}
 \begin{align} &G_2=-\frac 12\big [G_0\eta ^2|D|^2+|D|^2\eta ^2G_0-2G_0\eta G_0\eta G_0\big], \end{align}
where
 $D=-\mathrm{i}\boldsymbol{\nabla}$
and
 $|D|=(-\varDelta )^{(1/2)}$
. In the case of infinite water depth, the leading-order operator
 $G_0=|D|$
, while the forms for
 $G_1$
and
 $G_2$
remain unchanged from their counterparts in the finite depth scenario. By substituting the expansion of
 $G$
into the boundary conditions and truncating all terms involving
 $\xi$
to cubic order, we obtain
 \begin{equation} \eta _t=\left (G_0+G_1+G_2\right )\xi \end{equation}
and
 \begin{align} M\xi _t=&\;\frac 12\big [(G_0\xi )^2-|\boldsymbol{\nabla }\xi |^2+2(G_0\xi )(G_1\xi )+2(G_0\xi )\left (\boldsymbol{\nabla }\eta \boldsymbol{\cdot }\boldsymbol{\nabla }\xi \right )\big] \nonumber\\ &\;-\eta +\alpha \left [\boldsymbol{\nabla }\boldsymbol{\cdot }\left (G_0\xi +G_1\xi \right )\boldsymbol{\nabla }\xi +G_0\left (G_0\xi +G_1\xi \right )G_0\xi \right ] \nonumber\\ &\;-\alpha \big [G_0\left (G_0\xi \right )\left (\eta \Delta \xi +G_0\eta G_0\xi \right )+\Delta \eta \left (G_0\xi \right )^2+G_0\eta G_0\left (G_0\xi \right )^2\big] \nonumber\\ &\;-\big (\beta +\gamma \Delta ^2\big )\left (G_0+G_1+G_2\right )\xi -\frac {\delta E_b}{\delta \eta }+f, \end{align}
where
 $M=1+\alpha (G_0+G_1+G_2)$
is a pseudo-differential operator. For numerical convenience, both sides of (4.7) are multiplied by the inverse operator
 $M^{-1}$
, which can be formally expanded as
 \begin{equation} M^{-1}=K^{-1}-\alpha K^{-1}(G_1+G_2)K^{-1}+\alpha ^2K^{-1}G_1K^{-1}G_1K^{-1}+{\cdots}, \end{equation}
where
 $K=1+\alpha G_0$
. For ease of notation, we define
 \begin{align} M_0=K^{-1},\quad M_1=-\alpha K^{-1}G_1K^{-1},\quad M_2=-\alpha K^{-1}\big (G_2-\alpha G_1K^{-1}G_1\big )K^{-1} \end{align}
Substituting the expansion of
 $M$
into the dynamic boundary condition (4.7) ultimately yields
 \begin{align} \begin{aligned} \xi _t=&\;M_0(G_0\xi )\left (G_1\xi +\boldsymbol{\nabla }\eta \boldsymbol{\cdot }\boldsymbol{\nabla }\xi \right )+\frac 12(M_0+M_1)\big [(G_0\xi )^2-|\boldsymbol{\nabla }\xi |^2\big ]+\alpha (M_0\\ &\;+M_1)\big [\boldsymbol{\nabla }\boldsymbol{\cdot }(G_0\xi )\boldsymbol{\nabla }\xi +G_0(G_0\xi )^2\big]+\alpha M_0\left [\boldsymbol{\nabla }\boldsymbol{\cdot }(G_1\xi )\boldsymbol{\nabla }\xi +G_0(G_1\xi )(G_0\xi )\right ]\\ &\;-\alpha M_0\big [G_0(G_0\xi )(\eta \Delta \xi +G_0\eta G_0\xi )+\Delta \eta (G_0\xi )^2+G_0\eta G_0(G_0\xi )^2\big ]\\ &\;-M_0\big (\beta +\gamma \Delta ^2\big )(G_0+G_1+G_2)\xi -M_1\big (\beta +\gamma \Delta ^2\big )(G_0+G_1)\xi \\ &\;-M_2\big (\beta +\gamma \Delta ^2\big )G_0\xi -(M_0+M_1+M_2)\left (\eta +\frac {\delta E_b}{\delta \eta }-f\right )\!. \end{aligned} \end{align}
From a mathematical perspective, further approximating the inverse operator
 $M^{-1}$
disrupts the complete retention of effects stemming from gravity, elasticity and moving force, as described in (4.7). However, this trade-off is acceptable for numerical computations, where prioritising tractability and efficiency is essential. It is also emphasised that, unlike typical weakly nonlinear models, (4.7) accurately preserves the restoring force resulting from the nonlinear elastic bending effect. Within a doubly periodic domain, the coupled system described by (4.6) and (4.10) will now be referred to as the cubic DNO-truncation model. If we neglect the cubic nonlinear terms in (4.6) and (4.10), then the resultant system is termed the quadratic DNO-truncation model, which has been numerically studied by Dinvay et al. (Reference Dinvay, Kalisch and Părău2019) with a linear elastic bending term.
These two fully dispersive models can be efficiently computed using a pseudo-spectral method for spatial discretisation, calculating all derivatives in Fourier space with spectral accuracy, while computing nonlinear terms pseudospectrally in real space. Time integration of the system is performed using a classic fourth-order Runge–Kutta method. To compute a free solitary wave when the viscous effects are neglected, we first calculate forced hydroelastic waves using the Newton–Raphson method. The external pressure is then gradually diminished while maintaining a constant wave amplitude. The resulting solution serves as an initial guess for subsequent computations in the unforced system. All the computations are de-aliased with a doubling of Fourier modes and no filters are used. For solitary waves of wavepacket type, small-amplitude solutions often present significant challenges in terms of accurate computation due to their slower spatial decay. Consequently, it is necessary to gradually expand the computational domain as the amplitude decreases (or equivalently, the solutions approach the bifurcation point).
4.2. A normal form analysis
The nonlinear Schrödinger (NLS) equation is a universal model widely used across various scientific fields, providing a standard description of the evolution of the envelope of dispersive and/or diffracting quasi-monochromatic, plane, weakly nonlinear waves. In the context of free-surface water waves, the envelope dynamics of a wave packet in the small-amplitude deep-water limit can be effectively approximated by a 2 + 1-dimensional cubic NLS equation. This equation is instrumental in predicting the Benjamin–Feir instability of wave trains and the existence of solitary wave packets. However, when conducting modulation analysis, the Benney–Roskes–Davey–Stewartson (BRDS) equation is derived for waves propagating in water of finite depth, which necessitates the inclusion of the induced mean flow (Benney & Roskes Reference Benney and Roskes1969). In this discussion, we will outline the derivation of the BRDS equation for small-amplitude hydroelastic waves, comparing the results from both the quadratic and cubic models.
Consider the hydroelastic wave problem in the absence of viscosity and externally applied pressure, which means that
 $\beta =\gamma =f=0$
in the dynamic boundary condition (2.15). For weakly nonlinear hydroelastic waves, we assume that
 $\eta \sim O(\epsilon )$
and
 $\phi \sim O(\epsilon )$
, where
 $\epsilon$
is a small parameter used to measure wave steepness. Consequently, the velocity potential function at the free surface can be expanded about
 $z=0$
as
 \begin{equation} \phi (x,y,\eta ,t)=\phi (x,y,0,t)+\eta \phi _z(x,y,0,t)+\frac 12\eta ^2\phi _{zz}(x,y,0,t)+O(\epsilon ^4)\,. \end{equation}
This allows us to express the surface boundary conditions at
 $z=0$
up to the cubic order as
 \begin{equation} \phi _z-\eta _t=\phi _x\eta _x+\phi _y\eta _y-\eta \phi _{zz}+\eta \eta _x\phi _{xz}+\eta \eta _y\phi _{yz}-\frac 12\eta ^2\phi _{zzz} \end{equation}
and
 \begin{equation} \begin{aligned} \phi _t+\big (1+\Delta ^2\big )\eta &\;+\alpha \eta _{tt}=\eta \phi _{zt}-\frac 12\phi _x^2-\frac 12\phi _y^2-\frac 12\phi _z^2-\frac 12\eta ^2\phi _{zzt}-\eta \phi _x\phi _{xz}\\ &\;-\eta \phi _y\phi _{yz}-\eta \phi _z\phi _{zy}+\frac 52\eta ^2_x\eta _{xxxx}+\frac 52\eta ^3_{xx}+10\eta _x\eta _{xx}\eta _{xxx}\,. \end{aligned} \end{equation}
This text provides a brief outline of the derivation of the BRDS equation for hydroelastic waves and for those interested in more detailed information, please refer to Milewski & Wang (Reference Milewski and Wang2013). We consider the evolution of a wave packet whose slow dependence is comparable in both the
 $x$
- and
 $y$
-directions, while its rapid oscillations occurs solely in the
 $x$
-direction. This means the wave packet will propagate along the
 $x$
-direction, exhibiting a slowly evolving structure in both the
 $x$
- and
 $y$
-directions. To derive the governing equation for the wave envelope, we introduce the following slow variables:
 $X=\epsilon x$
,
 $Y=\epsilon y$
,
 $T=\epsilon t$
and
 $\tau =\epsilon ^2 t$
, and choose
 $e^{\mathrm{i}(kx-\omega t)}$
as the carrier wave. We then seek a solution of the form
 \begin{align} &\eta =\epsilon A(X-c_{\!g}T,Y,\tau )e^{\mathrm{i}\theta }+\sum _{n=2}^\infty \epsilon ^n\sum _{j=0}^nA_{nj}(X-c_{\!g}T,Y,\tau )e^{j\mathrm{i}\theta }+\mathrm{c.c.}, \\[-12pt]\nonumber \end{align}
 \begin{align} &\phi =\sum _{n=1}^\infty \epsilon ^n\sum _{j=0}^n\phi _{nj}(X-c_{\!g}T,Y,z,\tau )e^{j\mathrm{i}\theta }+\mathrm{c.c.}, \end{align}
where
 $\theta =kx-\omega t$
represents the phase of the carrier wave and ‘c.c.’ denotes the complex conjugate. By substituting the ansatzes (4.14) and (4.15) into (4.12) and (4.13), we can derive the linear dispersion relation at the leading order:
 \begin{equation} \omega ^2=\frac {k(1+k^4)\text{tanh}(\textit{kh})}{1+\alpha k\text{tanh}(\textit{kh})}. \end{equation}
At the order of
 $O(\epsilon ^2)$
, we obtain the expression for
 $c_{\!g}$
as
 \begin{equation} c_{\!g}=\frac {(1+5k^4-\alpha \omega ^2)\text{tanh}(\textit{kh})+kh(1+k^4-\alpha \omega ^2)\text{sech}^2(\textit{kh})}{2\omega (1+\alpha k\text{tanh}(\textit{kh}))}= \frac {\mathrm{d}\omega }{\mathrm{d}k}. \end{equation}
This indicates that
 $c_{\!g}$
represents the group velocity, justifying our choice of
 $c_{\!g}$
as the velocity of the wave packet. At
 $O(\epsilon ^3)$
, the solvability condition for eliminating the secular terms yields the following non-local BRDS equation:
 \begin{equation} \mathrm{i}A_{\tau }+\frac {\omega ^{\prime \prime }}{2}A_{\textit{XX}}+\frac {c_{\!g}}{2k}A_{\textit{YY}}+\lambda _1\widetilde {\Delta }^{-1}\left [|A|^2\right ]_{\textit{XX}}A+\lambda _2|A|^2A=0, \end{equation}
where
 $\widetilde {\Delta }=(1-h^{-1}c_{\!g}^2)\partial _{\textit{XX}}+\partial _{\textit{YY}}$
. The coefficients in (4.18) are given by
 \begin{equation} \lambda _1=\frac {1}{h\left [1+\alpha k\text{tanh}(\textit{kh})\right ]}\left [k+\frac {k\omega c_{\!g}}{2\sinh (\textit{kh})\cosh (\textit{kh})}\right ]\left [\frac {\omega ^2c_{\!g}}{\sinh ^2(\textit{kh})}+\frac {2\omega }{\text{tanh}(\textit{kh})}\right ] \end{equation}
and
 \begin{equation} \begin{aligned} \lambda _2=&\;\frac {\omega k^2}{1+\alpha k\text{tanh}(\textit{kh})}\left \{\frac {g_1(k)+12\alpha k(4k^4-1)\text{tanh}(\textit{kh})}{4\text{tanh}^2(\textit{kh})g_2(k)}\right .\\ &\;\left .+\frac 12\left [\frac {1+k^4}{\sinh ^2(\textit{kh})\cosh ^2(\textit{kh})}-4\right ]\right \}+\frac {5\omega k^6}{2(1+k^4)}, \end{aligned} \end{equation}
where
 \begin{align} &g_1(k)=\big (1+k^4\big )\big [\text{tanh}^4(\textit{kh})-10\text{tanh}^2(\textit{kh})+9\big]+60k^4, \\[-12pt]\nonumber \end{align}
 \begin{align} &g_2(k)=15k^4+3\alpha k(4k^4-1)\text{tanh}(\textit{kh})-(1+k^4)\text{tanh}^2(\textit{kh}). \end{align}
If the inertia term is ignored (i.e.
 $\alpha =0$
), the coefficients align with those derived by Milewski & Wang (Reference Milewski and Wang2013). When the dependence on
 $Y$
becomes negligible – essentially reducing the problem to one horizontal dimension – the BRDS equation simplifies to the classical 1 + 1-dimensional NLS equation:
 \begin{equation} \mathrm{i}A_\tau +\frac {\omega ''}{2}A_{\textit{XX}}+\left (\frac {\lambda _1}{1-h^{-1}c_{\!g}^2}+\lambda _2\right )|A|^2A=0\,, \end{equation}
consistent with the results of Meng & Wang (Reference Meng and Wang2022). In the case of infinite water depth, the contribution from mean flow in (4.18) disappears, resulting in
 \begin{equation} \lambda _1\sim \frac {2k\omega }{h(1+\alpha k)}\to 0\quad \text{as} \quad h\to \infty \,. \end{equation}
Consequently, the BRDS equation degenerates into the classical 2 + 1-dimensional NLS equation:
 \begin{equation} \mathrm{i}A_{\tau }+\frac {\omega ^{\prime \prime }}{2}A_{\textit{XX}}+\frac {c_{\!g}}{2k}A_{\textit{YY}}+\lambda _2|A|^2A=0\,. \end{equation}
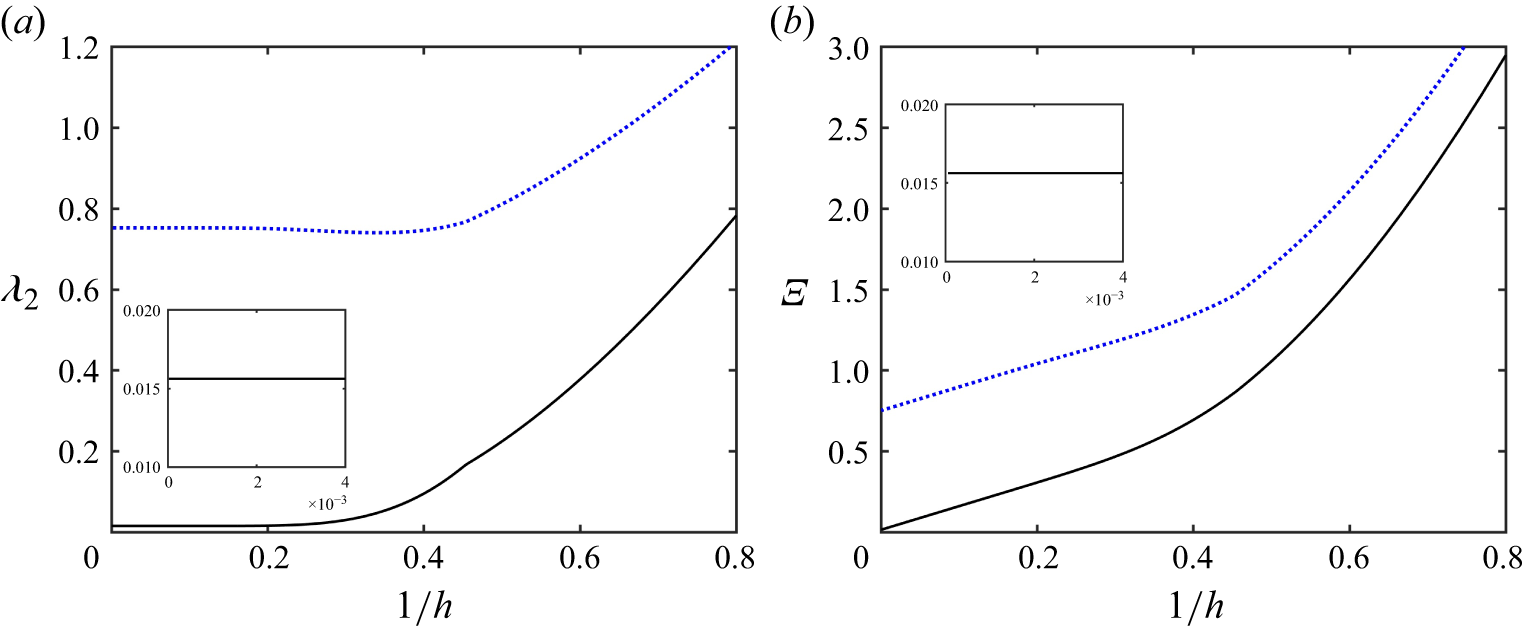
(a)
 $\lambda _2$
and (b)
 $\varXi$
versus
 $1/h$
. The blue dotted lines correspond to the quadratic model, while the black solid lines represent the cubic model. The physical parameters required for the calculations are detailed in the McMurdo Sound case in table 1.

It is important to emphasise that deriving the correct BRDS equation requires expanding the full Euler equations to cubic order. In fact, we can also obtain the BRDS equation from the quadratic DNO-truncation model, which is equivalent to neglecting the cubic nonlinear terms in (4.12) and (4.13). Since the governing equations of the quadratic model differ from those of the cubic model only at
 $O(\epsilon ^3)$
, the linear dispersion relation, the group velocity
 $c_{\!g}$
and
 $\lambda _1$
are identical for both models. However, the quadratic model is unable to capture the complete nonlinear interaction, resulting in an inaccurate coefficient
 $\lambda _2$
. We denote this coefficient as
 $\widetilde {\lambda }_2$
to distinguish it from that of the cubic model and express it as
 \begin{equation} \widetilde {\lambda }_2=\frac {\omega k^2}{1+\alpha k\text{tanh}(\textit{kh})}\left [\frac {g_1(k)+12\alpha k(4k^4-1)\text{tanh}(\textit{kh})}{4\text{tanh}^2(\textit{kh})g_2(k)}\right ]\!. \end{equation}
Our primary concern is the behaviour of hydroelastic waves as the load velocity approaches a critical point. At this point, the group and phase velocities are nearly equal to the load speed, leading to wave resonance and the periodic shedding of solitary wave packets (Milewski, Vanden-Broeck & Wang Reference Milewski, Vanden-Broeck and Wang2011). Consequently, distinguishing between the focusing and defocusing types of the BRDS equation is essential for understanding the wave dynamics at this juncture. At criticality, where the phase speed reaches its minimum value, both
 $c_{\!g}$
and
 $\omega ''$
are positive. Cipolatti (Reference Cipolatti1992) introduced a new parameter
 \begin{equation} \varXi =\frac {\lambda _1}{1-h^{-1}c_{\!g}^2}+\lambda _2, \end{equation}
and proved that
 $\varXi \gt 0$
is a sufficient condition for the equation to possess a localised ground state solitary wave. Henceforth, we will refer to the BRDS equation as the focusing type based on this criterion.
The inclusion of the inertial term leads to
 $\lambda _2\gt 0$
and
 $\varXi \gt 0$
for the cubic DNO-truncation model, making the equation focusing, as illustrated by black solid lines in figure 2. For comparison, we also display
 $\widetilde {\lambda }_2$
for the quadratic model in figure 2 using a blue dashed line. The notable difference in the nonlinear coefficient between the two models indicates that there will be substantial differences in the solutions regarding quantity, even though both models qualitatively predict focusing behaviour for the BRDS equation.
It is also important to note that the ground state of the BRDS equation is closely related to solitary wave packets in the hydroelastic wave problem. Following Wang et al. (Reference Wang, Vanden-Broeck and Meng2014b
), we can determine the leading-order speed-amplitude relation by setting
 $A=e^{\mathrm{i}\tau }m(X,Y)$
. This leads to the result that
 \begin{equation} \max |\eta |\approx 2m(0,0)[(c^{\ast }-c)k^{\ast }]^{\frac 12}, \end{equation}
where
 $c_{\!p}=c_{\!g}=c^{\ast }$
represents the critical velocity and
 $k^{\ast }$
denotes the corresponding wavenumber. Detailed methods for calculating the amplitude of the ground state
 $m(0,0)$
can be found from Milewski & Wang (Reference Milewski and Wang2013).
4.3. Validation
In the following numerical experiments, we analyse the bifurcation mechanism and dynamics of solitary waves in the inviscid limit (
 $\beta =\gamma =0$
in (2.15)). We compare the results obtained from the quadratic and cubic DNO-truncation models, demonstrating that the cubic model is more suitable. To achieve this, we consider the 2-D hydroelastic wave problem and compare the results from the reduced models with those from direct numerical simulations of the full Euler equations.
We employ a time-dependent conformal mapping technique to solve the 2-D fully nonlinear Euler equations. The core idea of this method is to transform the physical fluid domain, defined by
 $-h\lt z\lt \eta$
, into a uniform stripe (see, for example, Choi & Camassa Reference Choi and Camassa1999; Milewski et al. Reference Milewski, Vanden-Broeck and Wang2011; Gao, Wang & Vanden-Broeck Reference Gao, Wang and Vanden-Broeck2016; Hu & Wang Reference Hu and Wang2025). In this transformation, the horizontal and vertical coordinates are denoted as
 $\tilde {\xi }$
and
 $\tilde {\zeta }$
, respectively, which maps the surface
 $z=\eta (x,t)$
to
 $\tilde {\zeta }=0$
. We define the surface quantities:
 \begin{align} X(\tilde {\xi },t)=x(\tilde {\xi },0,t),\quad Z(\tilde {\xi },t)=z(\tilde {\xi },0,t),\quad \varPhi (\tilde {\xi },t)=\phi (\tilde {\xi },0,t),\quad \varPsi (\tilde {\xi },t)=\psi (\tilde {\xi },0,t), \end{align}
where
 $\psi$
is known as the stream function, which serves as the harmonic conjugate of
 $\phi$
. The Euler equations can be rewritten in the conformal plane as
 \begin{equation} \begin{aligned} Z_t=&\;Z_{\tilde {\xi }}\mathcal{C}\!\left [\frac {\varPhi _{\tilde {\xi }}}{J}\right ]-X_{\tilde {\xi }}\!\left (\frac {\varPsi _{\tilde {\xi }}}{J}\right )+Q(t)Z_{\tilde {\xi }},\\ \left (\varPhi -\alpha \frac {\varPsi _{\tilde {\xi }}}{X_{\tilde {\xi }}}\right )_{\!t}=&\;\frac {\varPsi _{\tilde {\xi }}^2-\varPhi _{\tilde {\xi }}^2}{2J}+\varPhi _{\tilde {\xi }}\mathcal{C}\!\left [\frac {\varPhi _{\tilde {\xi }}}{J}\right ]-Z+\alpha \mathcal{M}_1-\mathcal{M}_2, \end{aligned} \end{equation}
where
 $J=X_{\tilde {\xi }}^2+Z_{\tilde {\xi }}^2$
represents the Jacobian of the transformation and
 \begin{align} Q(t)=-\frac {1}{\lambda }\int _{-\lambda /2}^{\lambda /2}\left (X_{\tilde {\xi }}\mathcal{C}\left [\frac {\varPsi _{\tilde {\xi }}}{J}\right ]+Z_{\tilde {\xi }}\frac {\varPsi _{\tilde {\xi }}}{J}\right ){\rm d}\tilde {\xi } \end{align}
with
 $\lambda$
representing the period in the conformal plane. According to the elementary properties of analytical functions,
 $X$
and
 $\varPsi$
can be expressed as
 \begin{equation} X_{\tilde {\xi }}=1-\mathcal{C}[Z_{\tilde {\xi }}],\quad \varPsi _{\tilde {\xi }}=\mathcal{T}[\varPhi _{\tilde {\xi }}-\mathcal{U}], \end{equation}
where
 $\mathcal{U}$
is determined by the initial condition of the simulation. The pseudo-differential operators are defined through their Fourier symbols. Denoting a term with a hat as its Fourier coefficient, we have
 $\hat {\mathcal{C}}=\mathrm{i}\coth (nk_0\tilde {h})$
and
 $\hat {\mathcal{T}}=\mathrm{i}\text{tanh}(nk_0\tilde {h})$
, where
 $\tilde {h}$
is the stripe thickness given by
 $\tilde {h}=\hat {Z}_0+h$
and
 $k_0=2\pi /\lambda$
is the fundamental wavenumber. Additionally, we have
 \begin{align} \mathcal{M}_1=&\;\frac {X_t(X_{\tilde {\xi }}Z_{t\tilde {\xi }}-Z_{\tilde {\xi }}\mathrm{X}_{t\tilde {\xi }})}{X_{\tilde {\xi }}^2}-\frac {X_t^2(X_{\tilde {\xi }}Z_{\tilde {\xi }\tilde {\xi }}-Z_{\tilde {\xi }}X_{\tilde {\xi }\tilde {\xi }})}{X_{\tilde {\xi }}^3}, \\[-12pt]\nonumber \end{align}
 \begin{align} \mathcal{M}_2=&\;\frac 12\left [\frac {\kappa _{\tilde {\xi }\tilde {\xi }}}{J}+\left (\frac {\kappa _{\tilde {\xi }}}{J}\right )_{\tilde {\xi }}+\kappa ^3\right ]\;\;\text{with}\;\;\kappa =\frac {X_{\tilde {\xi }}Z_{\tilde {\xi }\tilde {\xi }}-X_{\tilde {\xi }\tilde {\xi }}Z_{\tilde {\xi }}}{J^{3/2}}. \end{align}
It is noted that (4.30) forms a closed system with the unknowns only on the free surface and are referred to as the surface Euler equations. This system is spatially discretised using a pseudo-spectral method and is integrated in time using a fourth-order Runge–Kutta scheme. Unlike the traditional time-dependent conformal mapping method described by Choi & Camassa (Reference Choi and Camassa1999) and Gao et al. (Reference Gao, Wang and Vanden-Broeck2016), the introduction of the inertia term presents an additional challenge, requiring an iteration process. Specifically, at each time step, the surface potential
 $\mathrm{\varPhi }$
is updated through an iterative reconstruction procedure as follows:
 \begin{equation} \big (1-\alpha \varOmega \mathcal{T}\partial _{\tilde {\xi }}\big )\varPhi ^{(n+1)}=\mathcal{G}+\alpha \left (\frac {1}{X_{\tilde {\xi }}}-\varOmega \right )\mathcal{T}\big [\varPhi _{\tilde {\xi }}^{(n)}\big ], \end{equation}
where
 $\varOmega =\text{max}(1/X_{\tilde {\xi }})$
and
 $\mathcal{G}=\varPhi -\alpha \varPsi _{\tilde {\xi }}/X_{\tilde {\xi }}$
is determined by solving (4.30). This iterative scheme is repeated until the condition
 $|\varPhi ^{(n+1)}-\varPhi ^{(n)}|/|\varPhi ^{(n)}|\lt 10^{-12}$
is satisfied.
We start by computing wavepacket solitary waves. The computational domain has a length of
 $400$
and is uniformly discretised using
 $2048$
collocation points. To find locally confined travelling-wave solutions to the surface Euler equations with wave speed
 $c$
, we assume that both
 $Z$
and
 $\varPhi$
depend on
 $\tilde {\xi }-ct$
. In this case, (4.30) can be reduced to
 \begin{equation} \frac {(c-\mathcal{U})^2}{2J}-\frac {c^2}{2}+Z+\alpha c^2\frac {X_{\tilde {\xi }}Z_{\tilde {\xi }\tilde {\xi }}-Z_{\tilde {\xi }}X_{\tilde {\xi }\tilde {\xi }}}{X_{\tilde {\xi }}^3}+\mathcal{M}_2=0, \end{equation}
with
 $\varPsi =cZ$
. We solve (4.36) using the Newton–Raphson method, considering a solution converged when the
 $L^\infty $
-norm of the residual error is less than
 $10^{-10}$
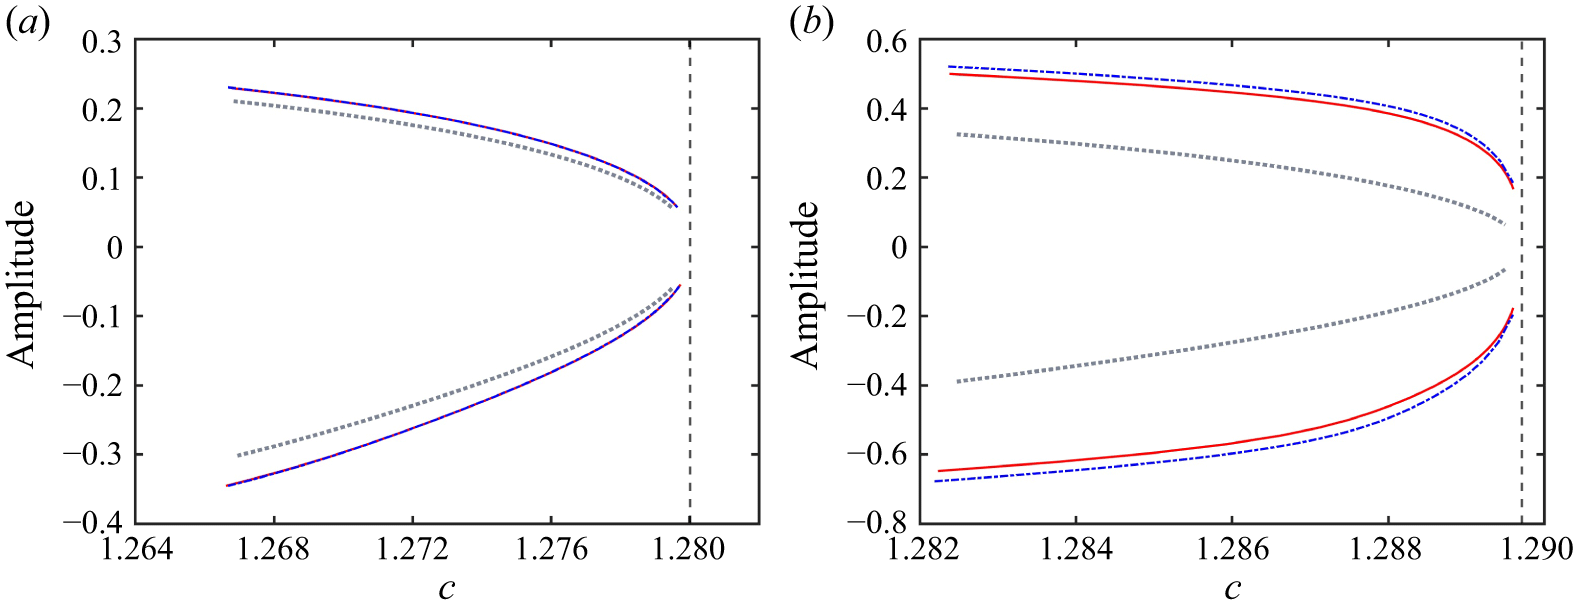
. Once we find one solution, we compute others along the same bifurcation branch using straightforward numerical continuation. The computation of solitary waves in the model (4.6) and (4.10) follows a similar approach. Unlike the work of Gao et al. (Reference Gao, Wang and Vanden-Broeck2016), this study introduces the inertia effect into the hydroelastic wave system. Nevertheless, we are still able to identify two fundamental branches of solitary waves: elevation waves (which have a positive free-surface displacement at the centre) and depression waves (which have a negative free-surface displacement at the centre), as shown in figure 3. These solutions exhibit oscillatory decaying tails and are referred to as wavepacket solitary waves. As illustrated in figure 3, the cubic DNO-truncation model shows consistently better agreement with the Euler solutions compared with the quadratic DNO-truncation model in both shallow and deep-water scenarios. However, due to the weakly nonlinear nature of the cubic model, discrepancies between this model and the Euler results become more pronounced for large-amplitude solitary waves in deep water, highlighting the former’s limitations in strongly nonlinear regimes. It should be noted that the parameters used in these computations are derived from table 1, which includes the experiment in Lake Saroma for the shallow-water case (
 $\alpha =0.0691$
) and the experiment in McMurdo Sound for the deep-water scenario (
 $\alpha =0.0717$
).
Speed-amplitude bifurcation diagrams for solitary waves in the 2-D problem: comparison of the quadratic model (grey dotted lines), the cubic model (blue dash-dotted lines) and the full Euler equations (red solid lines). The vertical dashed lines indicate the phase speed minima, labelled as
 $c^{\ast }$
. In panel (a), the water depth is
 $h=6.8\,\mathrm{m}$
with a corresponding
 $c^{\ast }=1.2800$
, while panel (b) represents the case of infinite water depth (
 $h\to \infty$
), where
 $c^{\ast }=1.2897$
.

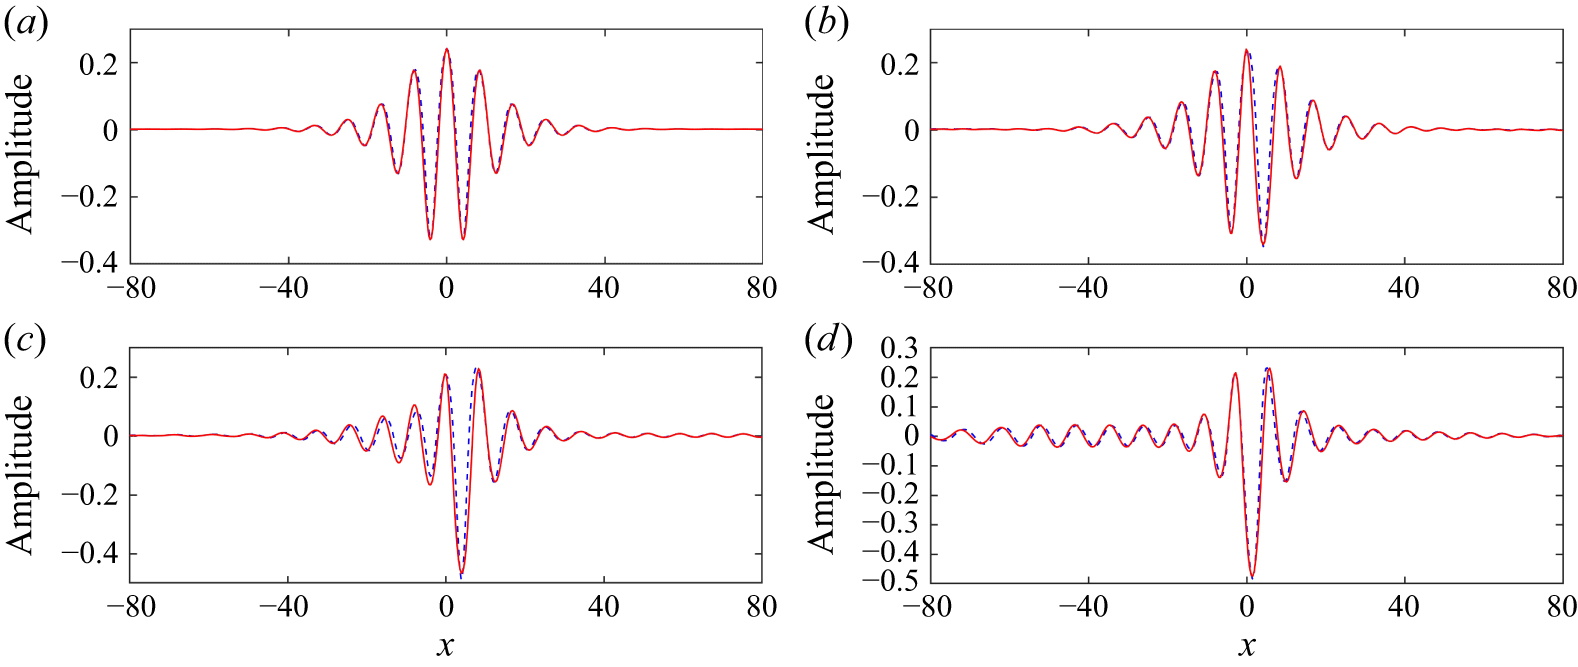
Time evolution of an elevation solitary wave under a small perturbation in shallow water (
 $h=6.8\,\mathrm{m}$
). The red solid lines represent the results from the full Euler equations, while the blue dashed lines reflect the results from the cubic model. Snapshots are captured at: (a)
 $t=0$
; (b)
 $t=160$
; (c)
 $t=290$
, and (d)
 $t=600$
. Perturbation parameter is set as
 $\delta =-0.05$
and the initial wave speed is
 $c=1.2614$
.

Studies conducted by Wang & Milewski (Reference Wang and Milewski2012) and Gao et al. (Reference Gao, Wang and Vanden-Broeck2016) demonstrate that elevation solitary waves become unstable when subjected to small perturbations. To further validate the effectiveness of the cubic model, we compare its time-dependent results for the long-term dynamics of an unstable elevation wave with those obtained from the full Euler equations. We introduce a perturbation to the exact solitary wave solution by applying a small multiple of itself, using the initial condition
 $\eta (x,0)=(1+\delta )\widetilde {\eta }$
, where
 $\widetilde {\eta }$
represents the computed travelling wave and
 $\delta$
is a small constant. For the time-dependent simulations, the configuration of the computational domain remains unchanged from the previous specification, with a time step of
 $\Delta t=0.001$
employed. The results, shown in figures 4 and 5, reveal a remarkable consistency between the Euler solutions and the simulations produced by the cubic model for both shallow and deep water cases, thereby confirming the model’s effectiveness. Additionally, we independently simulate overtaking collisions between two depression solitary waves using both the full Euler equations and the cubic model, with the results illustrated in figures 6 and 7. Our simulations of the cubic model in shallow water align more closely with the Euler solutions than those in deep water. This discrepancy is primarily due to the model’s weakly nonlinear nature; specifically, the amplitude of solitary waves is generally larger in deep water than in shallow water.
Time evolution of an elevation solitary wave under a small perturbation in deep water (
 $h\to \infty$
). The red solid lines represent the results from the full Euler equations, while the blue dashed lines reflect the results from the cubic model. Snapshots are captured at: (a)
 $t=0$
; (b)
 $t=130$
; (c)
 $t=170$
and (d)
 $t=350$
. Perturbation parameter is set as
 $\delta = -0.05$
and the initial wave speed is
 $c = 1.2804$
.

An overtaking collision between two depression solitary waves with different speeds (
 $c=1.2727$
and
 $c=1.2469$
) in shallow water (
 $h=6.8\,\mathrm{m}$
). The results are plotted in a frame of reference moving at the speed of the slower one. The red solid lines indicate the results from the full Euler equations, and the blue dashed lines represent the results from the cubic model. Snapshots are captured at the following times: (a)
 $t=0$
; (b)
 $t=3200$
and (c)
 $t=4500$
.

An overtaking collision between two depression solitary waves with different speeds (
 $c=1.2870$
and
 $c=1.2680$
) in deep water. The results are plotted in a frame of reference moving at the speed of the slower one. The red solid lines indicate the results from the full Euler equations, while the blue dashed lines represent the results from the cubic model. Snapshots are taken at the following times: (a)
 $t=0$
; (b)
 $t=1100$
and (c)
 $t=3500$
.

The previous discussion regarding the 2-D problem illustrates the effectiveness of the cubic DNO-truncation model, particularly in terms of the bifurcation mechanism and dynamic behaviour of wavepacket solitary waves, which closely resemble the solutions of the full Euler equations. In contrast, the quadratic DNO-truncation model fails to accurately capture the associated NLS equation at the minimum phase speed, leading to significant deviations from the Euler equations. For the 3-D hydroelastic wave problem, wavepacket solitary waves are characterised by oscillatory decaying tails in the direction of wave propagation and monotonicity in the transverse direction. These waves have been demonstrated, both asymptotically and numerically, in previous studies (Milewski & Wang Reference Milewski and Wang2013; Trichtchenko et al. Reference Trichtchenko, Părău, Vanden-Broeck and Milewski2018). These solutions are commonly referred to as lumps. Figure 8 displays the speed-amplitude bifurcation curves obtained from the quadratic and cubic models for hydroelastic lumps. Notable differences appear between the two models in both shallow-water and deep-water scenarios. For a given wave speed, the quadratic model predicts a slightly lower wave amplitude than the cubic model in shallow water and this discrepancy becomes more pronounced in deep water. It is observed that the BRDS equation for both cases,
 $h=6.8$
and
 $h\to \infty$
, is focusing, although the values of
 $\varXi$
differ between the two scenarios. However, in the deep, the significant difference in
 $\varXi$
between the quadratic and cubic models, as illustrated in figure 2, leads to significant gaps in the speed-amplitude bifurcation diagrams. In addition to the reduced models, hydroelastic lumps can also be simulated using the boundary integral equation method (Părău & Vanden-Broeck Reference Părău and Vanden-Broeck2002; Trichtchenko et al. Reference Trichtchenko, Părău, Vanden-Broeck and Milewski2018; Părău & Vanden-Broeck Reference Părău and Vanden-Broeck2019; Ţugulan et al. Reference Ţugulan, Trichtchenko and Părău2022). However, this approach is computationally expensive when aiming for highly accurate results (see, for example, Wang & Milewski Reference Wang and Milewski2012). Lastly, accurately simulating unsteady 3-D hydroelastic waves using the full Euler equations is substantially more complex. Therefore, we adopt the cubic DNO-truncation model in the subsequent sections to reduce computational costs while maintaining physical accuracy.
Speed-amplitude bifurcation diagrams for hydroelastic lumps in the 3-D problem: comparison between the quadratic (grey dotted lines) and cubic (blue dash-dotted lines) models. The leading-order prediction (4.28) is shown with a red line for the shallow-water case. The vertical dashed lines represent the phase speed minima, labelled as
 $c^{\ast }$
. In panel (a), the water depth is
 $h=6.8\mathrm{m}$
with a corresponding
 $c^{\ast }=1.2800$
, while panel (b) represents the case of infinite water depth (
 $h\to \infty$
) with
 $c^{\ast }=1.2897$
.

5. Response to uniformly moving loads
We will now focus on unsteady simulations, comparing the numerical results from the cubic DNO-truncation model with experimental observations from previous studies. In this paper, we focus on horizontal two-dimensional computations within a square computational domain that has a width of
 ${L}=150$
, centred at the origin. The domain is discretised with a resolution of at least 512 modes in the propagation direction and 256 modes in the transverse direction. The time step is set to
 $\Delta t=0.002$
. The cubic model is evaluated against two field experiments: one conducted in shallow water at Lake Saroma in Japan by Takizawa (Reference Takizawa1985) and the other in the deep-water environment of McMurdo Sound, Antarctica, by Squire et al. (Reference Squire, Robinson, Langhorne and Haskell1988). The physical parameters, units and corresponding values measured from these experiments are summarised in table 1. This selection of cases, spanning various water depths, allows for a thorough assessment of the model’s performance.
We begin by discussing the shallow water case. Lake Saroma was covered with an ice sheet approximately
 $0.16\,\mathrm{m}$
thick, along with a light snow cover that ranged from 2 to 8 centimetres. A skidoo was used as a moving load on a test track approximately 200 m long and ice deflections were measured using deflectometers installed at various locations along the track. A key detail, often overlooked in previous 2-D studies, is that the deflectometers were positioned
 $1\,\mathrm{m}$
laterally from the centreline of the skidoo’s path. This lateral offset is not negligible in 3-D modelling, especially considering the rapid decay of ice-sheet deflection in that direction. To compare our numerical results with experimental reports – which often present
 $y$
-cross-section profiles – we extract data along the cross-section at
 $y=1\,\mathrm{m}$
.
Based on the physical parameters of the ice sheet presented in table 1, we can calculate the inertia factor
 $\alpha = 0.0691$
. The constant
 $q$
in the pressure function is determined by numerically fitting the deflection of the ice sheet under static load. Meanwhile, the viscosity factor
 $\beta$
and the relaxation time factor
 $\gamma$
are established through a trial-and-error approach. Details regarding the determination of these factors will be provided at the end of this section. To obtain experimental data for the shallow water case, figure 3 from Takizawa (Reference Takizawa1985) has been digitised. While fitting the experimental records, we identify the appropriate estimates for the fitting factors:
 $\beta =0.05$
and
 $\gamma =0.05$
. Once all relevant factors have been determined, we can compare the numerical results from the cubic model (4.6) and (4.10) with the experimental data presented by Takizawa (Reference Takizawa1985). When plotting the results, the load is positioned at the origin. In the remainder of this paper, we will use the International System of Units (SI) for image coordinates to facilitate direct comparisons with experimental results. For example, in figure 9, the horizontal coordinate is displayed in metres, while the vertical displacement is shown in millimetres.
A comparison of numerical results from the cubic model and experimental ice deflection records from the experiments of Takizawa (Reference Takizawa1985). The vertical coordinate (
 $\eta$
, in mm) indicates ice deflection, while the horizontal coordinate (
 $x$
, in m) represents displacement. The load speeds are as follows: (a) 2.2 m s−1; (b) 4.2 m s−1; (c) 5.5 m s−1; (d) 6.2 m s−1 and (e) 8.9 m s−1. The black dotted curves are the experimental data from Takizawa (Reference Takizawa1985), while the blue solid curves depict the numerical results of the cubic model, specifically at the cross-section
 $y=1\,\mathrm{m}$
.

A comparison between the numerical results from the cubic model at various velocities (slightly above 5.5 m s−1) and the experimental data recorded at a velocity of
 $v=5.5\,\mathrm{m}\,\rm s^{-1}$
(represented by the black dotted line). The vertical coordinate indicates ice deflection (
 $\eta$
, in mm), while the horizontal axis represents displacement (
 $x$
, in m). The numerical results are displayed as follows: the blue line corresponds to
 $v=5.6\,\mathrm{m}\,\rm s^{-1}$
and the red line corresponds to
 $v=5.75\,\mathrm{m}\,\rm s^{-1}$
.

Figure 9 illustrates a comparison between numerical simulations and experimental measurements. Overall, the cubic model successfully captures the primary features observed in the experiment. There is a good agreement at load velocities well below the critical speed (see figures 9
a and 9
b). However, at a velocity of
 $5.5\,\mathrm{m}\,\rm s^{-1}$
, the model does not display wave generation and the predicted depression pulse is lower than that observed in the experiment. To identify the late-transition stage, where a wave-like pattern begins to form at both the front and rear sides of the load, we gradually increase the load speed starting from
 $5.5\,\mathrm{m}\,\rm s^{-1}$
. The results, presented in figure 10, confirm that waves begin to form on both sides of the load as the speed increases. Although the agreement regarding the central depression is not perfect, the cubic model effectively demonstrates the presence of the late-transition stage. Notably, when the load speed reaches
 $5.75\,\mathrm{m}\,\rm s^{-1}$
, the wave amplitude calculated by the cubic model aligns with the experimental measurements taken at
 $5.5\,\mathrm{m}\,\rm s^{-1}$
. This delay in velocity is also illustrated in figure 11. Good agreement is regained at
 $6.2\,\mathrm{m}\,\rm s^{-1}$
(figure 9
d), where the model captures both flexural and gravity waves, albeit with a more rapid spatial decay compared with the experimental records. When the load velocity exceeds the long-wave limiting velocity
 $c_0$
, the model tends to overpredict both the wave trough and wave crest of the leading waves. Furthermore, the wavelength of the leading waves computed by the model is longer than that observed in the experimental records (figures 9
d and 9
e). Behind the depression pulse caused by the load, the shadow zone identified by Davys et al. (Reference Davys, Hosking and Sneyd1985) is recovered in the cubic model. Typical wave profiles derived from the cubic model are depicted in figure 12. Fully localised lump structures are formed well below the phase speed minimum (figures 12
a–12
c). Near the critical velocity (figure 12
d), characteristic gravity wave patterns emerge around the load. Once the load velocity exceeds
 $c_0$
, trailing waves disappear and significant deflections occur on both rear flanks, indicating substantial energy radiation in transverse directions.
Depression depth (in
 $\mathrm{mm}$
), measured at a transversal distance of
 $1\,\mathrm{m}$
, as a function of load speed
 $v$
(in
 $\mathrm{m}\,\rm s^{-1}$
). The solid curve is computed by the cubic model, and the experimental results from Takizawa (Reference Takizawa1985) are given by the circles.

Typical wave profiles obtained by solving the cubic model in shallow water at various load speeds. The parameters are derived from Takizawa (Reference Takizawa1985) and the load is located at the origin.

We have also digitised figure 6 from Takizawa (Reference Takizawa1985), which illustrates how depression depth varies with load velocity. In figure 11, we compare the computed depression depth with the measurements taken by Takizawa (Reference Takizawa1985). The results show good agreement between computational findings and experimental data when the load velocity is low (
 $v\lt 5\,\mathrm{m}\,\rm s^{-1}$
). However, when the load speed increases to between
 $5\,\mathrm{m}\,\rm s^{-1}$
and
 $6\,\mathrm{m}\,\rm s^{-1}$
, the depression depth observed in experiments rises more rapidly than the numerical results. This phenomenon is consistent with the velocity delay observed in figure 9. Similarly, as indicated in figure 9(e), the computed depression depth is slightly larger than the experimental measurements in the single-wave stage (
 $v\gt 8\,\mathrm{m}\,\rm s^{-1}$
). This suggests that the depression depth from the experiments decreases more quickly as the load velocity increases.
The differences between the experimental and numerical results may arise from various factors. For instance, the present model assumes a uniform ice thickness and a constant water depth, whereas natural field conditions inevitably involve spatial variations in these parameters. Furthermore, Takizawa (Reference Takizawa1985) noted that a snow cover, ranging in thickness from
 $0.02\,\mathrm{m}$
to
 $0.08\,\mathrm{m}$
, exists above the ice sheet during the experimental period. Given the substantial differences in physical properties between ice and snow, omitting the snow cover in the model represents a considerable simplification. Additional potential sources of error include uncertainties in the effective ice modulus, the parametrisation of viscoelastic properties and bathymetric effects that are not captured in the simulation.
Next, we focus on the deep water experiments conducted at McMurdo Sound in Antarctica, where the water depth ranged from approximately
 $350\,\mathrm{m}$
to
 $450\,\mathrm{m}$
. The ice thickness consistently measured around
 $1.6\,\mathrm{m}$
over a large area, resulting in uniform flexural rigidity. Two moving loads were employed during the experiments: a truck with a mass of
 $2100\,\mathrm{kg}$
and an LC-130 Hercules aeroplane with a mass of
 $50\,000\,\mathrm{kg}$
. Instead of using deflectometers, Squire et al. (Reference Squire, Robinson, Langhorne and Haskell1988) used strain gauges arranged in
 $45^\circ$
rosettes to measure ice deformation.
Based on Squire et al. (Reference Squire, Hosking, Kerr and Langhorne1996), we adopt a flexural rigidity of
 $\mathcal{D}=1.6\,\mathrm{GNm}$
. Following the approach used in the shallow water case, we determine the relevant parameters:
 $\alpha =0.0717$
,
 $\beta =0.04$
and
 $\gamma =0.06$
. We then digitise figure 1 of Squire et al. (Reference Squire, Robinson, Langhorne and Haskell1988) and select five representative velocities corresponding to the five states proposed by Takizawa (Reference Takizawa1985) for a comparative analysis of numerical simulations. These velocities are
 $v=13.8\,\mathrm{m}\,\rm s^{-1}$
,
 $v=15.7\,\mathrm{m}\,\rm s^{-1}$
,
 $v=17.5\,\mathrm{m}\,\rm s^{-1}$
,
 $v=18.4\,\mathrm{m}\,\rm s^{-1}$
and
 $v=20.8\,\mathrm{m}\,\rm s^{-1}$
. The results are presented in figures 13 and 14. A crucial difference in deep water is the exceptionally high value of the long-wave limiting velocity, as illustrated in figure 1(b). This characteristic indicates that long waves generated by a load persist even at high velocities, although with markedly increasing wavelengths and decreasing amplitudes as the load speed increases.
Before discussing the comparison results, a few details need clarification. First, in numerical simulations, the DNO is approximated using its infinite depth form, given by
 $G_0 = (-\varDelta )^{1/2}$
. Second, the exact location of the strain measurements in figure 1 of Squire et al. (Reference Squire, Robinson, Langhorne and Haskell1988) was not specified. However, based on the description by Squire et al. (Reference Squire, Hosking, Kerr and Langhorne1996), we understand that the measurement instruments were positioned adjacent to and parallel with the ice road. For simplicity, we assume that the data were collected along the centre line of the road. Finally, the most critical issue is how to calculate strain within the ice sheets. Squire et al. (Reference Squire, Robinson, Langhorne and Haskell1988) provided limited information on the derivation of strain, which complicates direct comparisons. To address this, we will use several methods to compute strain in our numerical simulations, including
 \begin{equation} \sigma _1=-\frac {d}{2}\frac {\partial ^2\eta }{\partial x^2}\quad \text{and}\quad \sigma _2=-\frac {d}{4}\kappa. \end{equation}
By comparing numerical results with experimental data,
 $\sigma _2$
, which takes into account the normal strains in both the
 $x\hbox{-}$
direction and
 $y\hbox{-}$
direction as well as the shear strain, is chosen as the preferred method.
A comparison between the numerical results from the cubic model and the experimental ice deflection records from the experiments of Squire et al. (Reference Squire, Robinson, Langhorne and Haskell1988). Strains are measured in microstrain
 $(10^{-6})$
and time is recorded in seconds. The load speeds (in m s−1) are as follows: (a) 13.8, (b) 15.7, (c) 17.5, (d) 18.4 and (e) 20.8. The black dotted curves represent the experimental data from Squire et al. (Reference Squire, Robinson, Langhorne and Haskell1988), while the blue solid curves indicate the time series of the numerical results at the cross-section
 $y=0\,\mathrm{m}$
.

Typical wave profiles obtained by solving the cubic model in deep water. The parameters are derived from Squire et al. (Reference Squire, Robinson, Langhorne and Haskell1988) and the load is located at the origin.

Figure 13 demonstrates a close alignment between numerical simulations and experimental results for the forced hydroelastic wave problem in deep water. At subcritical speeds (figures 13 a–13 c), the model predictions of microstrains in the numerical simulations, both ahead of and behind the load, are slightly higher than those recorded in experiments, while the depression depth is lower. As the load velocity approaches the critical speed (figure 13 d), the experimental curve exhibits a nearly vertical slope near the load, which may be attributed to experimental errors. This feature results in a discrepancy with the numerical solution. In figures 13(d) and 13(e), the numerical strains show a more pronounced spatial decay compared with their experimental counterparts, a trend also noted in the shallow water scenario. In addition to the potential sources of error discussed for the shallow-water case, uncertainties in the strain derivation also contribute significantly to the observed discrepancies.
A comparison of numerical results using various relaxation and viscosity factors:
 $\beta =0.2$
and
 $\gamma =0$
(blue),
 $\beta =0.4$
and
 $\gamma =0$
(red), and
 $\beta =0.2$
and
 $\gamma =0.2$
(green). The vertical axis (
 $\eta$
, in mm) represents ice deflection and the horizontal axis (
 $x$
, in m) indicates displacement. The load speeds are (a) 6.2 m s−1 and (b) 8.9 m s−1.

We conclude this section by justifying the retention of the relaxation time term in the cubic model and by outlining the procedure for calibrating the viscosity and relaxation factors. Figure 15 compares the numerical results for the shallow water case with various combinations of these parameters, particularly focusing on high load speeds for clarity. The comparison reveals that the relaxation time factor
 $\gamma$
significantly influences the leading waves, specifically the short flexural wave, while having a lesser impact on the trailing gravity waves. This selective damping can be attributed to the term
 $\gamma \partial _t{{\nabla} }^4\eta$
, which contains a fourth-order spatial derivative and thus disproportionately affects short-wavelength components. In contrast, the viscosity factor
 $\beta$
affects both flexural and gravity waves simultaneously. Therefore, including both viscosity and relaxation time terms is essential for achieving good agreement with experimental measurements across the entire spectrum of generated waves. Since the effects of
 $\beta$
and
 $\gamma$
in deep water are qualitatively similar to those in shallow water, a separate analysis is omitted.
The distinct roles of the two damping factors provide insights into their sequential determination. Flexural and gravity waves are most pronounced when the load speed slightly exceeds the critical velocity. To analyse this, we use experimental results at
 $v=6.2\,\mathrm{m}\,\rm s^{-1}$
from Takizawa (Reference Takizawa1985) and
 $v=18.4\,\mathrm{m}\,\rm s^{-1}$
from Squire et al. (Reference Squire, Robinson, Langhorne and Haskell1988) as references. We first estimate the value of
 $\beta$
by matching the depression depth beneath the load and the waveform of the trailing gravity waves. Next, we adjust the relaxation factor
 $\gamma$
to fit the amplitude and attenuation rate of the leading flexural waves. It is important to note that flexural waves also occur during the single-wave stage; therefore, to achieve greater accuracy in determining
 $\gamma$
, we should consider experimental data from both wave stages. Finally, once the parameters are established, wave profiles for other speeds within the same experimental set-up will be calculated using these parameters without any modifications.
6. Responses to variable-speed motion of the load
6.1. Responses to uniformly accelerating loads
Previous studies have primarily examined the response of a floating ice sheet to a load that is suddenly applied and then moves steadily, without any acceleration. Notable exceptions to this focus are the research contributions of Miles & Sneyd (Reference Miles and Sneyd2003), Dinvay et al. (Reference Dinvay, Kalisch and Părău2019) and Hosking & Milinazzo (Reference Hosking and Milinazzo2022). Miles & Sneyd (Reference Miles and Sneyd2003) and Hosking & Milinazzo (Reference Hosking and Milinazzo2022) employed a 2-D linear theory to explore how a floating ice sheet reacts to a line load moving at variable speeds, whereas Dinvay et al. (Reference Dinvay, Kalisch and Părău2019) analysed the deceleration process of a moving load using a fully dispersive model. Both Dinvay et al. (Reference Dinvay, Kalisch and Părău2019) and Hosking & Milinazzo (Reference Hosking and Milinazzo2022) found that deceleration from supercritical velocities can lead to a significantly amplified deflection. This occurs due to constructive interference as trailing, gravity-dominated waves catch up to the slowing load. To examine how acceleration and deceleration affect ice deflection in three dimensions and to investigate constructive interference, the following two subsections use the validated cubic model to analyse the transient response to a load with variable velocity. Unlike the travelling-wave solutions discussed earlier, the scenarios of acceleration and deceleration are time-dependent, resulting in a relatively short computational duration. However, this brief time scale allows the waves generated during speed transitions – typically expected to radiate away in an unbounded domain – to traverse the periodic boundaries and re-enter the computational domain, potentially contaminating the numerical results. To address this issue, a sponge layer is introduced following the work of Guyenne & Părău (Reference Guyenne and Părău2017). This involves adding a damping pressure term, represented as
 \begin{equation} -\!\Lambda (x,y)G(\eta )\xi, \end{equation}
to the right-hand side of (4.2), where
 $\varLambda$
is a tuneable, spatially dependent coefficient that is non-zero only in a small region near the boundary. A
 $\text{tanh}$
profile is used to illustrate the localised spatial behaviour of
 $\Lambda (x,y)$
, expressed as
 \begin{equation} \begin{aligned} \varLambda (x,y)=&\,\mu\! \left \{\text{tanh}\left [2\pi \left (x-x_e+\frac {l_{\!p}}{2}\right )\right ]-\text{tanh}\left [2\pi \left (x-x_s+\frac {l_{\!p}}{2}\right )\right ]\right .\\ &\,+\left .\text{tanh}\left [2\pi \left (y-y_e+\frac {l_{\!p}}{2}\right )\right ]-\text{tanh}\left [2\pi \left (y-y_s+\frac {l_{\!p}}{2}\right )\right ]+4\right \}\!, \end{aligned} \end{equation}
where
 $\mu$
is a constant,
 $l_{\!p}$
denotes the approximate width of the sponge layer, and
 $x_e,\,y_e$
and
 $x_s,\,y_s$
represent the right and left boundaries of the domain in horizontal directions, respectively. Numerical tests indicate that setting
 $\mu =80$
and
 $l_{\!p}=10$
effectively mitigates the impact of outgoing disturbances. Since the characteristics of waveforms in deep water do not differ qualitatively from those in shallow water, the variable-speed load analysis is conducted in shallow water, using all physical parameters derived from the experimental observations of Takizawa (Reference Takizawa1985).
Building on the work of Miles & Sneyd (Reference Miles and Sneyd2003) and Hosking & Milinazzo (Reference Hosking and Milinazzo2022), we begin by analysing the transient responses of a floating ice sheet to a load experiencing a constant acceleration
 $a_c$
that starts at
 $t=0$
. The corresponding position of the load is given by
 \begin{equation} X(t)=\left \{ \begin{aligned} &\frac 12a_ct^2, &&0\leqslant t\lt T_c,\\[5pt] &\frac 12a_cT_c^2+V(t-T_c), &&t\geqslant T_c, \end{aligned}\right . \end{equation}
where
 $V$
denotes the final velocity of the load and
 $T_c$
represents the acceleration time. For reference, a steadily moving load (discussed in previous sections) corresponds to an impulsive start, characterised by the position function
 $X(t)=Vt$
for
 $t\geqslant 0$
, where
 $V$
is constant. Due to the absence of ready-made experiments for comparison, we present numerical cross-sectional profiles at
 $y=0\,\mathrm{m}$
to highlight the effects of acceleration, where ice deflection is maximised. The load is positioned at the origin in the plots. Numerical simulations reveal that the effects of acceleration become negligible when the final load velocity is sufficiently low compared with the critical speed. Therefore, we focus on two specific cases with final velocities of
 $V=6.2\,\mathrm{m}\,\rm s^{-1}$
and
 $V=8.9\,\mathrm{m}\,\rm s^{-1}$
, where the effects of acceleration are more pronounced.
Maximum ice deflection (in mm) as a function of time
 $t$
(in s), which is calculated by the cubic model and measured at
 $y=0\,\mathrm{m}$
. The grey curve represents a load that starts impulsively with a constant velocity (
 $a_c=0\,\mathrm{m}\,\rm s^{-2}$
) and reaches a final velocity of
 $6.2\,\mathrm{m}\,\rm s^{-1}$
. The blue curve corresponds to an acceleration of
 $a_c=2\,\mathrm{m}\,\rm s^{-2}$
, while the red curve indicates
 $a_c=1.5\,\mathrm{m}\,\rm s^{-2}$
and the green curve represents
 $a_c=1\,\mathrm{m}\,\rm s^{-2}$
. The left side of the dotted line illustrates the uniformly accelerated process, while the right side depicts the uniform motion process.

Maximum ice deflection (in mm) as a function of time
 $t$
(in s), which is calculated by the cubic model and measured at
 $y=0\,\mathrm{m}$
. The grey curve represents a load that starts impulsively with a constant velocity (
 $a_c=0\,\mathrm{m}\,\rm s^{-2}$
) and reaches a final velocity of
 $8.9\,\mathrm{m}\,\rm s^{-1}$
. The blue curve corresponds to an acceleration of
 $a_c=2\,\mathrm{m}\,\rm s^{-2}$
, while the red curve indicates
 $a_c=1.5\,\mathrm{m}\,\rm s^{-2}$
and the green curve represents
 $a_c=1\,\mathrm{m}\,\rm s^{-2}$
. The left side of the dotted line illustrates the uniformly accelerated process, while the right side depicts the uniform motion process.

When the target velocity reaches
 $6.2\,\mathrm{m}\,\rm s^{-1}$
, the numerical results in figure 16 indicate that the acceleration process reduces the growth rate of ice deflection; however, this effect is relatively weak. Conversely, when the final load velocity significantly exceeds
 $c_{\textit{min}}$
, as illustrated in figure 17, the acceleration process increases the maximum ice deflection, with the amplification becoming more pronounced as the acceleration duration increases. This phenomenon can be explained by considering that the load spends more time in the two-wave stage, as shown in figure 11, where the ice deflection is inherently greater. Additionally, a smaller acceleration allows for a longer duration to generate waves while the load is in this two-wave stage. As the load velocity increases, it gradually overtakes the waves generated during its earlier acceleration phase. This leads to constructive interference, which will be discussed in detail in the next subsection, resulting in an increased ice deflection. These findings have practical implications for vehicle operation on ice sheets: when travelling at high speeds (exceeding the critical velocity
 $c_{\textit{min}}$
and approaching
 $c_0$
), a shorter acceleration time – achieved by a higher acceleration – would enhance safety.
While the previous discussion focuses on loads that start from rest, we will now examine scenarios where acceleration begins from steady, uniform motion. This approach allows us to isolate the effects of speed changes, independent of any startup transients. The central position of the load can be expressed as
 \begin{equation} X(t)=\left \{ \begin{aligned} &\frac 12V_0t, &&0\leqslant t\lt T_u,\\[5pt] &\frac 12V_0t+\frac {1}{2}a_c(t-T_u)^2, &&T_u\leqslant t\lt T_u+T_c,\\[5pt] &\frac 12V_0t+\frac {1}{2}a_cT_c^2+(V-V_0)(t-T_u-T_c), &&t\geqslant T_u+T_c, \end{aligned}\right . \end{equation}
where
 $V_0$
is the initial constant velocity of the load and
 $T_u$
represents the time during which the load moves at this constant velocity. Here,
 $T_u$
is chosen to be sufficiently long to ensure that the ice deflection reaches a steady state before the acceleration begins. In this scenario, the initial velocity of the load is
 $V_0=2.2\,\mathrm{m}\,\rm s^{-1}$
, with final velocities of
 $V=6.2\,\mathrm{m}\,\rm s^{-1}$
and
 $V=8.9\,\mathrm{m}\,\rm s^{-1}$
. Although not presented graphically, the numerical results indicate little difference compared with the impulsively started case, suggesting a degree of independence from the selection of initial velocity.
6.2. Response to a uniformly decelerating load
In this section, we examine the ice deflection caused by a load that is undergoing a constant deceleration
 $a_d$
from the initial velocity
 $V$
. The corresponding load position is given by
 \begin{equation} X(t)=\left \{ \begin{aligned} &\textit{Vt}, &&0\leqslant t\lt T_u,\\ &\textit{Vt}+\frac 12a_d(t-T_u)^2, &&T_u\leqslant t\lt T_u+T_d,\\ &\textit{VT}_d+\frac 12a_dT_d^2, &&t\geqslant T_u+T_d, \end{aligned}\right . \end{equation}
where
 $T_u$
represents the time during which the load moves at a constant velocity and
 $T_d$
denotes the time of deceleration. After the load’s speed decreases to zero, it remains stationary. To avoid interference from startup transients,
 $T_u$
is set to a duration long enough to ensure that the ice deflection reaches a steady state before deceleration commences. Based on the previous subsection, the deceleration analysis focuses on two initial velocities:
 $V=6.2\,\mathrm{m}\,\rm s^{-1}$
and
 $8.9\,\mathrm{m}\,\rm s^{-1}$
. The motion of deceleration generates more complex wave patterns compared with acceleration. As a result, figures 18 and 19 present cross-sectional snapshots of the ice deflection. These figures clearly illustrate the temporal evolution of ice deflection during and after deceleration, highlighting the emergence and effects of constructive interference.
A comparison of numerical simulations that start with an initial velocity of
 $V=6.2\,\mathrm{m}\,\rm s^{-1}$
and vary the deceleration in a shallow water scenario. The vertical coordinate (
 $\eta$
, in mm) indicates ice deflection, while the horizontal coordinate (
 $x$
, in m) represents displacement. Snapshots are taken at the following times: (a) 0.758 s; (b) 1.56 s; (c) 2.32 s; (d) 3.10 s; (e) 3.88 s; ( f) 4.64 s; (g) 5.45 s; (h) 6.20 s; (i) 7.82 s and ( j) 9.47 s. The moment when the load starts to accelerate or decelerate is defined as zero time. Blue solid curves depict the load moving with a uniform deceleration of
 $a_d=-2\,\mathrm{m}\,\rm s^{-2}$
, while grey dotted curves represent a deceleration of
 $a_d=-1\,\mathrm{m}\,\rm s^{-2}$
.

A comparison of numerical simulations that start with an initial velocity of
 $V=8.9\,\mathrm{m}\,\rm s^{-1}$
and vary the deceleration in a shallow-water scenario. The vertical coordinate (
 $\eta$
, in mm) indicates ice deflection, while the horizontal coordinate (
 $x$
, in m) represents displacement. Snapshots are taken at the following times: (a) 1.09 s; (b) 2.23 s; (c) 3.32 s; (d) 4.45 s; (e) 5.54 s; ( f) 6.68 s; (g) 7.77 s; (h) 8.90 s; (i) 10.7 s and (j) 11.8 s. The moment when the load starts to accelerate or decelerate is defined as zero time. Blue curves depict the load moving with a uniform deceleration of
 $a_d=-2\,\mathrm{m}\,\rm s^{-2}$
, while grey curves represent a deceleration of
 $a_d=-1\,\mathrm{m}\,\rm s^{-2}$
.

Constructive interference can be understood as the superposition of the deflection caused by the quasi-static load and the waves generated by its motion. Changes in the speed of the load may result in a relative displacement between the load and the waves it produces. When the depression pulse created by the load coincides with the trough of the generated waves, the amplitude of the depression increases, as illustrated in figures 18(g) and 18(j). In contrast, when the load aligns with the wave crest, the amplitude of the depression decreases, which can be seen in figures 18(e), 18(i) and 19(e). Once the load stops and remains stationary, the generated waves gradually detach from the static depression, resulting in the fading of constructive interference (see figures 19 g–19 j).
A wave profile comparison under various deceleration rates at different moments. The blue curves represent the load that is decelerating uniformly at a rate of
 $a_d=-2\,\mathrm{m}\,\rm s^{-2}$
, with snapshots taken at the following times: (a) 3.10 s; (b) 3.88 s; (c) 4.64 s and (d) 7.82 s. The grey curves indicate the load that is decelerating uniformly at a rate of
 $a_d=-1\,\mathrm{m}\,\rm s^{-2}$
, with snapshots taken at the following times: (a) 4.64 s; (b) 5.45 s; (c) 6.20 s and (d) 9.47 s.

When the initial speed of the load is close to
 $c_{\textit{min}}$
, the gravity waves generated behind the load can catch up with it during deceleration, leading to constructive interference. However, if the load’s speed exceeds the long-wave limiting velocity
 $c_0$
, a shadow zone forms behind the load. In this scenario, constructive interference can occur from the generated gravity waves when the load decelerates to the two-wave stage. The stronger presence of waves behind the load during the initial phase, as illustrated in figure 18, contrasts with the situation shown in figure 19, leading to greater constructive interference. Similar to the acceleration results discussed earlier, both figures 18 and 19 demonstrate that changes in deceleration do not alter the evolution of ice deflection; instead, they impact the rate of change. For example, the deflection patterns for a deceleration of
 $a_d=-2\,\mathrm{m}\,\rm s^{-2}$
in figures 18(d)–18( f) and 18(i) closely resemble those for a lower deceleration of
 $a_d = -1\,\mathrm{m}\,\rm s^{-2}$
in figures 18( f)–18(h) and 18(j). These similar patterns are directly compared in figure 20.
Maximum ice deflection (in
 $\mathrm{mm}$
) as a function of time
 $t$
(in s), starting from
 $V=6.2\,\mathrm{m}\,\rm s^{-1}$
. It is calculated by the cubic model and measured at
 $y=0\,\mathrm{m}$
. The blue curve corresponds to a deceleration of
 $a_d=-2\,\mathrm{m}\,\rm s^{-2}$
, while the red curve indicates
 $a_d=-1.5\,\mathrm{m}\,\rm s^{-2}$
and the green curve represents
 $a_d=-1\,\mathrm{m}\,\rm s^{-2}$
. The load’s velocity decreases to zero at the vertical dotted lines.

Maximum ice deflection (in
 $\mathrm{mm}$
) as a function of time
 $t$
(in s), starting from
 $V=8.9\,\mathrm{m}\,\rm s^{-1}$
. It is calculated by the cubic model and measured at
 $y=0\,\mathrm{m}$
. The blue curve corresponds to a deceleration of
 $a_d=-2\,\mathrm{m}\,\rm s^{-2}$
, the red curve indicates
 $a_d=-1.5\,\mathrm{m}\,\rm s^{-2}$
and the green curve represents
 $a_d=-1\,\mathrm{m}\,\rm s^{-2}$
. The load’s velocity decreases to zero at the vertical dotted lines.

Following the approach in the previous section, we also plot the temporal variation of the maximum ice deflection in figures 21 and 22. When the load’s initial velocity is close to
 $c_{\textit{min}}$
(
 $V=6.2\,\mathrm{m}\,\rm s^{-1}$
), the deceleration process not only reduces the maximum ice deflection, but also introduces oscillatory behaviour, without significantly increasing its peak value. Over time, the maximum ice deflection gradually approaches a steady-state value amid these oscillations, although computational limitations prevent us from simulating the process to full convergence. In contrast, at a higher initial velocity of
 $V=8.9\,\mathrm{m}\,\rm s^{-1}$
, the deceleration results in an increased maximum deflection, with peak values rising as the deceleration time is extended. Therefore, for safety reasons, rapid braking is preferable to gradual deceleration. Additionally, the deflection pattern in figure 19( f) resembles figure 11 from Dinvay et al. (Reference Dinvay, Kalisch and Părău2019) and figure 12(a) from Hosking & Milinazzo (Reference Hosking and Milinazzo2022). As observed with the initial speed of
 $V=6.2\,\mathrm{m}\,\rm s^{-1}$
, the maximum ice deflection ultimately converges to a steady value. The fluctuations observed are due to constructive interference. Since this interference is relatively weak, the maximum ice deflection converges quicker.
It is worth noting that the temporal evolution curves in figure 21 are less smooth than those in figures 16, 17 and 22. In figure 19, the maximum ice deflection typically occurs directly beneath the load. However, a special situation is observed in figure 18(c), where constructive interference causes the maximum deflection to shift away from the load position to nearby troughs. As the generated waves subsequently detach from the load, the maximum deflection relocates to the trough directly beneath the load, resulting in jagged curves seen in figure 21.
6.3. Validation
To validate the accuracy of the cubic model for simulating the response of a variable-velocity load, numerical results are compared with the linear analytical solution provided in (3.9). Evaluating this solution necessitates the use of numerical methods due to its complex temporal integral. The time integral can be computed efficiently using the recurrence relations (3.11) and (3.12). The calculation involves evaluating operators using the fast Fourier transform and its inverse. To ensure the accuracy of the results, the time step size is set at
 $\Delta T=0.00001$
, while all other physical parameters remain consistent with those used in the preceding sections.
A comparison between the analytical solution derived from linear theory and numerical simulations of the cubic model at various times: (a) 1.56 s; (b) 3.10 s; (c) 4.64 s and (d) 6.20 s. The left side corresponds to the acceleration case with
 $a_c=1\,\mathrm{m}\,\rm s^{-2}$
, while the right side represents the deceleration case with
 $a_d=-1\,\mathrm{m}\,\rm s^{-2}$
. In both cases, the final and initial velocities are
 $V=6.2\,\mathrm{m}\,\rm s^{-1}$
. The vertical coordinate (
 $\eta$
, in mm) indicates ice deflection, whereas the horizontal coordinate (
 $x$
, in m) represents displacement. The red curves illustrate the analytical solutions and the blue curves depict the numerical simulations of the cubic model, with the load positioned at the origin.

Taking examples of uniformly accelerated motion (
 $a_c=1\,\mathrm{m}\,\rm s^{-2}$
) and uniformly decelerated motion (
 $a_d=-1\,\mathrm{m}\,\rm s^{-2}$
), comparative results are shown in figure 23. There is excellent agreement between the linear analytical solutions and the results from the cubic model, which confirms the model’s effectiveness in simulating variable-velocity load problems. This agreement reflects the predominantly linear behaviour of the system during variable-speed motion of the load, consistent with the findings of Miles & Sneyd (Reference Miles and Sneyd2003), Johnsen et al. (Reference Johnsen, Kalisch and Părău2022) and Hosking & Milinazzo (Reference Hosking and Milinazzo2022). Finally, we should emphasise that using a variable speed method, whether through acceleration or deceleration, is an effective approach to swiftly cross the critical speed and prevent substantial deformation of ice covers in practice.
7. Conclusion
In this paper, we investigate how a floating ice sheet responds to a moving load, taking into account the combined effects of nonlinearity, inertia and viscosity. We have expanded the existing models proposed by Dinvay et al. (Reference Dinvay, Kalisch and Părău2019) and Meng & Wang (Reference Meng and Wang2022) by introducing more effective nonlinear terms in the 3-D problem and improving the viscous component. We derived the BRDS equation for both the quadratic and cubic DNO-truncation models, and compared the bifurcation curves obtained from each. Additionally, we reduced the cubic model to two dimensions and validated it against results obtained from the full Euler equations, thereby demonstrating its accuracy and reliability.
The cubic model was solved numerically, and the results were compared with experimental measurements conducted by Takizawa (Reference Takizawa1985) for shallow-water conditions and by Squire et al. (Reference Squire, Robinson, Langhorne and Haskell1988) for deep-water conditions. When compared with the 2-D outcomes from Dinvay et al. (Reference Dinvay, Kalisch and Părău2019) and Meng & Wang (Reference Meng and Wang2022), the 3-D simulations achieved a better agreement with the experimental records for both shallow-water and deep-water scenarios. This suggests that the cubic model is more effective for practical applications.
Using the cubic model, we further explored the problem of loads with variable speeds and investigated the mechanism behind constructive interference. Our findings indicate that when a load accelerates from rest or a low speed to a supercritical velocity, this acceleration process increases the maximum deflection of the ice compared with when the load moves at a constant velocity. The longer the duration of the acceleration, the more pronounced this effect becomes. Similarly, decelerating a supercritical load towards rest also enhances the maximum ice deflection, with the amplification increasing as the deceleration time extends. However, when the initial velocity for deceleration or the target velocity for acceleration is below or near the critical velocity, the amplification effect diminishes to a negligible level. Therefore, we conclude that for vehicles or aircraft travelling on ice sheets, shorter acceleration and deceleration durations, combined with higher rates of acceleration and deceleration, contribute to safer travel. Finally, a comparison with the linear theoretical model validates the accuracy of the cubic model in simulating variable-speed scenarios. This study focuses on the most representative scenario of uniformly accelerated or decelerated linear motion; however, the actual movement of vehicles or aircraft on ice sheets is undoubtedly more complex. Research on changes in the direction of a moving load has already been conducted (Johnsen et al. Reference Johnsen, Kalisch and Părău2022), which may serve as an important avenue for future work. Moreover, identifying appropriate variable-speed motions to observe apparent nonlinear hydroelastic wave phenomena in the moving load problem is another intriguing area of study.
Acknowledgements
The authors would like to thank G. Hu (Institute of Mechanics, CAS) for insightful discussions on the numerical schemes used in this work.
Funding
This work was supported by the National Science Foundation of China (Nos. 12325207, 42450111) and the International Partnership Program of the Chinese Academy of Sciences (No. 025GJHZ2024047 GC).
Declaration of interests
The authors report no conflict of interest.
Data availability statement
The data that support the findings of this study are available from the corresponding author.