The presence of clay minerals as gangue minerals has been determined in various ore deposits, including complex sulfide polymetallic ores that are associated with clay-alteration zones. During flotation of these ores, problems are encountered due to the difficulty in liberalizing mineral grains, as well as in terms of their chemical and physical heterogeneity. As it is not possible to prevent or reduce the formation of clay, it is necessary to minimize the harmful effects of clay minerals on flotation (Aslan, Reference Aslan1996). In addition, the existence of only a limited number of high-grade ores in mineral-processing plants over the years increases the need for the enrichment of high-clay-content and low-grade ores. Therefore, it is important to understand the mineralogy of clay minerals. Clay minerals are the main gangue minerals in these ores causing difficulties in the flotation of valuable minerals (Ndlovu et al., Reference Ndlovu, Farrokhpay and Bradshaw2013).
At present, no reliable methods are available to diminish the detrimental effects of clay minerals, particularly in the flotation of gold and copper ores. The adverse effects of clay minerals in flotation have been attributed to slime coating (Edwards et al., Reference Edwards, Kipkie and Agar1980; Arnold & Aplan, Reference Arnold and Aplan1986; Peng & Zhao, Reference Peng and Zhao2011), slurry viscosity (Patra et al., Reference Patra, Bhambhani, Nagaraj and Somasundaran2012; Zhang & Peng, Reference Zhang and Peng2015), entrainment (Liu & Peng, Reference Liu and Peng2014, Wang et al., Reference Wang, Peng, Nicholson and Lauten2015) or froth stability (Oats et al., Reference Oats, Ozdemir and Nguyen2010; Farrokhpay & Ndlovu, Reference Farrokhpay and Ndlovu2013). Slime coating has been attributed to the electrostatic interactions among oppositely charged mineral particles (Edwards et al., Reference Edwards, Kipkie and Agar1980; Trahar, Reference Trahar1981; Arnold & Aplan, Reference Arnold and Aplan1986; Forbes et al., Reference Forbes, Davey and Smith2014). In flotation, entrainment is undesirable because it stops the recovery of hydrophilic gangue minerals and fine particles, reducing the concentrate grade (Little et al., Reference Little, Wiese, Becker, Mainza and Ross2016). Froth stability is critical to recovery and selectivity in flotation (Tang et al., Reference Tang, Xiao, Tang and Jiang1989; Barbian et al., Reference Barbian, Hadler, Ventura-Medina and Cilliers2005). Managing the over-stable froth is often difficult. Froth stability depends on the frother type and quantity, the nature of the suspended particles, the hydrophobicity and the size of the particles (Farrokhpay, Reference Farrokhpay2011). Clay particles can be transported into the flotation concentrates through the mechanisms described above, which can dramatically reduce the quality of the concentrates. Preventing these sub-processes is important for operating engineers to reduce recirculating loads from the cleaner stages as compared to developing the final concentrate grade (Cilek et al., Reference Cilek, Akcil and Ozgen2009).
Pyrite is the mineral associated with chalcopyrite, and it is necessary for the selective depression of pyrite in order to improve copper flotation performance. Although previous work has demonstrated the detrimental effects of clay minerals on flotation, there is currently no information regarding the flotation behaviour of pyrite in these studies (Peng & Zhao, Reference Peng and Zhao2011; Forbes et al., Reference Forbes, Davey and Smith2014; Ramirez et al., Reference Ramirez, Rojas, Gutierrez and Laskowski2018).
In this study, mathematical models were developed to demonstrate the influence of varying amounts of clay on flotation factors and to suggest solutions in the flotation plants. Optimum flotation conditions were determined in experiments with artificial ore samples containing variable amounts of illite. The effects of four different factors (frother concentration, dispersant concentration, froth height and airflow rate) were also studied. The behaviour of pyrite was also investigated during mixed chalcopyrite and illite flotation. The effects of illite on the froth stability, Sauter mean bubble diameter and flotation behaviour of chalcopyrite and pyrite were determined. The ζ-potential and froth images were used to further investigate the effects of illite on chalcopyrite flotation. The results provide theoretical guidance to industrial applications by determining the influence of illite and the interactions between the remaining flotation factors.
Materials and methods
The high-grade copper ore sample (150 kg) was obtained from Siirt-Madenkoy Copper Mine (Turkey). The ore was divided into three parts with a riffle splitter: two parts were used in the experiments and the other part was stored. The illite was procured from a clay mining company located in Konya (Turkey).
The flotation experiments were performed using sodium silicate (Na2SiO3) as the dispersant, Aerophine 3418A as the collector and methyl isobutyl carbinol (MIBC) as the frother. The collector obtained from Cytec Industries includes ~50% w/w sodium-diisobutyl dithiophosphinate dissolved in water. The pulp pH was controlled via the addition of sulfuric acid and lime. Tap water was utilized during the experiments.
Chemical analysis
Chemical analysis of copper ore was carried out using inductively coupled plasma mass spectrometry (ICP-MS; Perkin Elmer ELAN 9000) and inductively coupled plasma optical emission spectroscopy (ICP-OES; Agilent 5800). A 0.5 g sample split was digested to complete dryness with an acid solution of H2O–HF–HClO4–HNO3. To the residue was added 50% HCl, and this was heated using a mixing hot block. After cooling, the solutions were made up to volume with dilute HCl. A Malvern Panalytical Axio Fast Model X-ray fluorescence (XRF) spectrometer was used to determine the chemical composition of the illite sample using a LiBO2/Li2B4O7 flux.
X-ray diffraction
The mineralogical compositions of the copper ore and illite were determined with X-ray diffraction (XRD) using a Rigaku D/Max 2200 PC diffractometer with Cu-Kα radiation (λ = 1.5418 Å) operating at 40 kV and 40 mA. Mineral phases were identified using the 2004 database of the International Center for Diffraction Data (ICDD) according to the ASTM card index. The mineralogical composition of clay-bearing samples was determined according to Gundogdu (Reference Gundogdu1982) and Gundogdu & Yılmaz (Reference Gundogdu and Yılmaz1984). After removal of the organic matter with sodium hypochlorite, the samples were dispersed in distilled water and allowed to settle. The clay fractions were separated using the sedimentation method and the XRD traces were obtained by means of three preparations, namely air-dried, ethylene glycol-solvated and heated at 400°C. The XRD instrumental conditions used for the clay fractions were similar to those for whole-rock determinations.
Particle-size analysis
The copper ore was crushed to a size of 1.18 mm with a jaw crusher, followed by dry grinding in a rod mill such that 80% of the material would pass through a 106 μm sieve. The particle-size distributions of the copper ore and illite were determined with a Malvern Mastersizer 2000 particle-size analyser using very dilute suspensions (~0.1% solids) sonicated for 20 s after conditioning with dispersants.
Water analysis
For tap water analysis, the water was collected in 1 L plastic bottles with plastic screw caps. The water was analysed for trace metals (B, Ca, Cl, Fe, Mg, Na, Mn and Zn) using ICP-OES. The pH and electrical conductivity were measured using a multi-purpose pH-conductivity meter (WTW Inolab pH 720).
ζ-potential measurement
The ore was crushed with a jaw crusher. The chalcopyrite and pyrite grains with sizes between 2.8 and 1.0 mm were separated with tweezers and ground (80% of the particles <38 μm in size). The ground sample contained 15.24% Cu for chalcopyrite's ζ-potential measurement and 46.56% Fe for pyrite's ζ-potential measurement. The chalcopyrite, pyrite and illite ζ-potential values were recorded both for single and mixed mineral systems as a function of pH using a Zeta Plus instrument (Malvern). The ζ-potential was also measured in the presence of the collector (Aerophine 3418A) and dispersant (Na2SiO3).
Total organic carbon
The total organic carbon (TOC) was determined using a Shimadzu TOC-VCPN and TN (Total Nitrogen) instrument (Standard Method 5310B). The concentrate obtained in the flotation experiments was filtered, and the aqueous solution separated from the solid was subjected to TOC analysis. The purpose of TOC analysis was to determine the hydrocarbons remaining in the solution at the end of the flotation experiments that were not adsorbed on the chalcopyrite surface. Thus, the effects of clay type and ratio on collector adsorption were determined.
Scanning electron microscopy and energy-dispersive spectroscopy analysis
The concentrates, with the addition of 0–10% clay, were also collected, filtered, air-dried and analysed via scanning electron microscopy and energy-dispersive spectroscopy (SEM-EDS) using a Bruker Zeiss EVO LS 10 Se microscope. The samples for analysis were coated with a thin film of gold to ensure conductivity for imaging.
Flotation experiments
To investigate the effects of varying concentrations of illite (5–15 wt.%) on chalcopyrite and pyrite flotation, a range of artificial mixtures of the copper ore and illite were prepared. Experiments were performed in a 1.5 dm3 glass cell (Denver flotation machine) at a 10% solid ratio and an agitation speed of 1350 rpm. Initially, pulp pH was kept constant at ~11.5 and conditioned for 5 min. Then, the dispersant (100, 200 and 300 g t–1), collector (50 g t–1) and frother (80, 100 and 120 g t–1) were added and conditioned for 3, 3 and 1 min, respectively. The froth was scraped for 3 min and collected at a constant height every 5 s. Floated and unfloated particles were collected, filtered and dried. Subsequently, chemical analyses were performed using an atomic absorption spectrometer (AAS) to calculate the metallurgical balance for Cu and Fe and thus chalcopyrite and pyrite.
To determine the dynamic froth stability and the Sauter mean bubble diameter, the froth zone was videotaped using a video camera placed at the side of the cell. Froth images were taken during flotation and analysed for bubble-size distribution using Image Pro Premier software (Media Cybernetics). The mean froth stability values were calculated later for each test. The effects of illite on froth stability were examined using a column to determine the maximum froth height. The column is made of glass and has a non-overflowing cell feature with a large image capture area (17 × 4 cm2). It has been used previously to assess froth stability (Cilek & Karaca, Reference Cilek and Karaca2015). The same flotation conditions were used and the froth height was measured until an equilibrium height was reached after 3 min of flotation. The dynamic froth stability factor was calculated from Equation 1:

where Σ is the dynamic froth stability (s), H max is the maximum froth height at equilibrium (cm) (Bikerman, Reference Bikerman1973), A is the cross-section area of the cell (cm2) and Q a is the air volumetric flow rate (cm3/s) (Barbian et al., Reference Barbian, Hadler, Ventura-Medina and Cilliers2005; Cilek & Karaca, Reference Cilek and Karaca2015; Taner, Reference Taner2019). The Sauter mean bubble diameter (d32) is identified as the volume-to-surface mean bubble diameter (Equation 2):

where ni is the number of bubbles with diameter di (mm) (Sauter, Reference Sauter1926; Cilek & Karaca, Reference Cilek and Karaca2015).
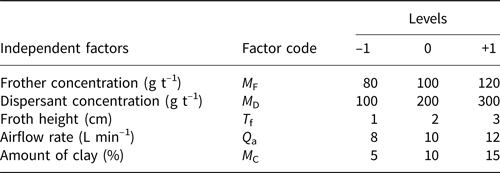
Statistical analysis was used to optimize the flotation conditions for chalcopyrite. The optimization stages in this work were: (1) performing experiments at the laboratory scale; (2) using analysis of variance to specify the important factors affecting the experiments; and (3) determining the optimal conditions from statistical models to maximize the grade and recovery. Response surface methodology (RSM) using the central composite design (CCD) of the experiments was employed to improve the mathematical model using statistical software. This design aims to optimize the response by considering that the independent factors are controllable and continuous during the experiments. Five factors (frother concentration (M F), dispersant concentration (M D), froth height (T f), airflow rate (Q a) and amount of clay (M C)) were investigated. These factors were grouped into three code levels: +1, 0 and –1 for high, intermediate and low values, respectively (Table 1).
Levels of factors used in the experiments.

Experimental data derived from the CCD model were defined using Equation 3:

where Y is the value of the response factor, β0, βi and βj are the model parameters, xi and xj are the factors studied, k is the number of factors and ɛ is a random error. The experimental test sequence was randomized to minimize the possibility of bias effects due to run order. Analysis of variance and regression equations were proposed for each response as a function of the factors. The analysis of variance method was adopted to measure the main and interaction effects of the factors on the responses. Six dependent responses (chalcopyrite grade and recovery (c C, R C), pyrite grade and recovery (c P, R P), dynamic froth stability (Σ) and Sauter mean bubble diameter (d32)) were selected as responses to evaluate the experimental results. The response values of the experiments were predicted using model equations and then compared with the experimental data. The effect was regarded as significant if the level of significance exceeded 95% (i.e. the models with p-values of <0.05 could be considered significant). The coefficient of determination (R 2) values for the models are listed in the analysis of variance.
Results and discussion
Material characterization
The chemical compositions of the copper ore and illite samples are listed in Table 2. The main elements in the copper ore are Cu and Fe. Si and Al are the dominant elements in the illite sample, along with minor amounts of K and Ti.
Chemical composition of the copper ore and illite (wt.%).

LOI = loss on ignition.
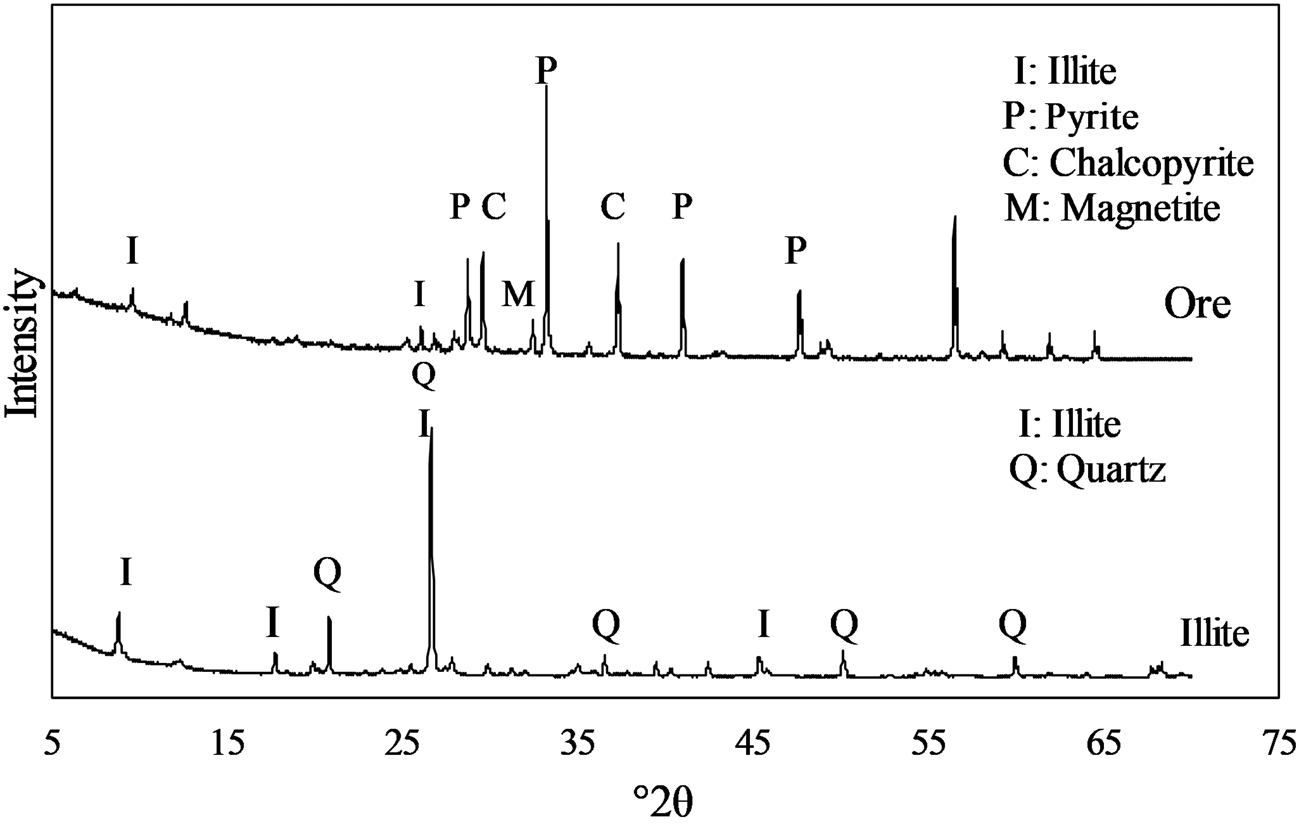
The XRD traces of the copper ore and illite samples are shown in Fig. 1. The copper ore consists of chalcopyrite, pyrite, illite and magnetite. The illite sample consists mainly of illite and minor quartz.
XRD traces of the copper ore and illite samples.

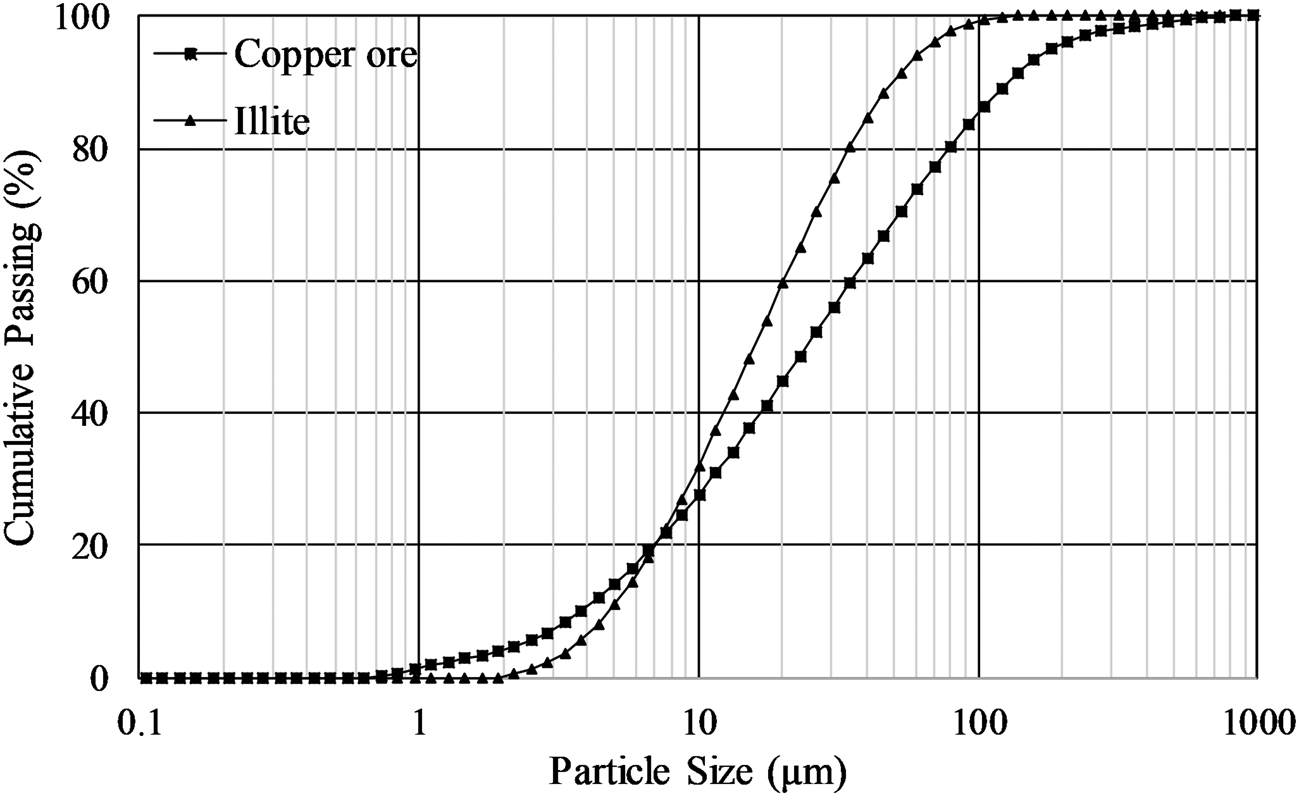
The particle-size distributions of the copper ore and illite samples are shown in Fig. 2. A total of 80% of the illite particles are <34 μm and 80% of the ground copper ore particles are <79 μm.
Particle-size distribution of the ground copper ore and illite samples.

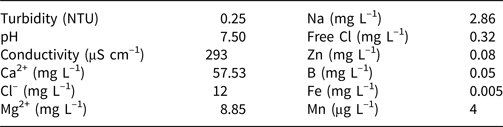
Table 3 shows the physical and chemical compositions of the tap water. Ca2+ is the main cation in the tap water. The presence of abundant Ca2+ would not cause problems in flotation experiments as high pH levels (11–12) were used.
Physical and chemical properties of the tap water.

NTU = nephelometric turbidity units.
Surface-charge properties of chalcopyrite, pyrite and illite
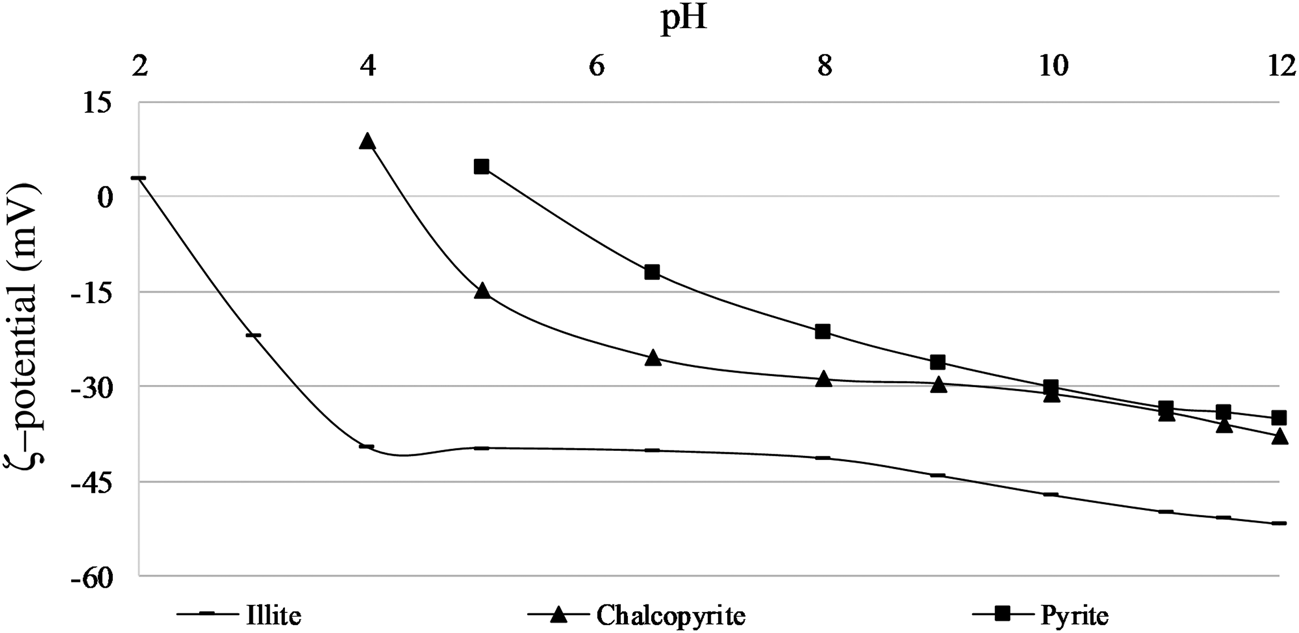
The ζ-potentials of chalcopyrite, pyrite and illite were evaluated as a function of pH in the pH range 2–12 (Fig. 3). The isoelectric point (IEP) for chalcopyrite was pH ~4.5, the IEP for pyrite was pH ~5.4 and the IEP for illite was pH ~2.1. These IEP values are in accord with values reported in the literature (Vergouw et al., Reference Vergouw, Difeo, Xu and Finch1998; Guan et al., Reference Guan, Zhong, Liu, Zha and Xia2009; Peng & Zhao, Reference Peng and Zhao2011; Reyes-Bozo et al., Reference Reyes-Bozo, Herrera-Urbina, Escudey, Godoy-Faúndez, Sáez-Navarrete, Herrera and Ginocchio2011; Farrokhpay & Ndlovu, Reference Farrokhpay and Ndlovu2013; Ndlovu et al., Reference Ndlovu, Forbes, Farrokhpay, Becker, Bradshaw and Deglon2014). The illite ζ-potential was more negative than the ζ-potentials of the other samples. In addition, the ζ-potential values are dependent on the pH. Hydroxide and hydrogen ions are potential determining ions for these minerals (Reyes-Bozo et al., Reference Reyes-Bozo, Escudey, Vyhmeister, Higueras, Godoy-Faundez and Salaza2015).
ζ-potentials of chalcopyrite, pyrite and illite as a function of pH.

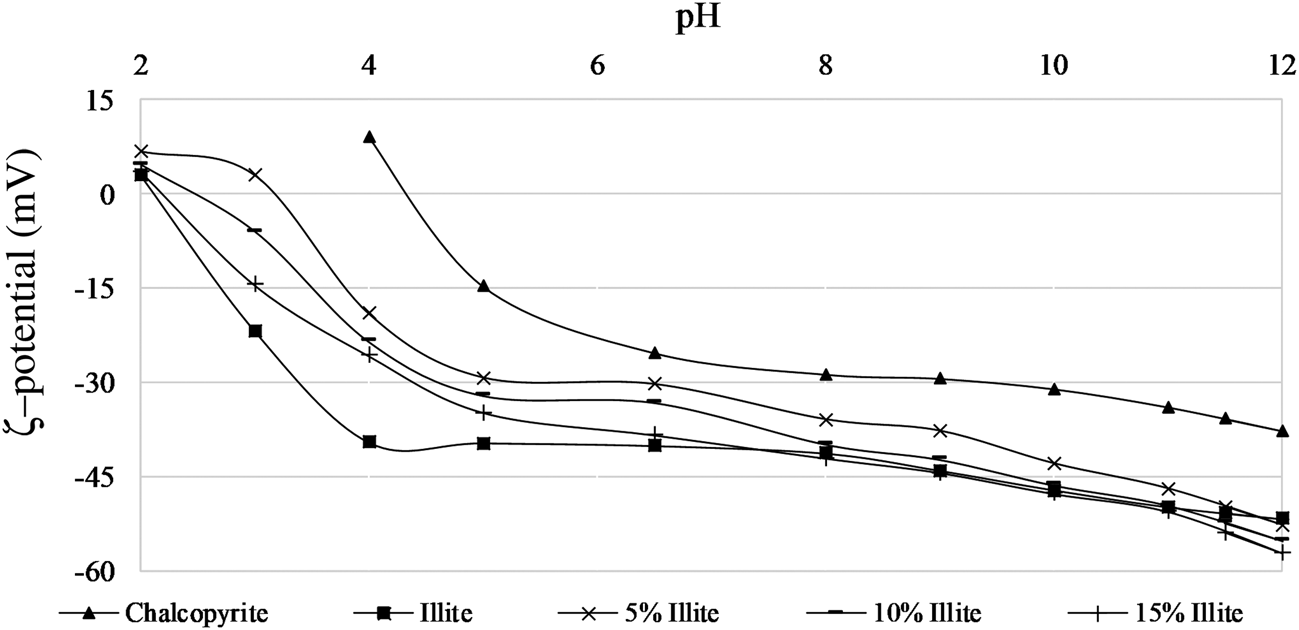
The ζ-potentials of the chalcopyrite and illite mixtures (at varying ratios) were also determined as a function of pH (Fig. 4). The ζ-potential values varied over the range of 0 to –60 mV. The pure chalcopyrite had a negative ζ-potential at pH >4.5, which decreased with the addition of illite, and the chalcopyrite IEP value was shifted at pH <3. The addition of 15% illite to the chalcopyrite produced ζ-potential values closer to that of pure illite, which indicated that the chalcopyrite surface was fully covered with illite. The ζ-potential of 15% illite and chalcopyrite mixture was the most negative, especially at pH 11–12, the range in which the flotation experiments were performed.
Effect of illite addition on the ζ-potential of chalcopyrite.

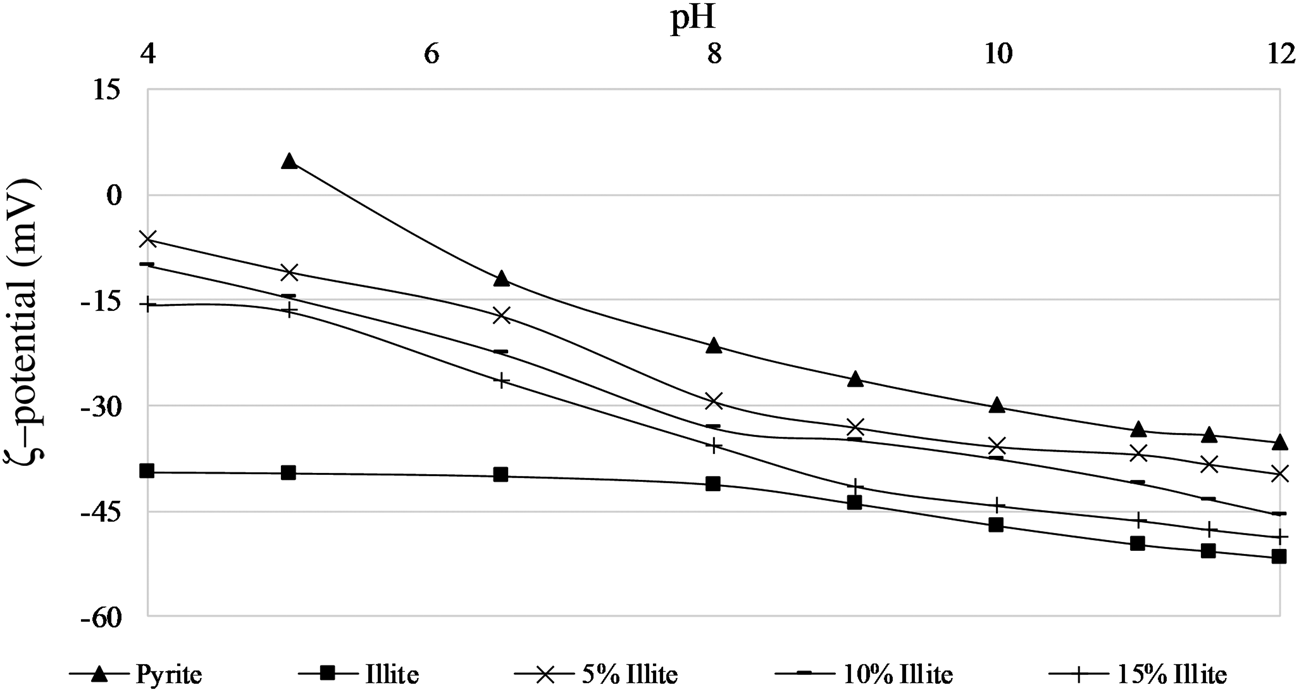
Similarly, ζ-potential measurements of the pyrite and illite mixtures were also obtained as a function of pH (Fig. 5). The ζ-potential curves of the pyrite and illite mixtures show a strong negative shift in the presence of 15% illite, suggesting that the addition of 15% illite resulted in the pyrite particles being covered with illite.
Effect of illite addition on the ζ-potential of pyrite.

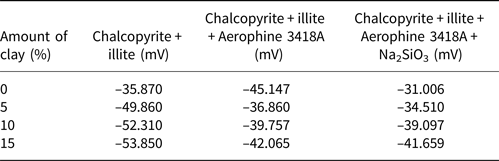
The interaction mechanisms between mineral particles and reagents and the extent to which the anionic Aerophine 3418A collector was adsorbed onto the chalcopyrite mineral surface under certain conditions were also studied. The effects of the collector (50 g t–1) and the dispersant (100 g t–1) on various illite quantities were examined. The ζ-potential of chalcopyrite decreased from –35.87 to –45.15 mV with the addition of the collector at pH 11.5, as expected (Table 4). However, the ζ-potential value of the mixture of chalcopyrite and 15% illite increased to –42.07 mV. In addition, the chalcopyrite ζ-potential values increased with the addition of Na2SiO3 from –35.87 to –31.01 mV at pH 11.5. However, Na2SiO3 did not interact strongly with the illite surfaces.
The effects of Aerophine 3418A and Na2SiO3 on the ζ-potentials of chalcopyrite and illite mixtures.

Being hydrophilic, illite may prevent the adsorption of collectors on chalcopyrite surfaces by forming a coating on these surfaces. This was confirmed by TOC analysis of the aqueous solutions that either did not contain clay or contained 15% clay. A concentration of 17.08 mg L–1 TOC was determined in the aqueous solution without clay, which a concentration of 14.25 mg L–1 TOC was determined in the aqueous solution containing 15% clay. When the TOC decreases, it is expected that more collectors will be adsorbed onto the mineral surface and the concentrate grade will increase. The chalcopyrite grades obtained as a result of the flotation experiments performed with the clay-containing and non-clay-containing samples were 39.4% and 46.36%, respectively. The decrease in the amount of TOC in the aqueous solution and, in parallel, the decrease in the concentrate grade when the solution contains clay suggests that the collector was adsorbed onto the clay surface and not onto the chalcopyrite surface. This confirms that the chalcopyrite surface was covered by illite crystals, which is in agreement with the ζ-potential measurements.
Flotation results
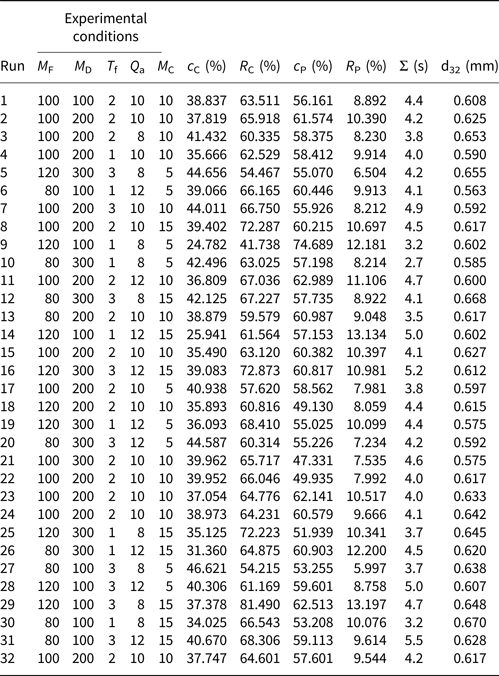
Effects of illite on chalcopyrite and pyrite flotation. The factor intervals were determined and a total of 32 experiments involving replications (six experiments each) were performed to confirm reproducibility. The experimental conditions and the results obtained from the flotation tests are listed in Table 5. The main aim of RSM is to define the ideal conditions for the desired results in an effective manner. In addition, the analysis of variance was also performed to assess the effects of each factor on six responses. The statistically significant factors are highlighted in bold. Some of the insignificant interactions are not included. The magnitude of the effect estimates the value and its positive or negative influence is indicated by a plus or minus sign, respectively.
Experimental data for the flotation results.

The results obtained are presented as two linear equations to predict all six responses. The positive and negative signs of the coefficients indicate the positive and negative effects on the responses. The equations obtained are as follows:


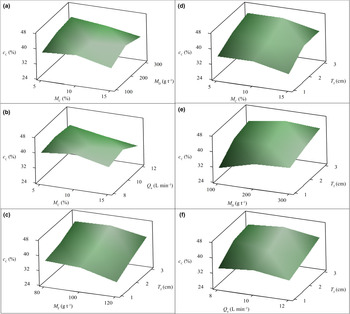
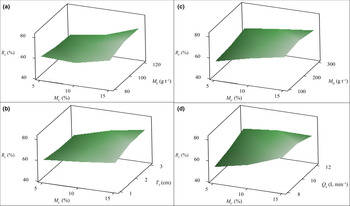
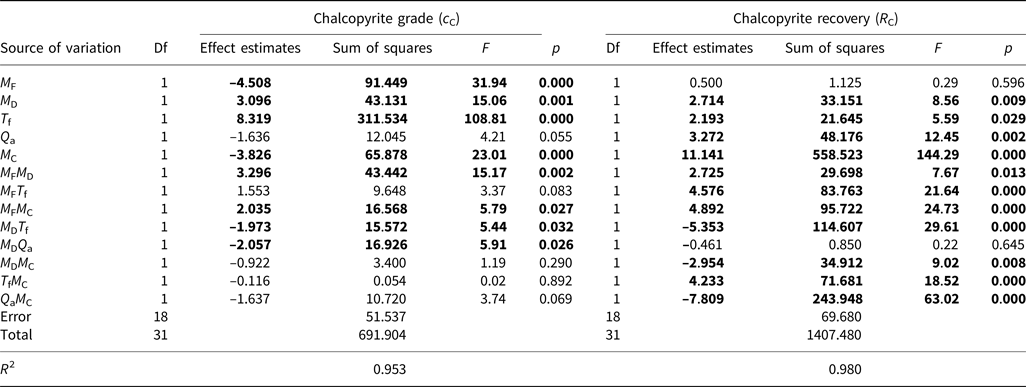
Table 6 lists the results of the analysis of variance of chalcopyrite grade and recovery. Bold text indicates a significant effect on a response. For a comprehensive understanding of the factors’ influences, predicted statistical models are defined in three-dimensional (3D) response surface plots (Figs 6 & 7). The plots were drawn between two factors while the other factors were held at the central level. Chalcopyrite recovery was significantly affected by the increase in the amount of clay, but chalcopyrite grade decreased, suggesting that some of the illite was entrained in the concentrate.
Response surface plots showing the effects of (a) M CM D, (b) M CQ a, (c) M FT f, (d) M CT f, (e) M DT f and (f) Q aT f on the chalcopyrite grade.

Response surface plots showing the effects of (a) M CM F, (b) M CT f, (c) M CM D and (d) M CQ a on the chalcopyrite recovery.

Analysis of variance for chalcopyrite grade and recovery. Statistically significant factors are highlighted in bold.

Df = degrees of freedom.
The dispersion/depression capacity of the dispersant was reduced at greater amounts of illite (Fig. 6a). Changing the dispersant concentration had a strong, statistically significant effect on chalcopyrite grade. A higher chalcopyrite grade was obtained at a higher froth height and an intermediate frother concentration (Fig. 6c). By contrast, the lowest chalcopyrite grade was observed at the greatest airflow rate and the lowest froth height (Fig. 6f). With increasing airflow rate, the degree of entrainment increased (Fig. 6b). The increase in the airflow rate increased the froth rising rate and increased the amount of fine-sized particles carried by the water between the bubbles into the concentrate. Thus, when mechanical entrainment increased, chalcopyrite grade decreased. As a result, at the highest froth height (T f = 3 cm), by preventing the transport of gangue minerals to the concentrate, chalcopyrite grade increased and degree of entrainment decreased. In addition, the effect of mechanical entrainment was reduced and chalcopyrite grade was increased with a low airflow rate and a high dispersant concentration. Chalcopyrite flotation was very sensitive to changes in the froth height (Fig. 6c–f).
The lowest chalcopyrite grade was 24.78% under conditions of the lowest froth height, the lowest dispersant concentration and the greatest frother concentration, while the highest chalcopyrite grade obtained was 46.62% under conditions of 5% clay, lowest airflow rate, 3 cm froth height, 100 g t–1 dispersant concentration and 80 g t–1 frother concentration. As frother concentration increased, chalcopyrite grade decreased. At a greater frother concentration a fast-entrained froth was formed and, accordingly, the fine-grained gangue minerals were carried to the concentrate by the water. By contrast, more brittle bubble structures were obtained at low frother concentrations.
The overall chalcopyrite recovery was improved by all of the factors mentioned due to both true flotation and entrainment of particles diluting the concentrate grade. The most important factors affecting chalcopyrite recovery were the amount of illitic clay, followed by airflow rate, dispersant concentration and froth height, respectively. Moreover, seven different interactions had significant effects. Increasing frother concentration enhanced chalcopyrite recovery but had a negligible effect on chalcopyrite grade (Fig. 7a), probably because an increase in frother concentration decreased the bubble diameter and the increased bubble surface area promoted the collection of more hydrophobic particles (Cilek & Umucu, Reference Cilek and Umucu2001). Chalcopyrite recovery improved significantly with increasing amounts of clay, whereas chalcopyrite recovery decreased with the increment of the froth height from 2 to 3 cm (Fig. 7b). With increasing froth height, the water films among the bubbles may reach a critical thickness and film rupture may occur (Cilek & Karaca, Reference Cilek and Karaca2015). Thus, chalcopyrite recovery decreased due to the detachment of mineral particles from the air bubbles. Chalcopyrite recovery was also increased with increasing dispersant concentration and airflow rate (Fig. 7c,d). By contrast, mechanical entrainment was affected significantly due to the interaction between froth height and airflow rate, and mechanical entrainment increased at shallow froth depths with increasing airflow rates (Wang et al., Reference Wang, Peng and Runge2016). Increased mechanical entrainment led to increased flotation recovery.
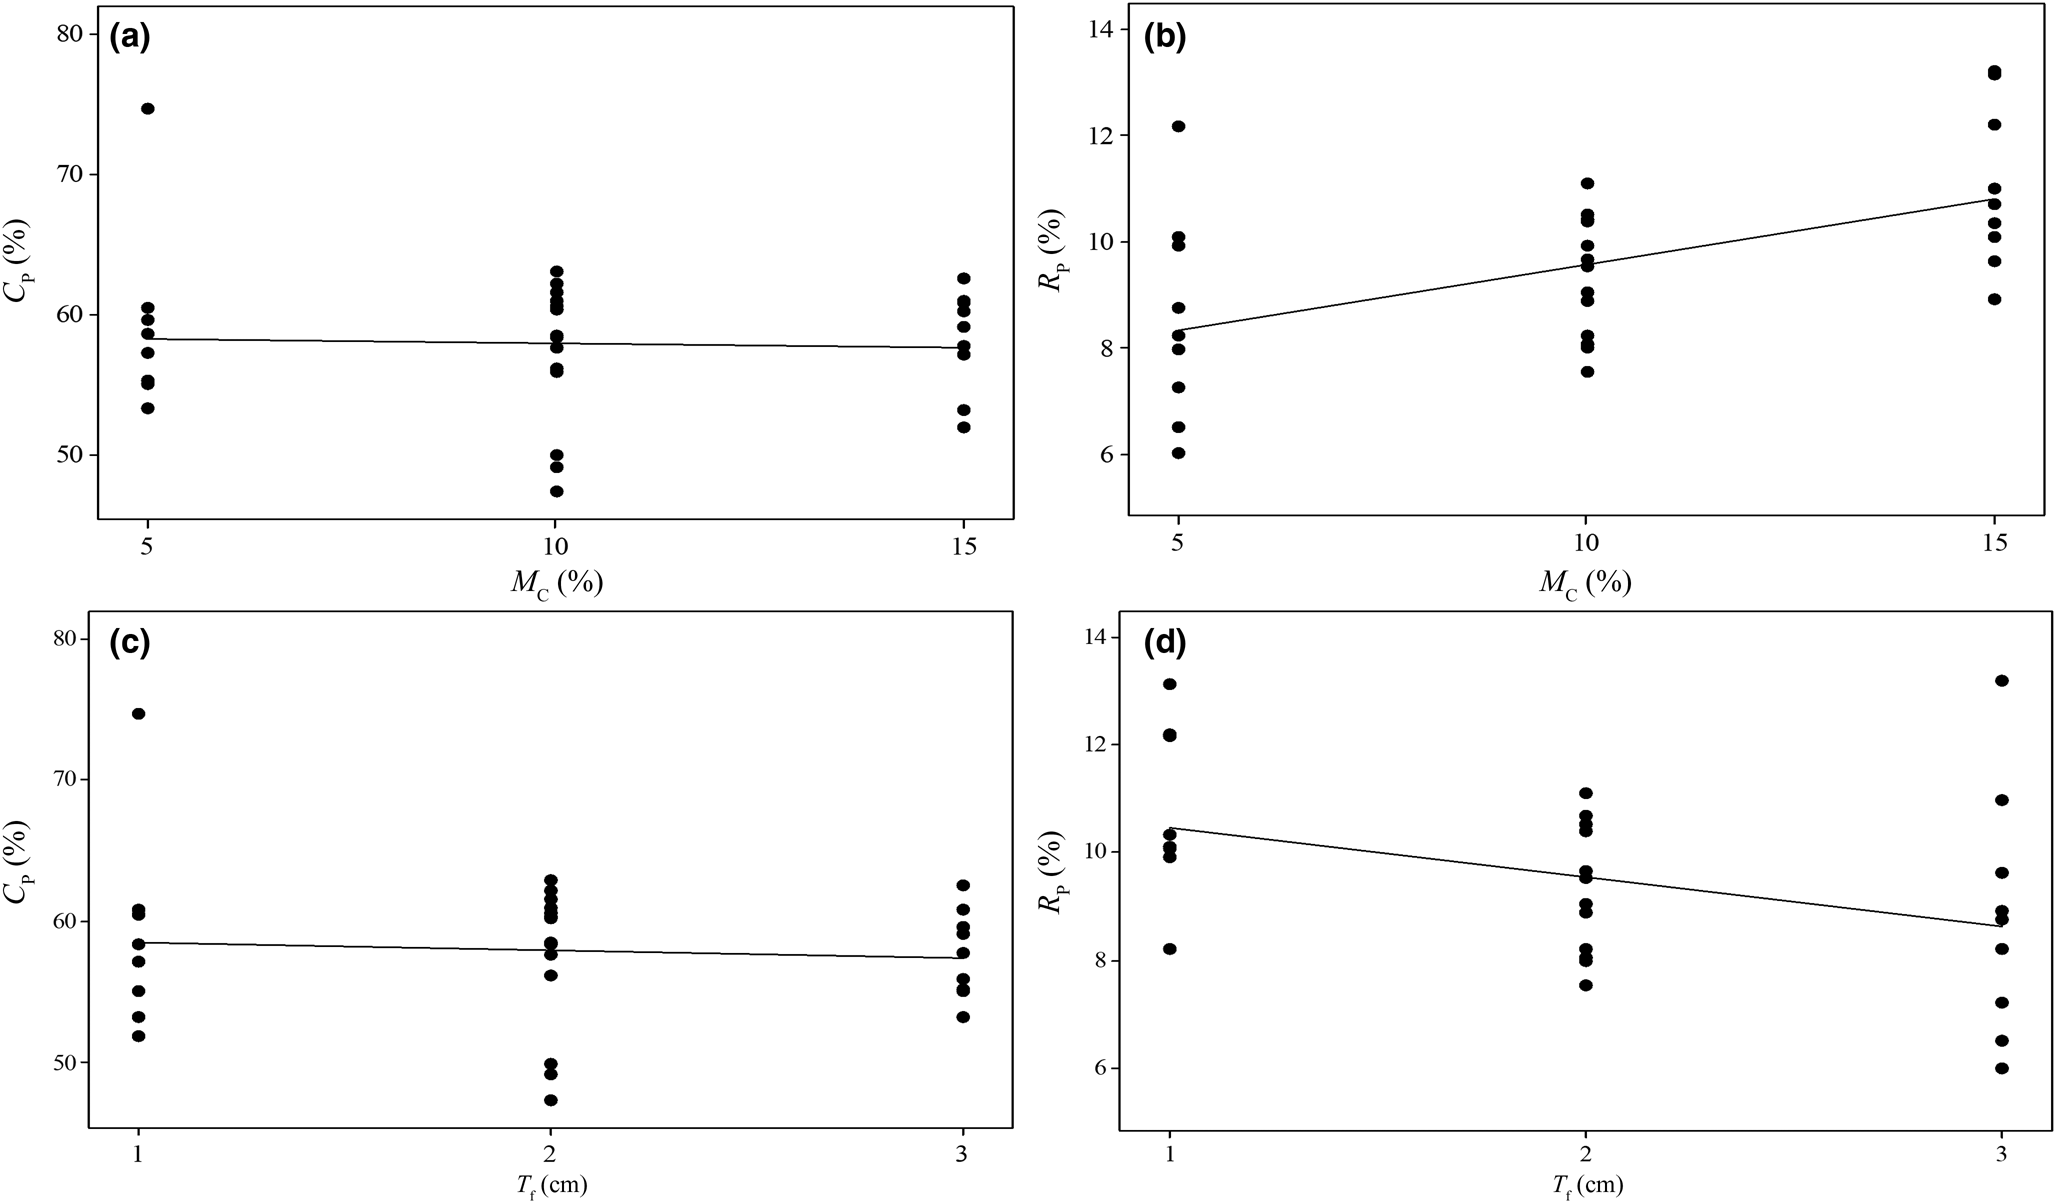
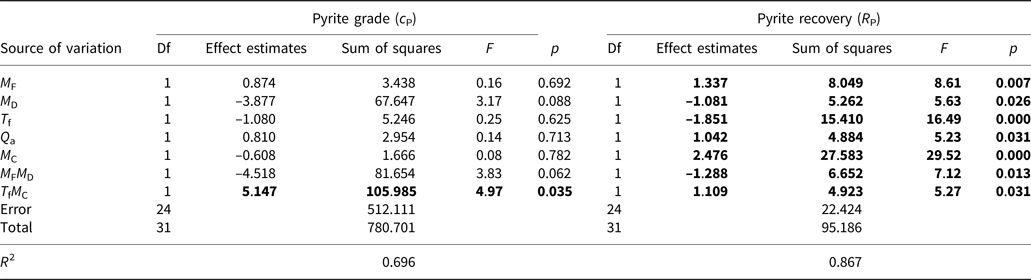
While pyrite grade was only affected by the interaction between froth height and amount of clay (Table 7), pyrite grade was not significantly modified by other factors and interactions. Pyrite demonstrated greater hydrophilic behaviour at great dispersant concentrations and high froth heights. Such dispersant concentrations were effective at depressing pyrite, while these high froth heights allowed the pyrite to move away from the froth zone. Increasing the froth height caused pyrite grade and recovery to decrease (Fig. 8c,d). By contrast, increasing frother concentration resulted in increases in pyrite grade and recovery. Pyrite grade decreased slightly with increasing amounts of clay (Fig. 8a). It is preferable to depress pyrite in chalcopyrite flotation and to obtain the lowest levels of pyrite grade and recovery in the concentrate.
Effects of the amount of clay on (a) pyrite grade and (b) pyrite recovery and the effects of froth height on (c) pyrite grade and (d) pyrite recovery.

Analysis of variance for pyrite grade and recovery. Statistically significant factors are highlighted in bold.

Df = degrees of freedom.
The most important factor that affects pyrite recovery is the amount of clay. Pyrite recovery also increased as frother concentration and airflow rate increased. In the experiments with the addition of 15% illite, pyrite recovery increased dramatically (Fig. 8b). Increased amounts of clay led to the transport of pyrite to the concentrate and negatively affected flotation. Changes in froth height reduced this negative effect.
The optimization criteria were defined to maximize the chalcopyrite in the concentrate while minimizing gangue minerals (pyrite and illite). Τhe amount of material transferred into the concentrate increased with increasing clay content. This was because illite was mechanically entrained in the froth due to its very fine particle size (80% of the particles <35 μm). As there is no selectivity for hydrophobic or hydrophilic minerals during mechanical entrainment, clay minerals were carried into the concentrate. In addition, both the ζ-potential measurements and the TOC measurements suggest that the illite coated the chalcopyrite surface. In this case, mechanical entrainment of illite and slime coating affected chalcopyrite flotation.
The effects of illite on the chalcopyrite flotation kinetics have been studied by Taner (Reference Taner2019) as a measure of chalcopyrite recovery and as a function of time. The most appropriate flotation time was 3 min. As the amount of illite increased, the chalcopyrite grade decreased significantly. The flotation rate constant generally increased with increasing amounts of illite. Clay minerals increased dramatically the rate constant at which the slow-floating components of the flotation pulp are recovered to the concentrate (Taner, Reference Taner2019).
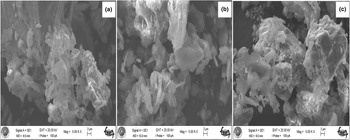
The SEM images of chalcopyrite and illite are shown in Fig. 9a,b. Figure 9c shows the SEM image of the chalcopyrite flotation concentrate in the presence of 10% illite. An illite layer formed around the chalcopyrite particles that are entrained in the chalcopyrite concentrate (Fig. 9c).
SEM images of (a) chalcopyrite, (b) illite and (c) 10% illite–chalcopyrite mixture concentrate.

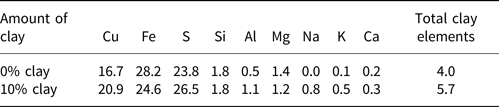
Semi-quantitative analyses using SEM-EDS are listed in Table 8. The original ore contained 4% K and Na, probably associated with clay minerals, which increased to 5.7% in flotation with the addition of 10% illite. These elements are also present in pure illite (Table 2), confirming the formation of an illite film on the chalcopyrite surface.
SEM-EDS analyses of the concentrates.

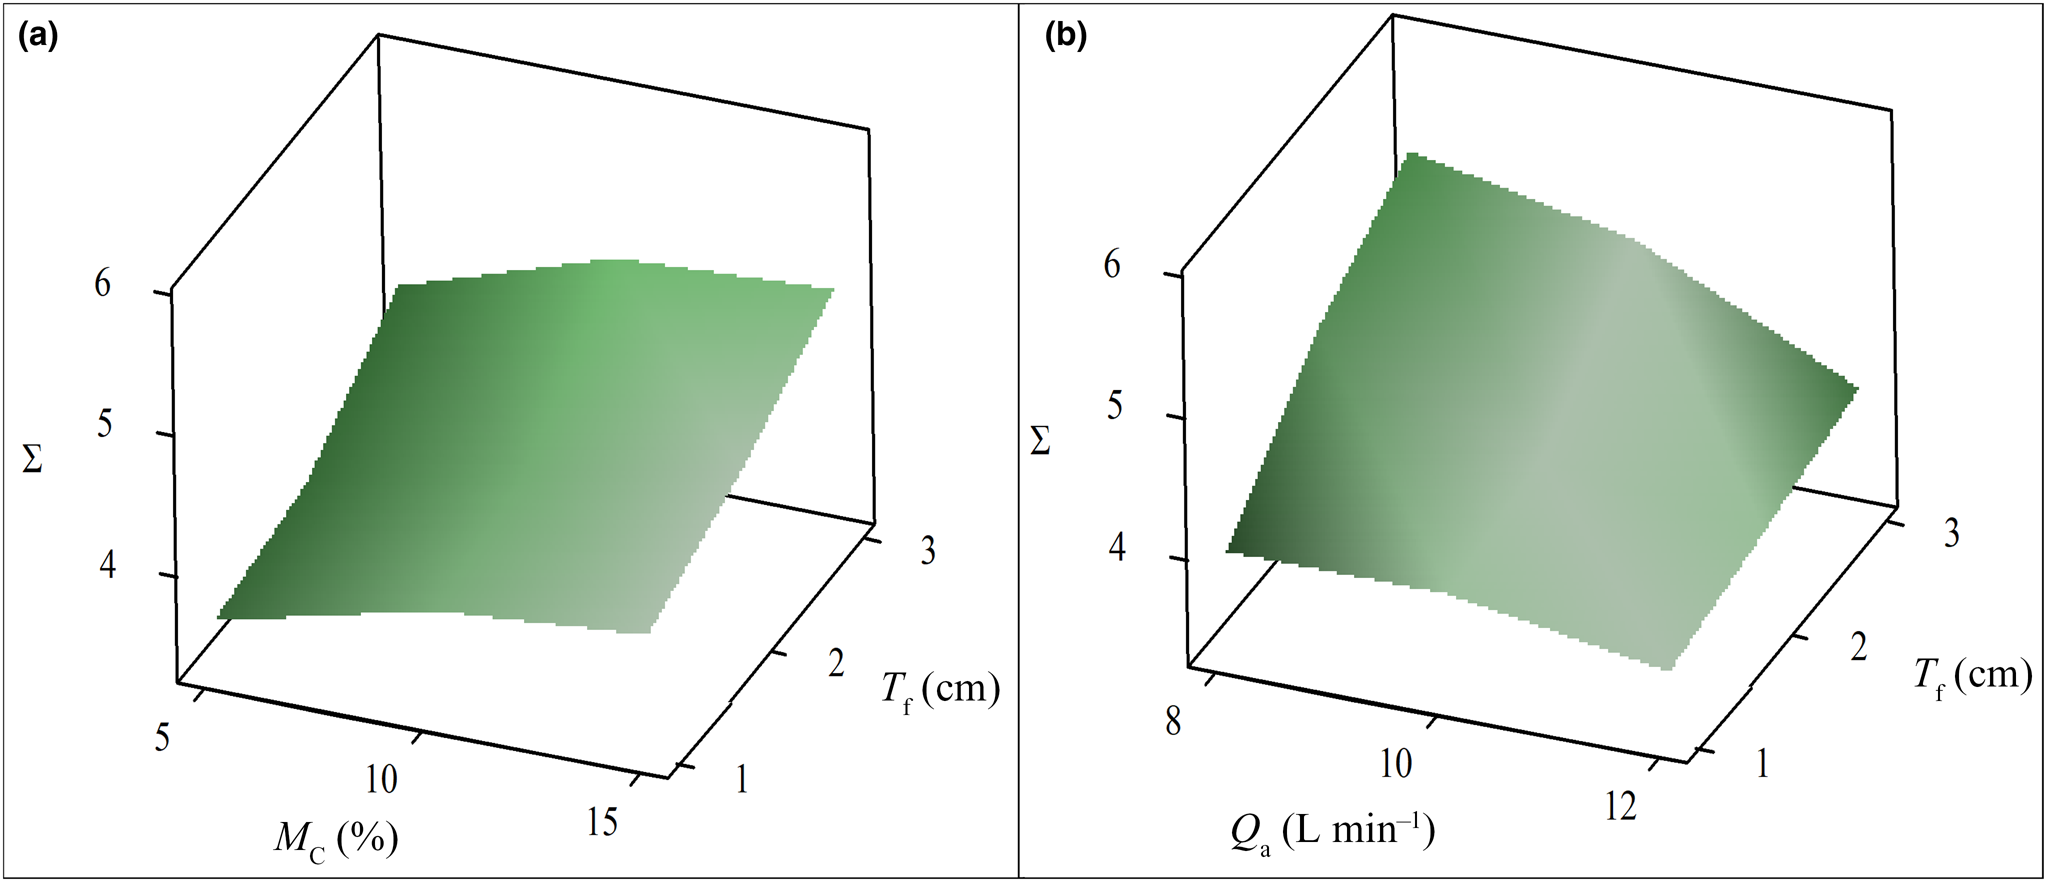
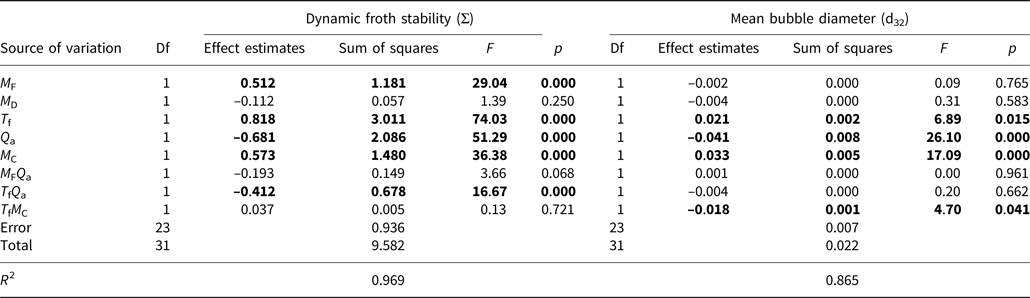
Effects of illite on froth stability and structure. Froth structure and stability control the recovery and selectivity of flotation (Wang et al., Reference Wang, Peng, Nicholson and Lauten2015). The amount of illite affected both the dynamic froth stability and the mean bubble diameter (Table 9). In dynamic froth stability, froth height is of paramount significance (Fig. 10a,b). The order of impact significance is froth height > airflow rate > amount of clay > frother concentration for dynamic froth stability. Dynamic froth stability improved as frother concentration increased with increasing amounts of clay and froth height, and it decreased with increasing airflow rate (Fig. 10b) (Cilek & Uysal, Reference Cilek and Uysal2018).
Response surface plots showing the effects of (a) M CT f and (b) Q aT f on the Σ value.

Analysis of variance for dynamic froth stability and mean bubble diameter. Statistically significant factors are highlighted in bold.

Df = degrees of freedom.
The analysis of variance for d32 underlines the importance of airflow rate, amount of clay and froth height. Under these conditions, the froth was not stable and collapsed (Barbian et al., Reference Barbian, Ventura-Medina and Cilliers2003). The mean bubble diameter increased with increasing amounts of clay. As the bubble diameter increased, the speed of the bubbles in the pulp increased and the movements of the bubbles became irregular and unstable. Therefore, illite significantly affected froth structure and stability.
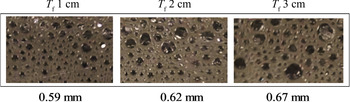
Smaller bubble diameters and greater froth stabilities are standard characteristics of entrainment (Subrahmanyam & Forssberg, Reference Subrahmanyam and Forssberg1988; Liu & Peng, Reference Liu and Peng2014; Wang et al., Reference Wang, Peng, Nicholson and Lauten2015). Hence, the reduction of chalcopyrite grade with increasing amount of illite was probably due to mechanical entrainment. Figure 11 shows the changes in the mean bubble diameter based on the froth height. The mean bubble diameter increased considerably from 0.59 to ~0.67 mm. The bubbles at a 3 cm froth height were larger than those at a 1 cm froth height (Fig. 11).
Mean bubble diameters based on froth height.

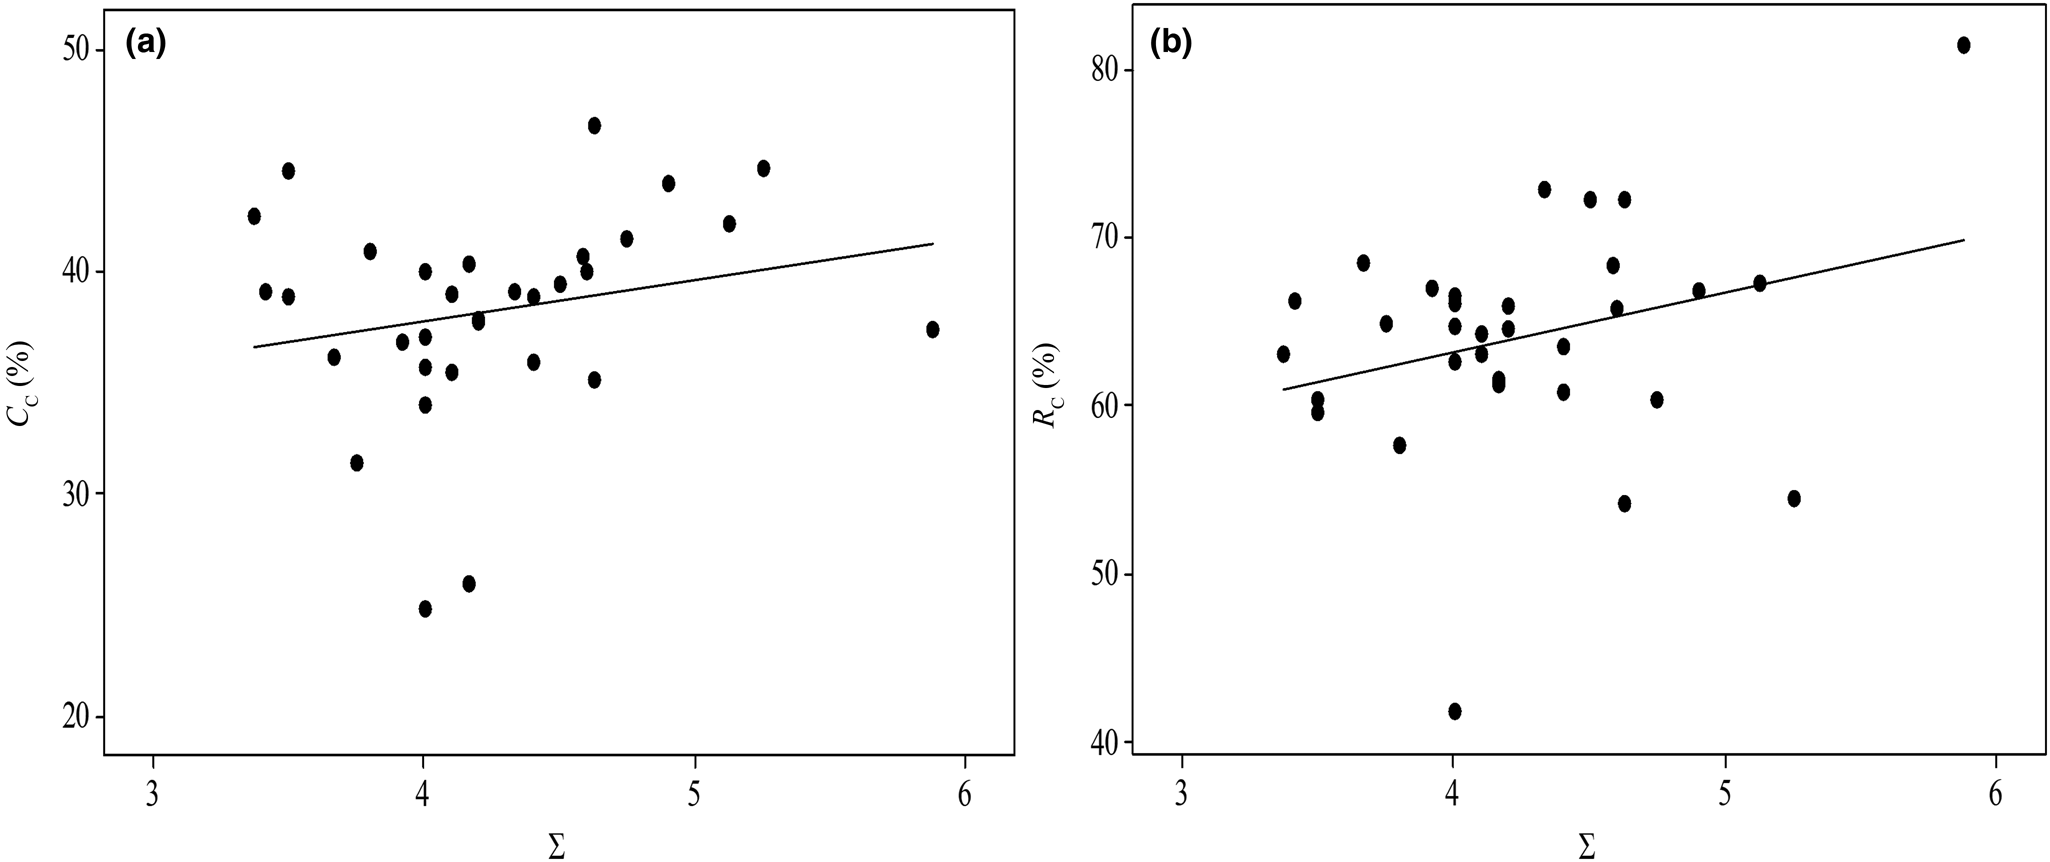
Dynamic froth stability is related to froth height and amount of froth. In flotation, clean concentrates can be obtained in deep froths with the appropriate level of dynamic froth stability. Hence, proper dynamic froth stability is required to achieve high flotation performance (Farrokhpay, Reference Farrokhpay2011; Cilek & Uysal, Reference Cilek and Uysal2018). As froth height increased under the influence of illite, chalcopyrite grade and dynamic froth stability were improved. Small bubbles tend to form a more stable froth. Therefore, the distribution of the bubble diameter is a significant performance criterion in flotation (Kurniawan et al., Reference Kurniawan, Ozdemir, Nguyen, Ofori and Firth2011). High viscosity yields larger bubbles and low viscosity yields smaller bubbles. An evaluation of the factors affecting chalcopyrite grade and recovery and dynamic froth stability is shown in Fig. 12. With increasing dynamic froth stability, chalcopyrite grade and recovery were improved.
Effects of dynamic froth stability on (a) chalcopyrite grade and (b) chalcopyrite recovery.

Illite decreased the copper/gold grade to a lesser degree than kaolinite due to its lack of edge-to-face contacts for creating porous network structures (Chen & Peng, Reference Chen and Peng2018). This suggests that the properties and structures of clay minerals are important to determining entrainment in flotation. Although illite was identified as a clay mineral that causes fewer problems in flotation, it still causes a decrease of ~3.83% in chalcopyrite grade (Table 6).
Conclusions
The effects of illite on froth stability and flotation performance in chalcopyrite flotation were investigated. Concentrate grade and recovery as a function of the amount of illite and other flotation variables were defined by empirical models. The following conclusions can be drawn from this research:
• The ζ-potential values of the ore approached those of pure illite with increasing illite content. In addition, while the concentrate grade decreased with increasing illite content, the amount of TOC in the concentrated water decreased. These results suggest that illite formed a coating on the chalcopyrite surface, as was confirmed by SEM-EDS.
• The lowest chalcopyrite grade achieved was 24.78% under conditions of the lowest froth height, lowest dispersant concentration and greatest frother concentration, while the highest chalcopyrite grade achieved was 46.62% under conditions of 5% clay, lowest airflow rate, 3 cm froth height, 100 g t–1 dispersant concentration and 80 g t–1 frother concentration.
• An increase in illite content also caused mechanical entrainment characterized by greater dynamic froth stability and greater bubble diameter. A strong correlation holds between dynamic froth stability and the amount of clay.
• The concentrations of dispersant and frother played an important role in determining the influence of illite on chalcopyrite flotation. As the amount of clay increased, usage of these reagents increased. From the model coefficients, increasing the froth height decreased pyrite grade and recovery.
• With increasing clay content in the ore, the froth height increased and the transport of gangue minerals to the concentrate was prevented. The airflow rate changed the froth flow speed, decreasing significantly the dynamic froth stability. It is therefore necessary to work at low airflow rates as the clay content increases.
• When dealing with illite-containing ores, mitigation studies and formulations (high froth height, high dispersant concentration and low airflow rate) should be more focused on the froth phase.
Defining the flotation results with mathematical models, depending on the flotation variables, will provide an estimate of the flotation conditions that can be applied for efficient flotation in mining plants facing problems with clays. The results of this study will be useful in mineral processing when handling clay-containing ores.
Acknowledgements
The authors thank Prof Dr Emin Cafer Cilek of Suleyman Demirel University and Anuttam Patra of Luleå University of Technology for their valuable input and advice. The authors also thank Park Electric for valuable assistance with the sampling campaign.
Financial support
The authors acknowledge financial support of this study from the Directorship of Research Fund of Selcuk University with project number 16401051.