1 Introduction
A common aerodynamic noise generation mechanism occurs through the interaction between an aerofoil and a turbulent flow. Important examples include the fan broadband noise generated through the interaction between rotor wake turbulence and the leading edge of the downstream outlet guide vanes (OGV), and on wind turbines in which the blades rotate through large-scale atmospheric turbulence.
A method for reducing aerofoil interaction noise that has received considerable attention in recent years involves the introduction of serrations at the aerofoil leading edge (Hersh, Soderman & Hayden Reference Hersh, Soderman and Hayden1974; Clair et al. Reference Clair, Polacsek, Garrec, Reboul, Gruber and Joseph2013; Lau, Haeri & Kim Reference Lau, Haeri and Kim2013; Roger et al. Reference Roger, Schram, Santana and De2013; Chong et al. Reference Chong, Vathylakis, McEwen, Kemsley, Muhammad and Siddiqi2015; Narayanan et al. Reference Narayanan, Chaitanya, Haeri, Joseph, Kim and Polacsek2015; Kim, Haeri & Joseph Reference Kim, Haeri and Joseph2016; Chaitanya et al. Reference Chaitanya, Joseph, Narayanan, Vanderwel, Turner, Kim and Ganapathisubramani2017; Gea-Aguilera et al. Reference Gea-Aguilera, Gill, Angland and Zhang2017; Lyu & Azarpeyvand Reference Lyu and Azarpeyvand2017; Turner & Kim Reference Turner and Kim2017; Chaitanya & Joseph Reference Chaitanya and Joseph2018). These leading-edge serrations have been shown to be highly effective in reducing noise, whilst incurring a relatively small penalty in aerodynamic performance (Chong et al. Reference Chong, Vathylakis, McEwen, Kemsley, Muhammad and Siddiqi2015; Chaitanya et al. Reference Chaitanya, Joseph, Narayanan, Vanderwel, Turner, Kim and Ganapathisubramani2017). However, all of these earlier studies have been confined to single-wavelength leading-edge profiles. In this paper we propose an alternative design that offers considerably better noise reduction than the single-wavelength serration at optimal conditions.
Single-wavelength profiles have been shown to involve two dominant noise reduction mechanisms. One is due to a source cutoff effect arising from the obliqueness of the inclined leading edge (Clair et al. Reference Clair, Polacsek, Garrec, Reboul, Gruber and Joseph2013; Kim et al. Reference Kim, Haeri and Joseph2016). The second is due to interference between the sources along the serration leading edge. One of the main findings of Kim et al. (Reference Kim, Haeri and Joseph2016) is that the sources at the serration roots are dominant compared to the sources at the tip and along the oblique edge, and are similar in strength to the straight leading edge. The reason for this behaviour has been investigated by Turner & Kim (Reference Turner and Kim2017). They showed that the root of the serrated leading edge is the dominant noise source due to the presence of a secondary horseshoe-like vortex system generated by the serrated leading edge, which alters the upstream velocity field, thereby enhancing the source strength at the serration root.
Lyu & Azarpeyvand (Reference Lyu and Azarpeyvand2017) have developed a mathematical model to predict the sound radiated by serrated leading-edge geometries. The model is based on an iterative form of the Amiet approach solved using the Schwarzschild technique. The predictions are in close agreement with the experimental data. In this paper, Lyu & Azarpeyvand (Reference Lyu and Azarpeyvand2017) attribute the noise reduction mechanism to destructive interference of the scattered surface pressure induced by the presence of serrations.
The previous work by Chaitanya et al. (Reference Chaitanya, Joseph, Narayanan, Vanderwel, Turner, Kim and Ganapathisubramani2017) on single-wavelength serrations has demonstrated the existence of an optimum serration wavelength
 $\unicode[STIX]{x1D706}_{0}$
which is approximately four times the transverse integral length scale
 $\unicode[STIX]{x1D6EC}$
of the incoming turbulent flow. At this optimum serration wavelength, Chaitanya et al. (Reference Chaitanya, Joseph, Narayanan, Vanderwel, Turner, Kim and Ganapathisubramani2017) have shown that the reduction in sound power level (PWL) at frequency
 $f$
is given by
 $\unicode[STIX]{x0394}\text{PWL}(f)=10\log _{10}(fa/U)+10$
, where
 $a$
is the serration amplitude and
 $U$
is the velocity. This expression represents the upper limit on the possible reductions in sound power that can be achieved through the use of single-wavelength serrations and is determined only by the non-dimensional frequency
 $fa/U$
.
Chaitanya et al. (Reference Chaitanya, Joseph, Narayanan, Vanderwel, Turner, Kim and Ganapathisubramani2017) have outlined the reason for the existence of an optimum wavelength
 $\unicode[STIX]{x1D706}_{0}$
for single-wavelength serrations. They argued that this value corresponds to the minimum spanwise separation distance between adjacent roots at which the root sources just become incoherent. At smaller separation distances, therefore, adjacent roots interfere constructively, leading to a deterioration in the noise reduction performance. In the serration profile proposed here, therefore, the distance between roots is required to be less than this value in order to exploit the effects of interference between adjacent roots.
In this paper we propose an alternative leading-edge geometry that is able to provide significantly improved reductions in the sound power reduction compared to the maximum sound power reduction that can be obtained from single-wavelength serrations. The new profile provides noise reductions through a fundamentally different noise reduction mechanism from single-wavelength serrations at optimum conditions. Unlike single-wavelength profiles, the dominant source regions at the leading edge are arranged to be much closer than
 $\unicode[STIX]{x1D706}_{0}$
but separated in the streamwise direction and therefore interfere destructively. This design philosophy potentially leads to a new family of profiles which can provide significantly greater noise reduction than single-wavelength profiles. As we demonstrate below, this new design philosophy allows greater control of the frequency of maximum noise reduction and the frequency bandwidth over which noise reductions can be obtained. Preliminary experimental results confirming this new control concept were originally presented by Chaitanya et al. (Reference Chaitanya, Narayanan, Joseph and Kim2016) and validated by the numerical simulations of Turner et al. (Reference Turner, Kim, Chaitanya and Joseph2016).
Chaitanya et al. (Reference Chaitanya, Narayanan, Joseph and Kim2016) proposed a number of designs such as double-wavelength, chopped-peak and slitted profiles. The objective of these profiles is simply to introduce a source additional to the source at the root location which is displaced in the streamwise direction from the root source. These two compact sources therefore destructively interfere, thereby providing greater noise reductions than single-wavelength profiles alone.
A family of profiles that are found to be particularly effective in reducing interaction noise at low non-dimensional frequencies
 $fh/U$
involve the introduction of narrow slits. Their performance and noise reduction mechanism have been studied in detail in Chaitanya & Joseph (Reference Chaitanya and Joseph2018). In this paper it was shown conclusively that these narrow slits were effective in producing highly coherent sources at the root positions. At the optimum slit width the source strength at the root matches the source’s strength at the other end of the slit, leading to enhanced noise reductions. We show experimentally in Chaitanya & Joseph (Reference Chaitanya and Joseph2018) that noise reductions up to 18 dB at low frequencies can be achieved at
 $60~\text{m}~\text{s}^{-1}$
.
A comparison of all the leading-edge profiles has been presented by the authors of the current paper in Chaitanya, Joseph & Ayton (Reference Chaitanya, Joseph and Ayton2018) based on the noise reduction mechanism proposed in this paper. An analytical framework for predicting the noise reductions has been presented by Ayton & Chaitanya (Reference Ayton and Chaitanya2018).
A preliminary computational study of the noise reduction mechanism of the leading-edge slits has been performed by Cannard et al. (Reference Cannard, Joseph, Chaitanya and Kim2018). In this paper it is shown that the narrow slits are able to generate comparatively high source levels at the root through the formation of a secondary streamwise vortex generated along the edge of the slit and then interacting with the root. More work is currently underway to investigate this phenomenon.
One of the simplest profiles proposed in Chaitanya et al. (Reference Chaitanya, Narayanan, Joseph and Kim2016, Reference Chaitanya, Joseph and Ayton2018) simply comprises the superposition of two single-wavelength components of approximately the same amplitude but with one wavelength being approximately twice the second and shifted in phase. The advantage of this profile comprises nearly identical root sources which are separated in the streamwise direction. Upon interaction with a turbulent flow, therefore, near-identical radiation is generated at each root but with a phase difference corresponding to the time taken for the turbulent flow to convect between the two roots. Maximum noise reductions are obtained at the frequency at which the two roots radiate
 $180^{\circ }$
out of phase. The fundamental understanding of the noise reduction mechanism of this profile provides insight into the noise reduction mechanism of the general family of profiles investigated in Chaitanya et al. (Reference Chaitanya, Narayanan, Joseph and Kim2016, Reference Chaitanya, Joseph and Ayton2018).
This paper presents a detailed experimental investigation into the effectiveness of this double-wavelength concept on flat plates in a turbulent stream. The sensitivity of noise reductions to the streamwise and spanwise separation distance between adjacent roots is investigated in §§ 5.1 and 5.2. A simple model is proposed in § 6 to predict the reduction in sound power versus frequency and this provides physical insight into the influence of separation distance between the roots. Finally the optimum design is implemented on a 10 % thick, three-dimensional aerofoil. The noise reduction spectra, which are presented in § 8, are shown to be almost identical to those obtained on the flat plate.
2 Double-wavelength leading-edge serrations
The double-wavelength profile under investigation here is defined as the sum of two single-wavelength components of amplitudes
 $h_{1}$
and
 $h_{2}$
, and wavelengths
 $\unicode[STIX]{x1D706}_{1}$
and
 $\unicode[STIX]{x1D706}_{2}$
with phase difference
 $\unicode[STIX]{x1D719}$
. The chord length
 $c(r)$
at any radial position
 $r$
is therefore given by
 $$\begin{eqnarray}c(r)=c_{0}+h_{1}\sin (2\unicode[STIX]{x03C0}r/\unicode[STIX]{x1D706}_{1})+h_{2}\sin (2\unicode[STIX]{x03C0}r/\unicode[STIX]{x1D706}_{2}+\unicode[STIX]{x1D719}),\end{eqnarray}$$
where
 $c_{0}$
is the mean chord.
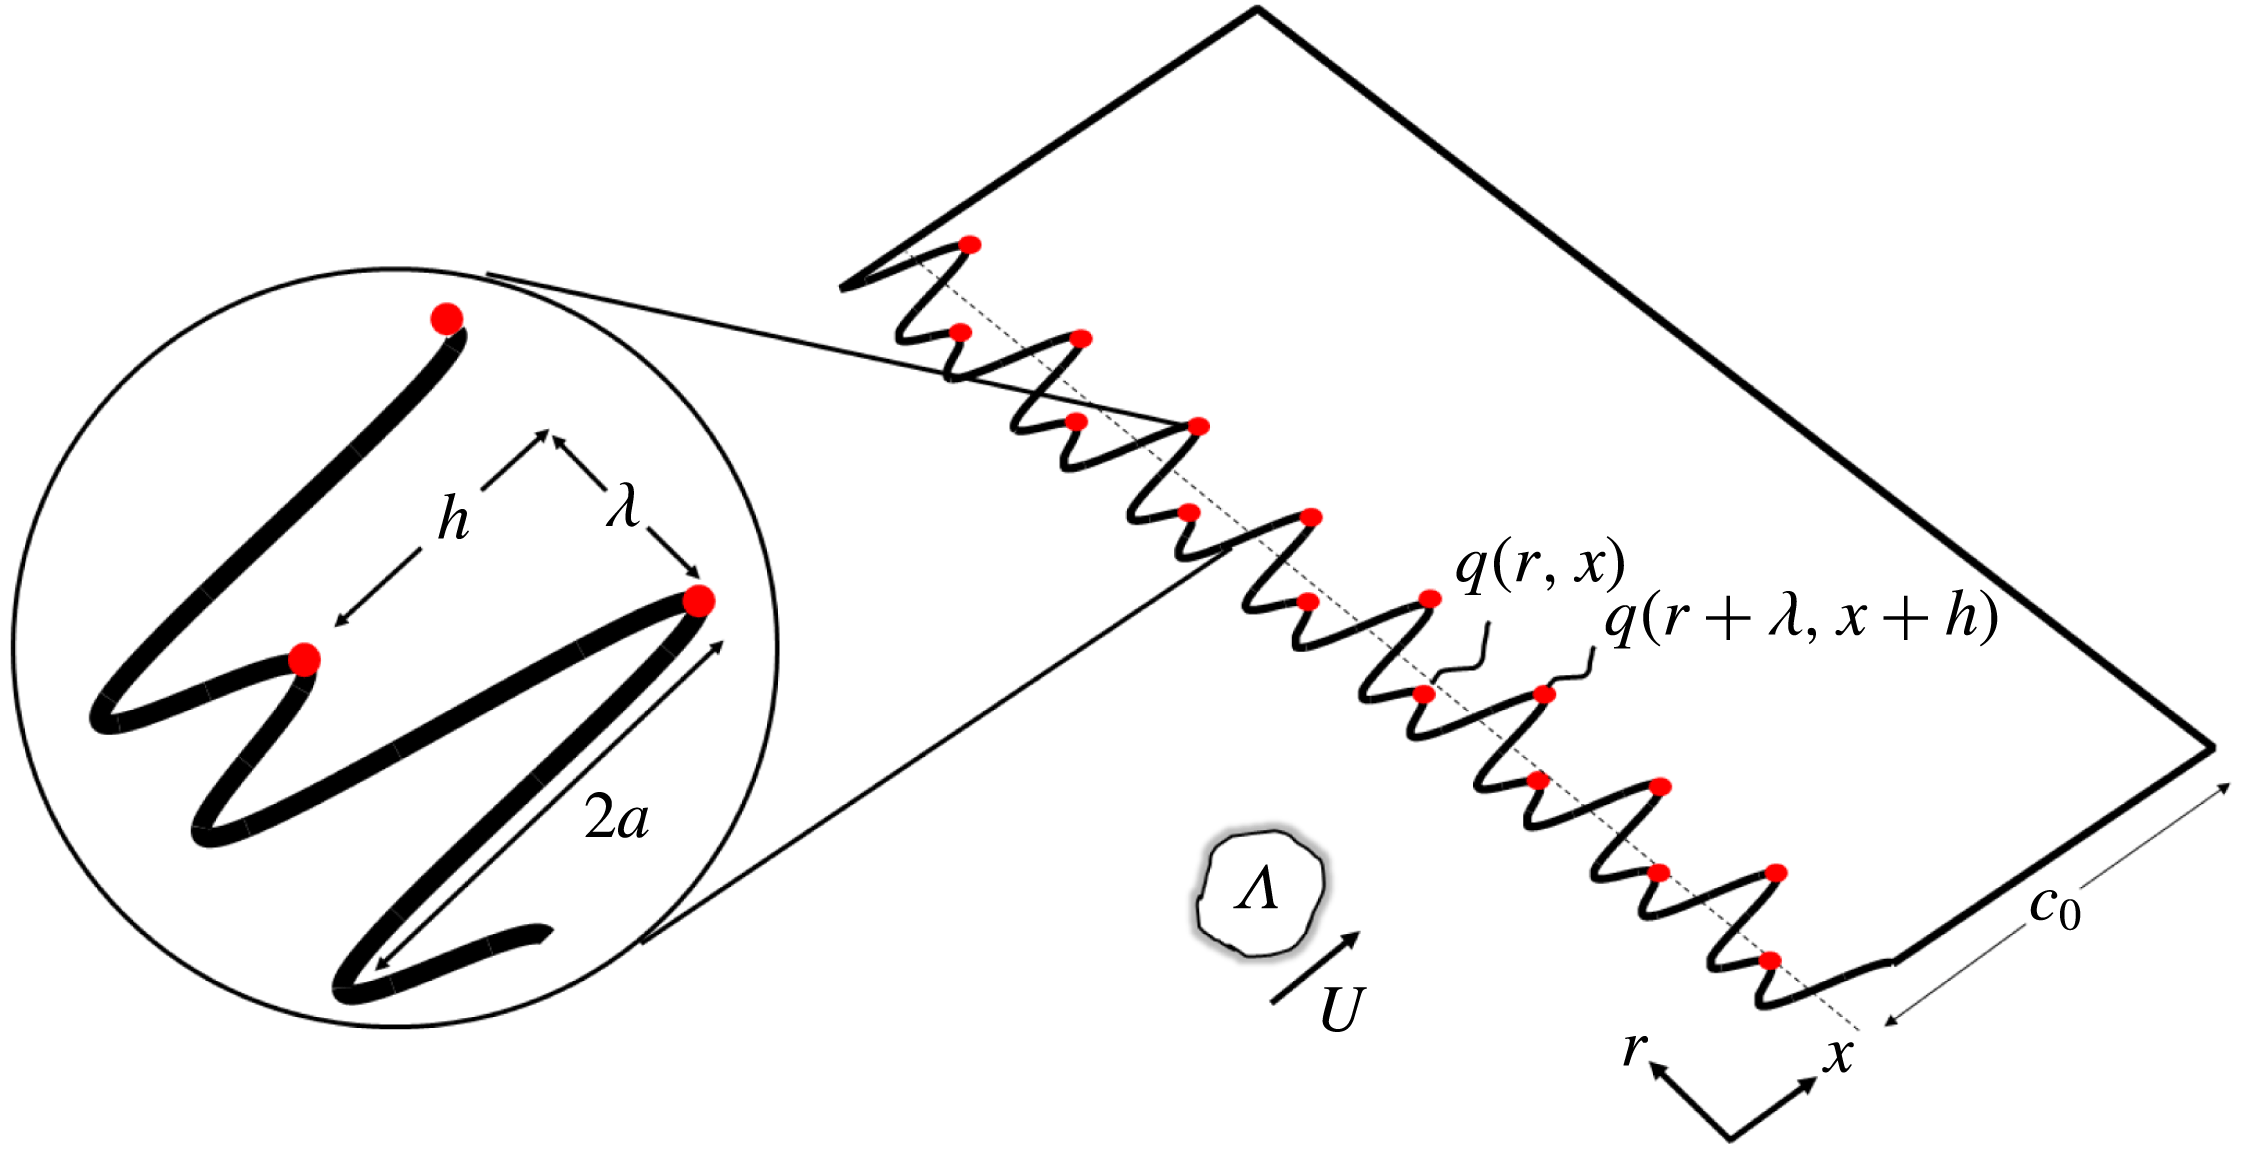
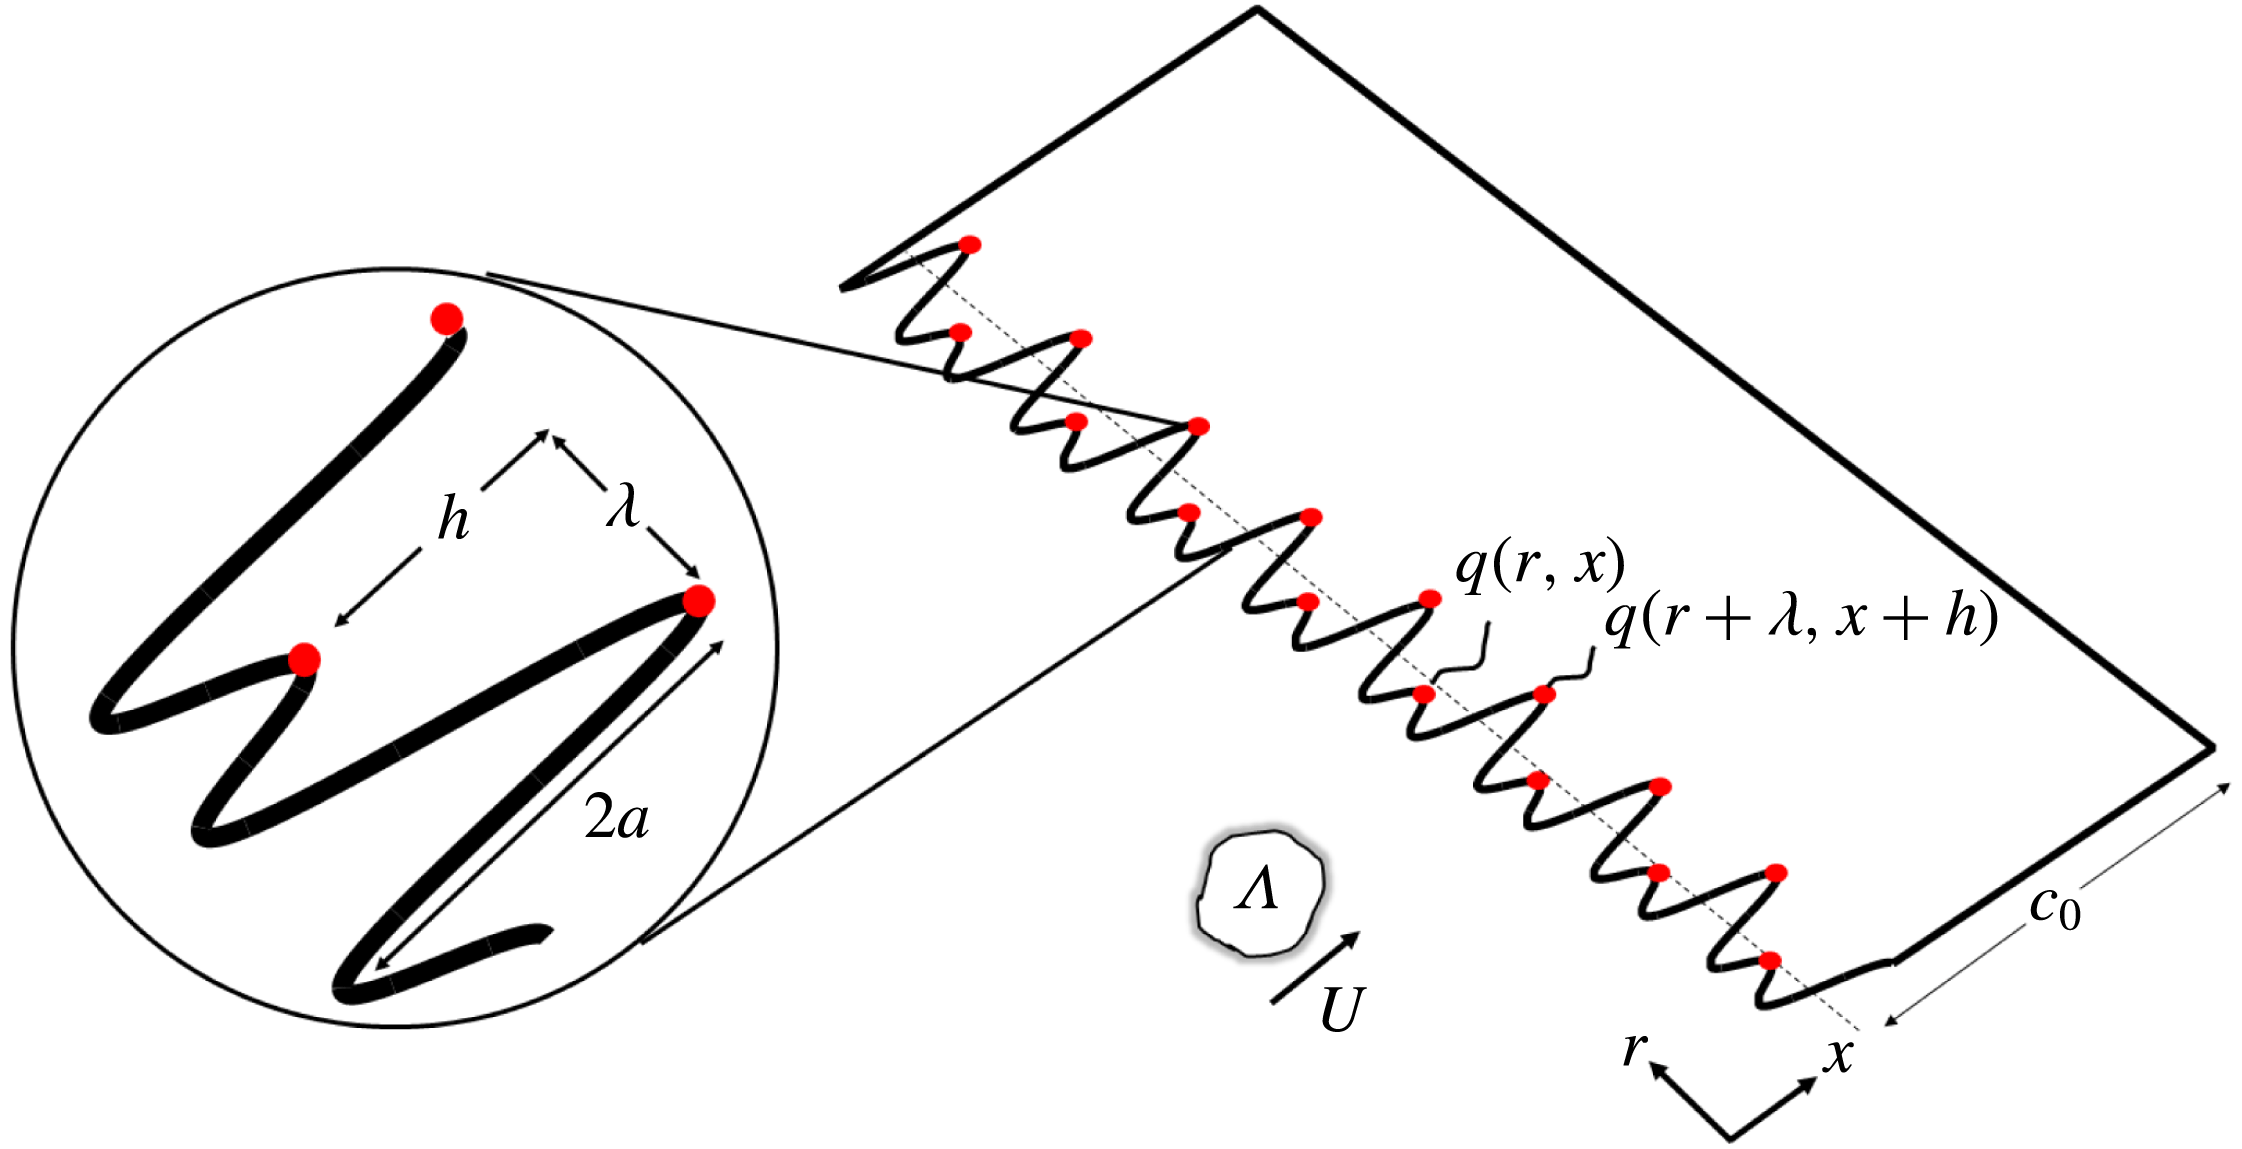
Adding two sinusoidal profiles has the desired property of forming two adjacent roots separated in the streamwise direction by
 $h$
and separated in the spanwise direction by
 $\unicode[STIX]{x1D706}$
, giving a total peak-to-root amplitude of
 $2a$
, as shown in the sketch in figure 1. The red dots in this figure represent the location of the compact source regions at the roots, which will form the basis of a simple model for predicting the noise reductions in § 6. This sketch also shows an upstream turbulent eddy impinging on the leading edge at a flow speed
 $U$
with transverse integral length scale
 $\unicode[STIX]{x1D6EC}$
. Note that no simple relationship exists between the single-wavelength parameters
 $h_{1,2}$
,
 $\unicode[STIX]{x1D706}_{1,2}$
, the phase difference
 $\unicode[STIX]{x1D719}$
and the distances
 $h$
and
 $\unicode[STIX]{x1D706}$
, which we show below are central to the performance of the double-wavelength serration. These distances must therefore be obtained by trial and error to provide the necessary values identified below for best control performance.
The profile sketched in figure 1 is designed to produce near-identical sources at the roots but which differ in phase by
 $\unicode[STIX]{x1D719}(\unicode[STIX]{x1D714})=\unicode[STIX]{x1D714}h/U$
by virtue of being separated in the streamwise direction by a distance
 $h$
. This profile therefore leads to less efficient radiation at the frequency
 $\unicode[STIX]{x1D714}_{0}$
, i.e.
 $\unicode[STIX]{x1D719}(\unicode[STIX]{x1D714}_{0})=\unicode[STIX]{x03C0}$
, which we now refer to as the tuned frequency, for which the sources are exactly
 $180^{\circ }$
out of phase, given by
 $$\begin{eqnarray}\unicode[STIX]{x1D714}_{0}=\unicode[STIX]{x03C0}U/h.\end{eqnarray}$$
Note also that based on the principle of destructive interference, additional peaks in the noise reduction spectra are also predicted, occurring at the odd harmonics of
 $\unicode[STIX]{x1D714}_{0}$
corresponding to
 $\unicode[STIX]{x1D714}_{0,n}=(2n-1)\unicode[STIX]{x03C0}U/h$
, provided that the sources are sufficiently coherent at these higher frequencies.
A typical double-wavelength serration profile formed from the summation of two single-wavelength profiles to form adjacent roots that are separated in the spanwise direction by
 $\unicode[STIX]{x1D706}$
and by
 $h$
in the streamwise direction.
Overall sound power reductions provided by these double-wavelength profiles therefore comprise the sum of two contributions. The first arises from the reduction in source strength along the leading edge, as shown by Kim et al. (Reference Kim, Haeri and Joseph2016) for single-wavelength profiles, which we shall denote as
 $\unicode[STIX]{x0394}\text{PWL}_{S}$
. The second arises from interference between adjacent root sources, which we shall denote as
 $\unicode[STIX]{x0394}\text{PWL}_{I}$
. The overall sound power reduction may therefore be written as
 $$\begin{eqnarray}\unicode[STIX]{x0394}\text{PWL}(\unicode[STIX]{x1D714})=\unicode[STIX]{x0394}\text{PWL}_{S}(\unicode[STIX]{x1D714})+\unicode[STIX]{x0394}\text{PWL}_{I}(\unicode[STIX]{x1D714}).\end{eqnarray}$$
Chaitanya et al. (Reference Chaitanya, Joseph, Narayanan, Vanderwel, Turner, Kim and Ganapathisubramani2017) have identified the maximum possible sound power reduction that can be obtained from single-wavelength serrations arising solely from a reduction in the source strength, given by
 $$\begin{eqnarray}\unicode[STIX]{x0394}\text{PWL}_{S}(fa/U)=10\log _{10}(fa/U)+10,\end{eqnarray}$$
and is solely a function of the non-dimensional frequency
 $fa/U$
, where
 $a$
is half the peak-to-root amplitude identified in figure 1. The additional noise reduction due to double-wavelength serrations arising from interference between adjacent roots is therefore quantified by the interference term
 $\unicode[STIX]{x0394}\text{PWL}_{I}(\unicode[STIX]{x1D714})$
, which we shall investigate in detail in § 6. We now present the experimental data confirming the proposed noise reduction mechanism of double-wavelength serrations.
3 Experimental set-up and procedure
3.1 Flat-plate leading-edge serrations
For economy and ease of manufacture, a parametric study into the effect of
 $h$
and
 $\unicode[STIX]{x1D706}$
on noise reductions was performed on flat plates situated within a turbulent flow. A double-wavelength design arising from this study was then applied to a three-dimensional (3-D) aerofoil of 10 % thickness, which we show in § 8 has an almost identical noise reduction spectrum to the flat-plate case.
The flat plates with a mean chord (
 $c_{0}$
) of 150 mm and span of 450 mm were constructed by joining together two 1 mm thick metallic sheets to allow serrated flat-plate inserts 2 mm thick to be inserted between them. The step arising from these inserts into the two flat plates was ground in order to ensure smooth transition between the inserts and the flat plates. All corners were rounded and the trailing edge sharpened to eliminate vortex shedding noise. Further details of this flat-plate construction can be found in Narayanan et al. (Reference Narayanan, Chaitanya, Haeri, Joseph, Kim and Polacsek2015).
A total of 11 different flat-plate serrations of varying amplitude, phase and wavelength were investigated to explore the sensitivity of noise reductions to these parameter variations. Note that in this paper, values of
 $\unicode[STIX]{x1D706}$
and
 $h$
are presented as quantities normalized on the mean chord
 $c_{0}$
, although there is no evidence to suggest that this is a meaningful normalization parameter in determining noise reductions.
3.2 Open-jet test facility and instrumentation
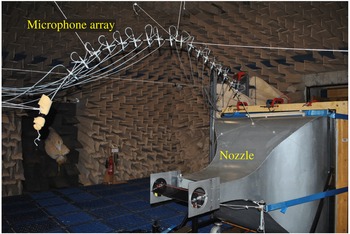
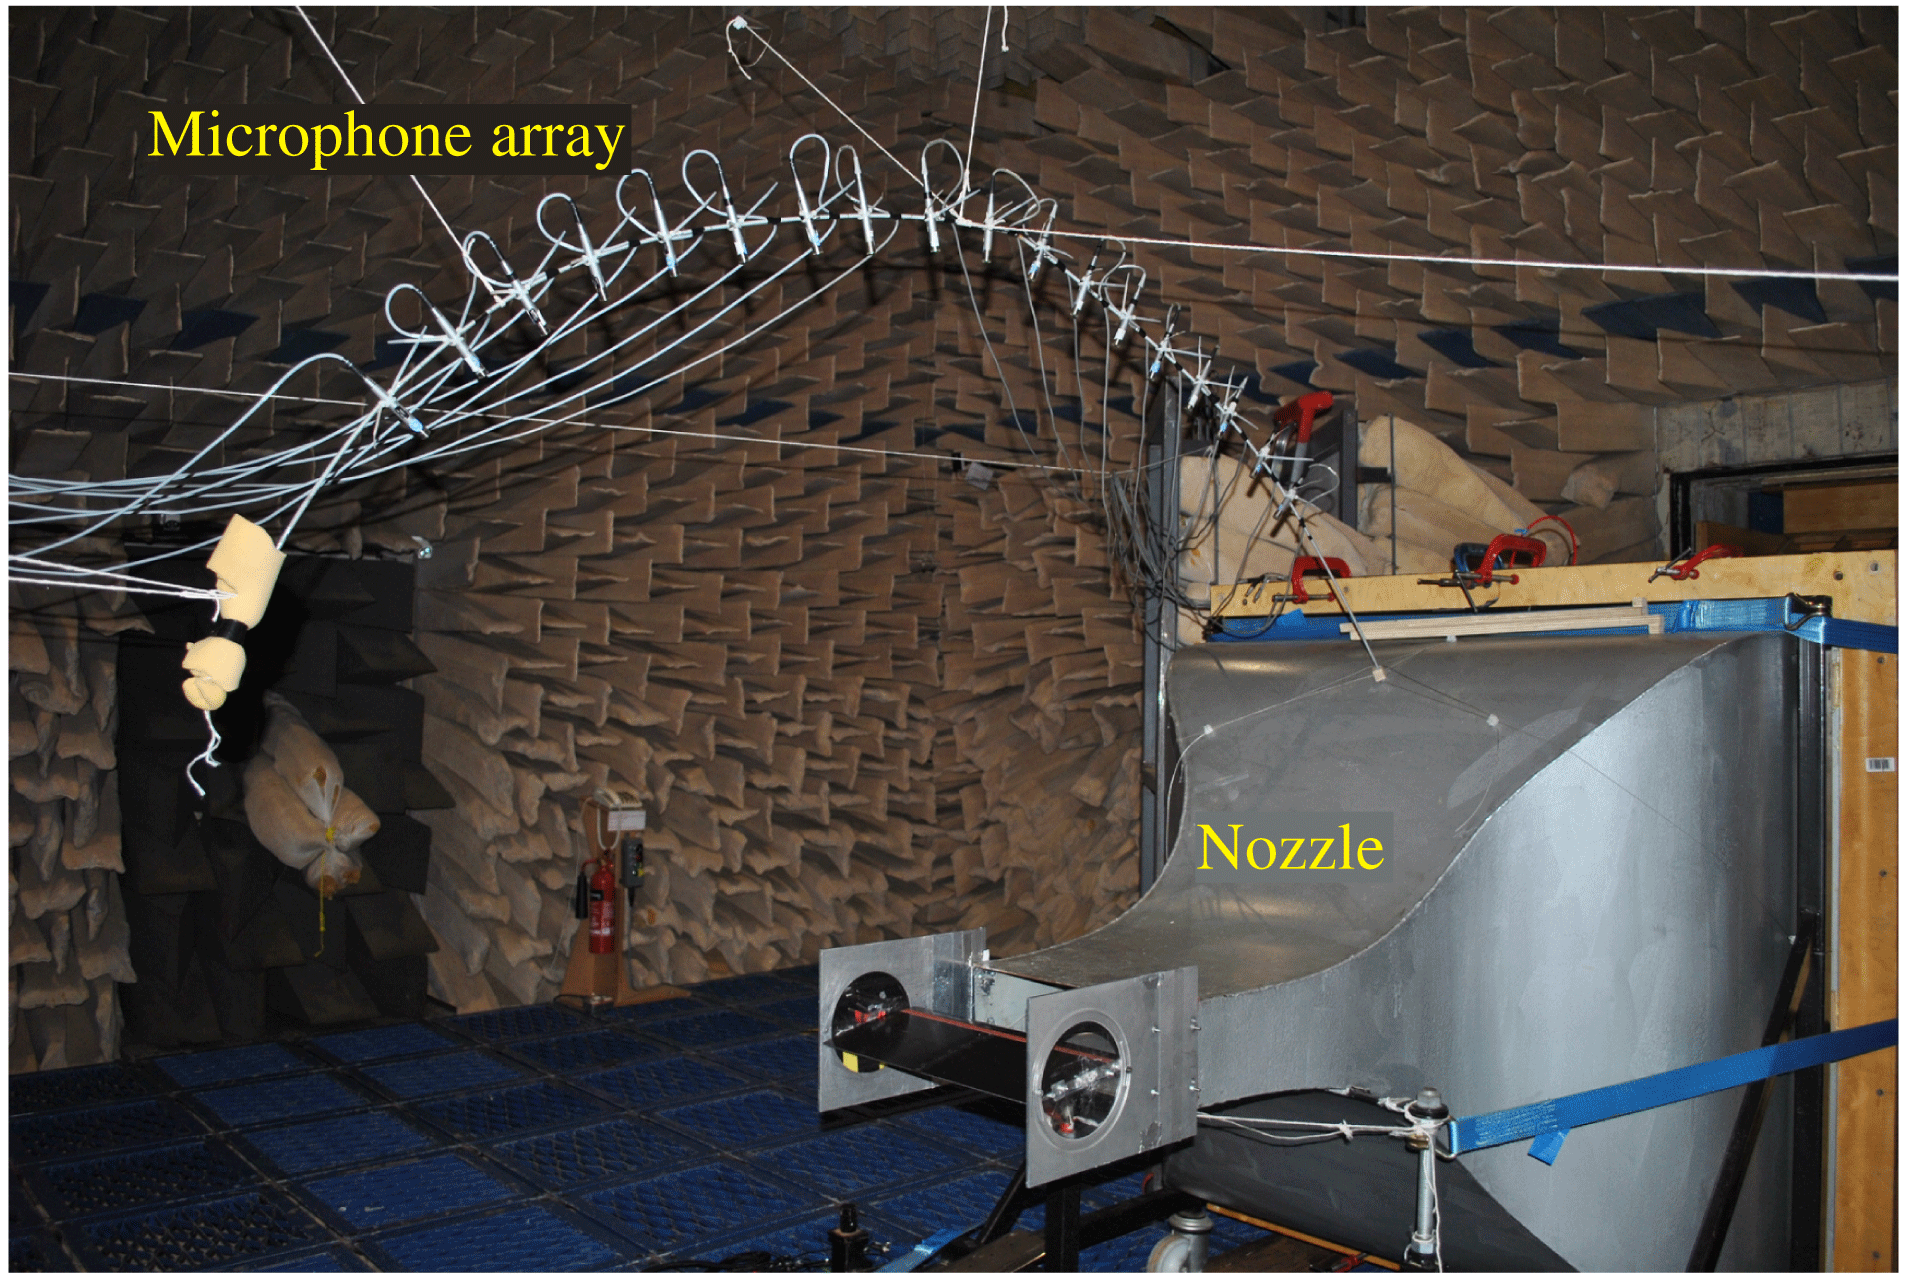
Far-field noise measurements were carried out at the Institute of Sound and Vibration Research’s open-jet wind tunnel facility. The wind tunnel is located within the anechoic chamber, of dimensions
 $8~\text{m}\times 8~\text{m}\times 8~\text{m}$
as shown in figure 2. The walls are acoustically treated with glass wool wedges whose cutoff frequency is 80 Hz. The nozzle has dimensions of 150 and 450 mm and provides a maximum flow speed of
 $100~\text{m}~\text{s}^{-1}$
. A detailed description of the wind tunnel, including its characteristics, is presented by Chong, Joseph & Davies (Reference Chong, Joseph and Davies2008). To maintain two-dimensional flow around the flat plate, side plates are mounted to the nozzle exit which also support the flat plate and aerofoil in the flow. The mean leading edge of the flat plate is located 150 mm (one chord) downstream from the nozzle exit.
Photograph of jet nozzle and test set-up inside the ISVR anechoic chamber.
In order to prevent tonal noise generation caused by laminar boundary layer instabilities (Sanjose et al.
Reference Sanjose, Jaiswal, Arroyo, Moreau, Towne, Lele and Mann2017), and to ensure complete consistency between the different cases, the flow near the leading edge of the aerofoil was tripped to force transition to turbulence using a rough band of tape of width 1.25 cm located 16.6 % of chord from the leading edge, on both suction and pressure sides. The tape has roughness of SS 100, corresponding to a root-mean-square (r.m.s.) surface roughness of
 $140~\unicode[STIX]{x03BC}\text{m}$
. Previous noise measurements in our facility have indicated that self-noise is insensitive to the method of tripping.
3.3 Far-field noise measurements
Far-field noise measurements were made using 11 half-inch condenser microphones (B&K type 4189) located at a constant radial distance of 1.2 m from the mid-span of the flat-plate leading edge. These microphones are placed at emission angles of between
 $40^{\circ }$
and
 $140^{\circ }$
measured relative to the downstream jet axis. Measurements were carried for 10 s duration at a sampling frequency of 50 kHz, and the noise spectra were calculated with a window size of 1024 data points corresponding to a frequency resolution of 48.83 Hz and a bandwidth–time (BT) product of approximately 500, which is sufficient to ensure negligible variance in the spectra estimated at this frequency resolution.
The acoustic pressure at the microphones were recorded at the mean flow velocities (
 $U$
) of 20, 40, 60 and
 $80~\text{m}~\text{s}^{-1}$
. Noise reductions are presented in terms of the sound power level spectra
 $\text{PWL}(f)$
calculated by integrating the pressure spectra over the polar array of 11 microphones using the procedure described in Narayanan et al. (Reference Narayanan, Chaitanya, Haeri, Joseph, Kim and Polacsek2015). Sound power reductions are determined by comparing the sound power spectra due to the serrated flat plate with the baseline straight-edge profile.
3.4 Turbulence characterization
In this section we describe the method for producing controlled turbulence at the flat-plate leading edge. Classical flat-plate theory (Amiet Reference Amiet1975; Roger & Moreau Reference Roger and Moreau2010) suggests that the far-field noise radiation due to a flat plate interacting with a turbulent flow can be completely determined from the spectrum of the velocity normal to the flat plate and the frequency-dependent coherence length.
In an attempt to produce turbulence that is approximately homogeneous and isotropic at the aerofoil leading edge, a bi-planar rectangular grid (Roach Reference Roach1987) of wooden bars of 12 mm width separated by 34 mm was used to generate turbulent flow. The overall grid dimensions were
 $630\times 690~\text{mm}^{2}$
and it was located in the contraction section 75 cm upstream of the nozzle exit. The expansion ratio of the nozzle is
 $25:1$
.
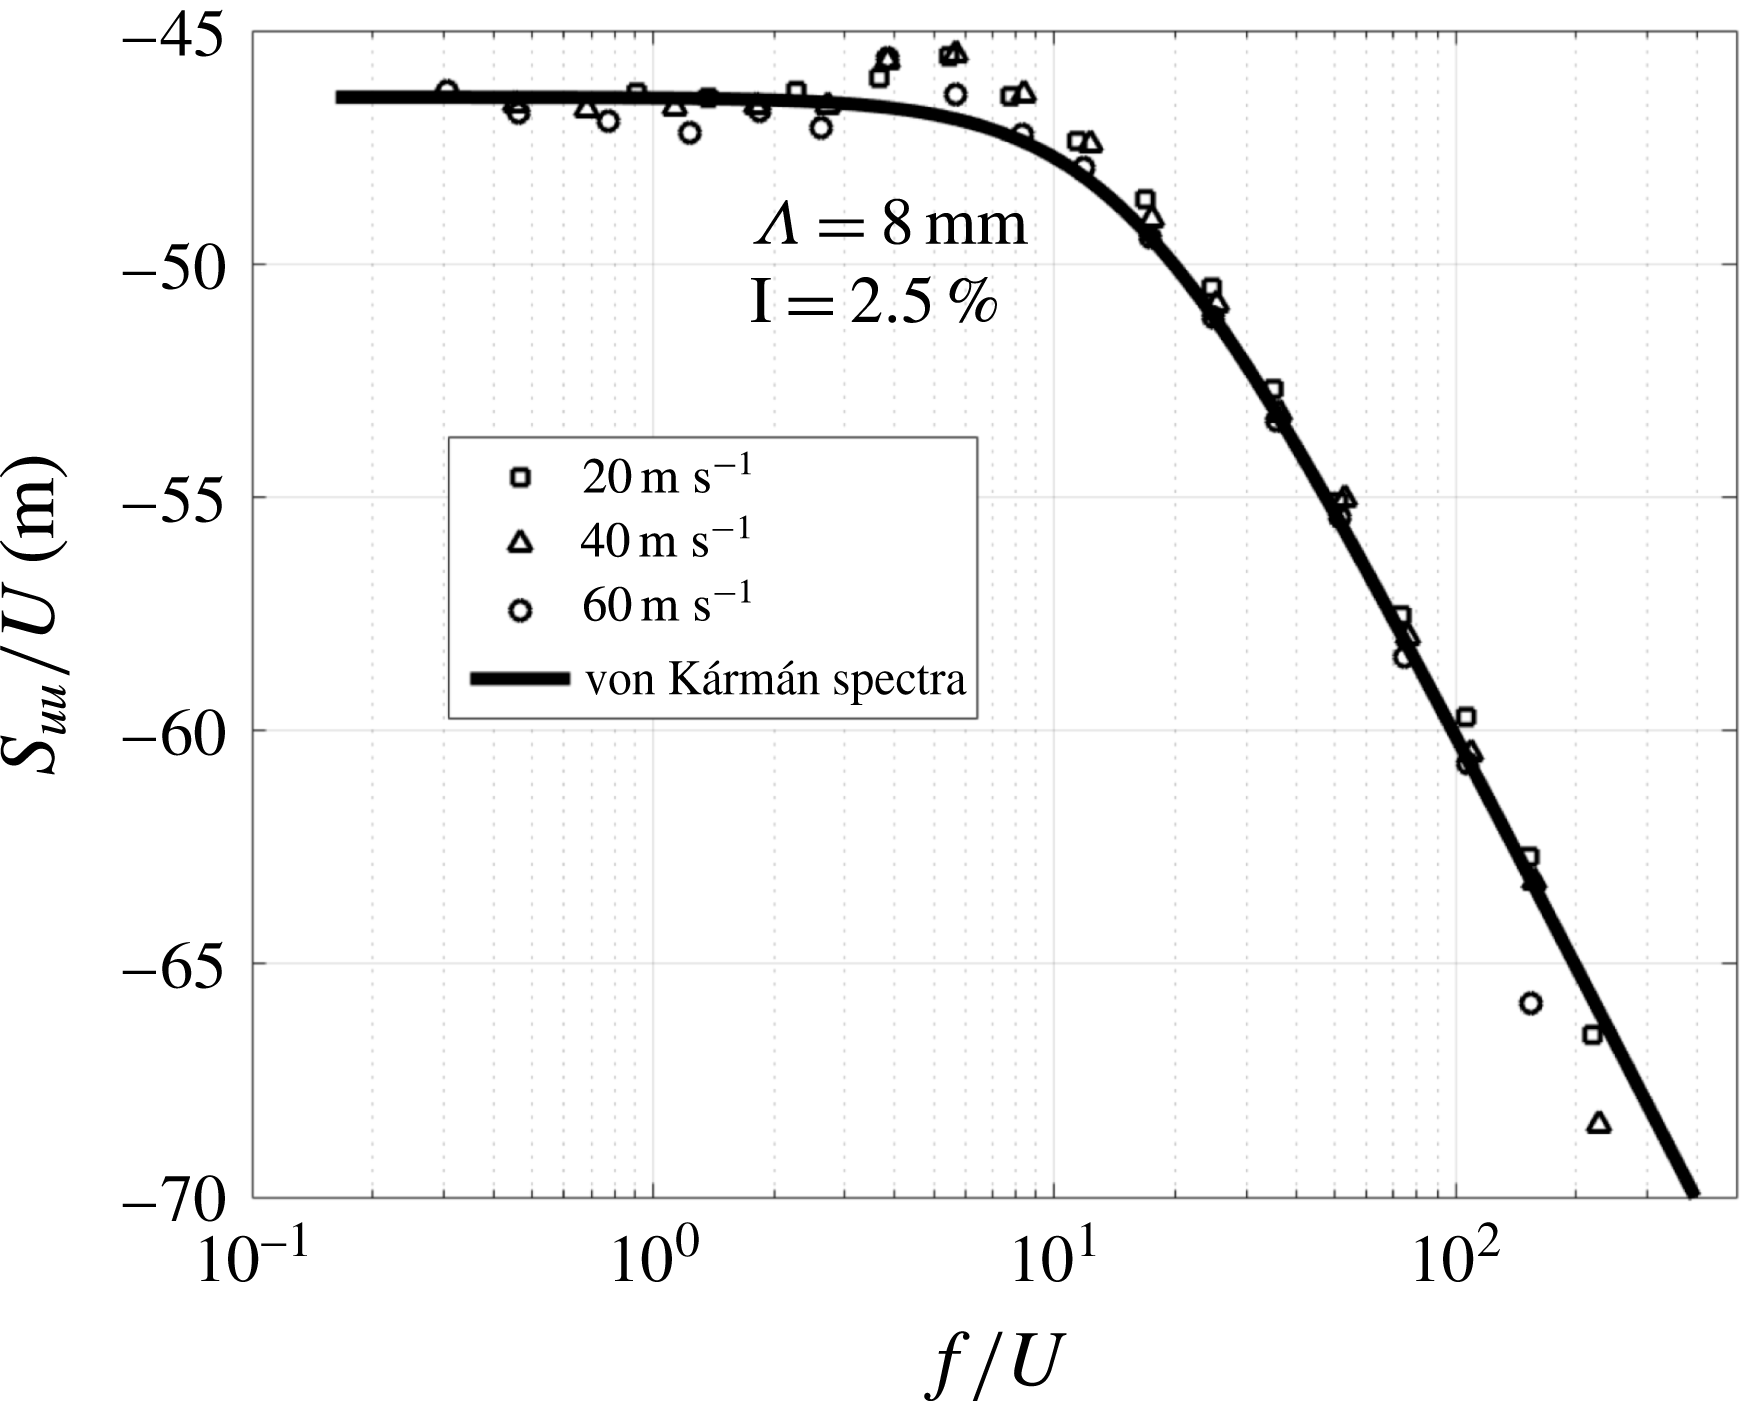
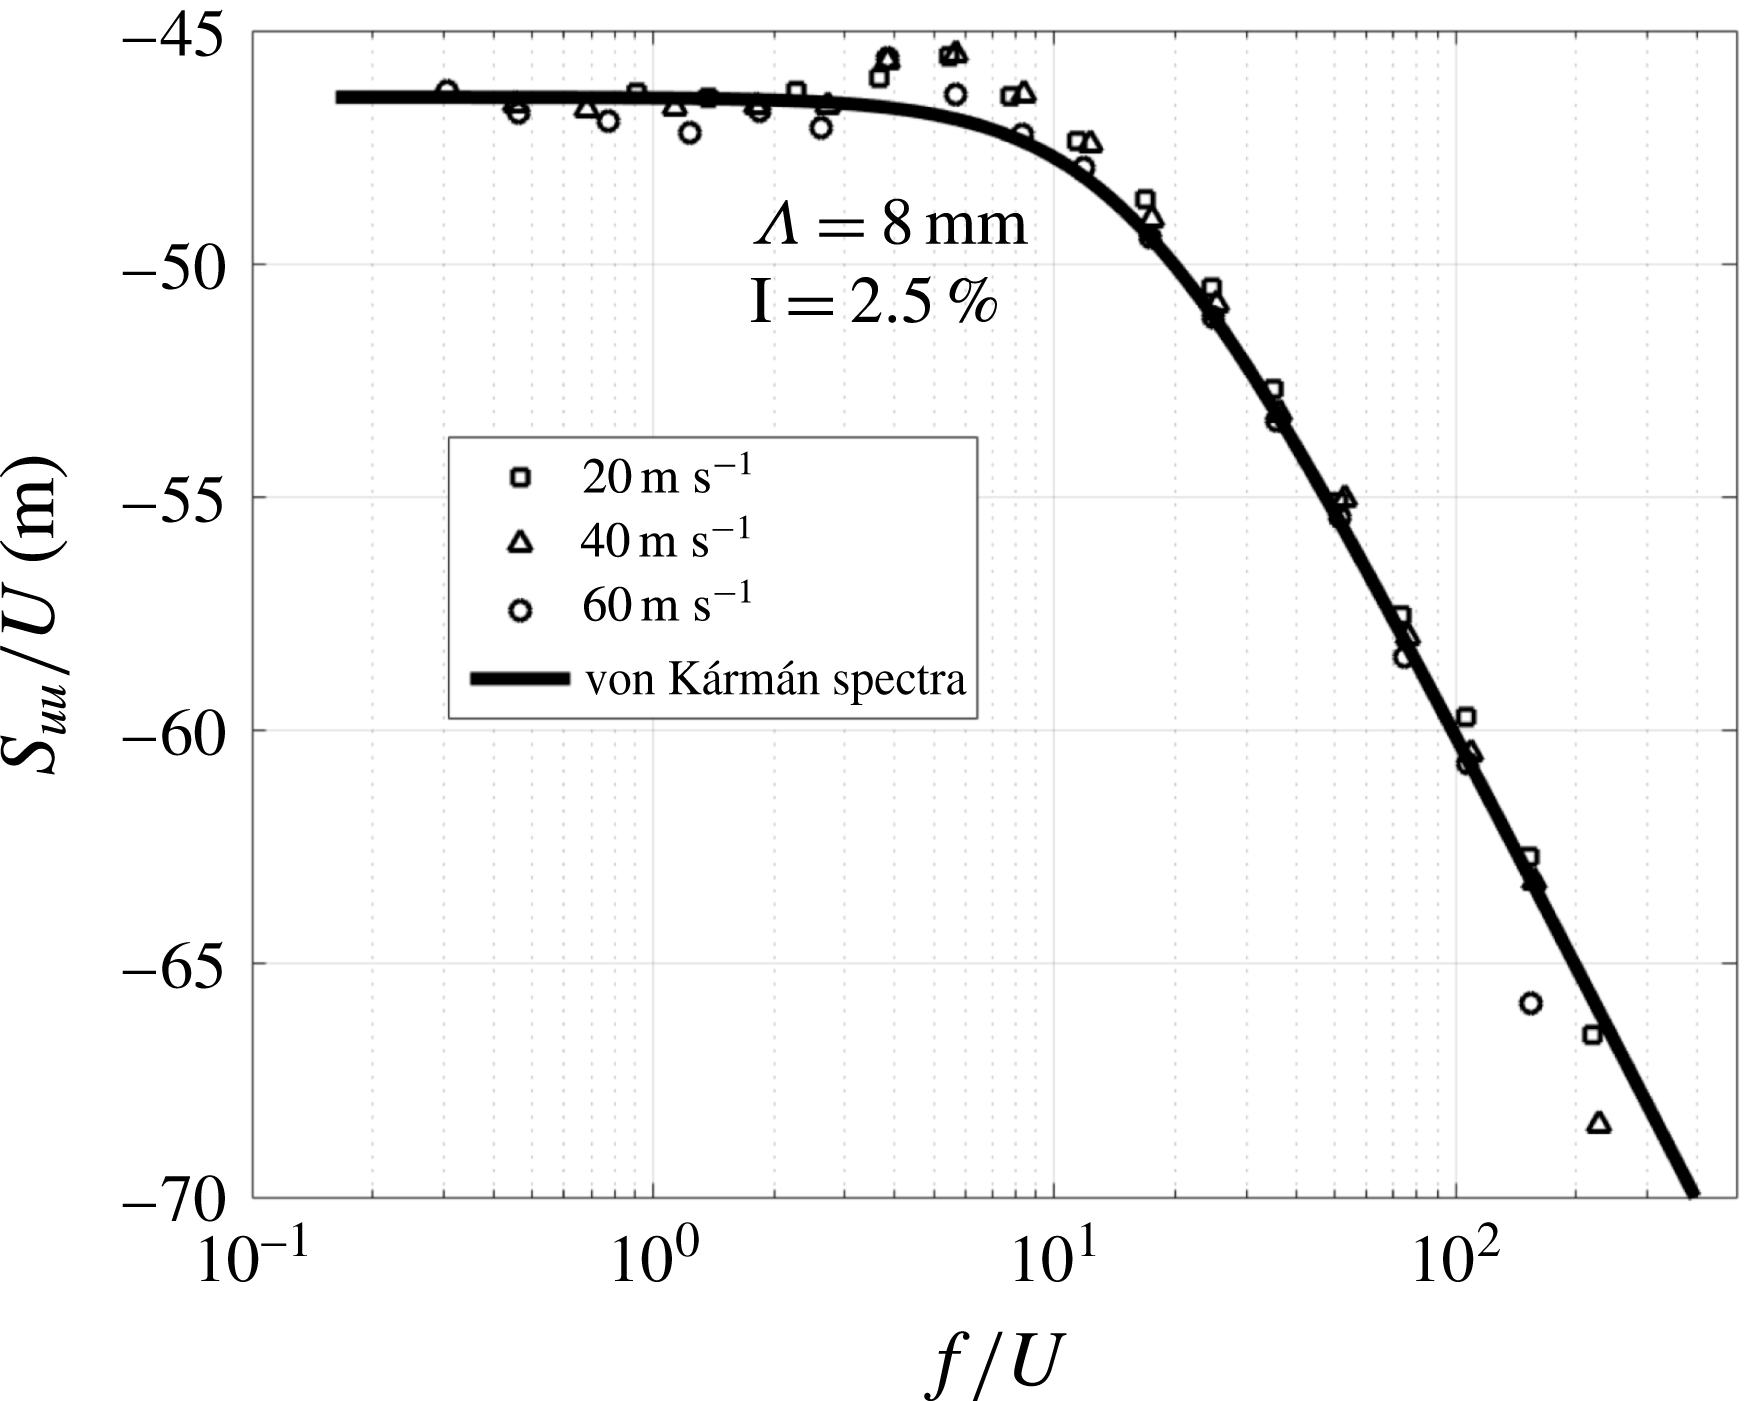
A comparison of the streamwise velocity spectra (
 $S_{uu}/U$
) measured at 145 mm from the nozzle exit plotted against
 $f/U$
is compared in figure 3 to the theoretical von Kármán velocity spectrum (given by (A 4)), assuming a turbulence intensity of 2.5 % and an integral length scale of 8 mm obtained from the measurements of the spatial correlation function described below.
Comparison between the measured axial velocity spectra and theoretical von Kármán spectra.
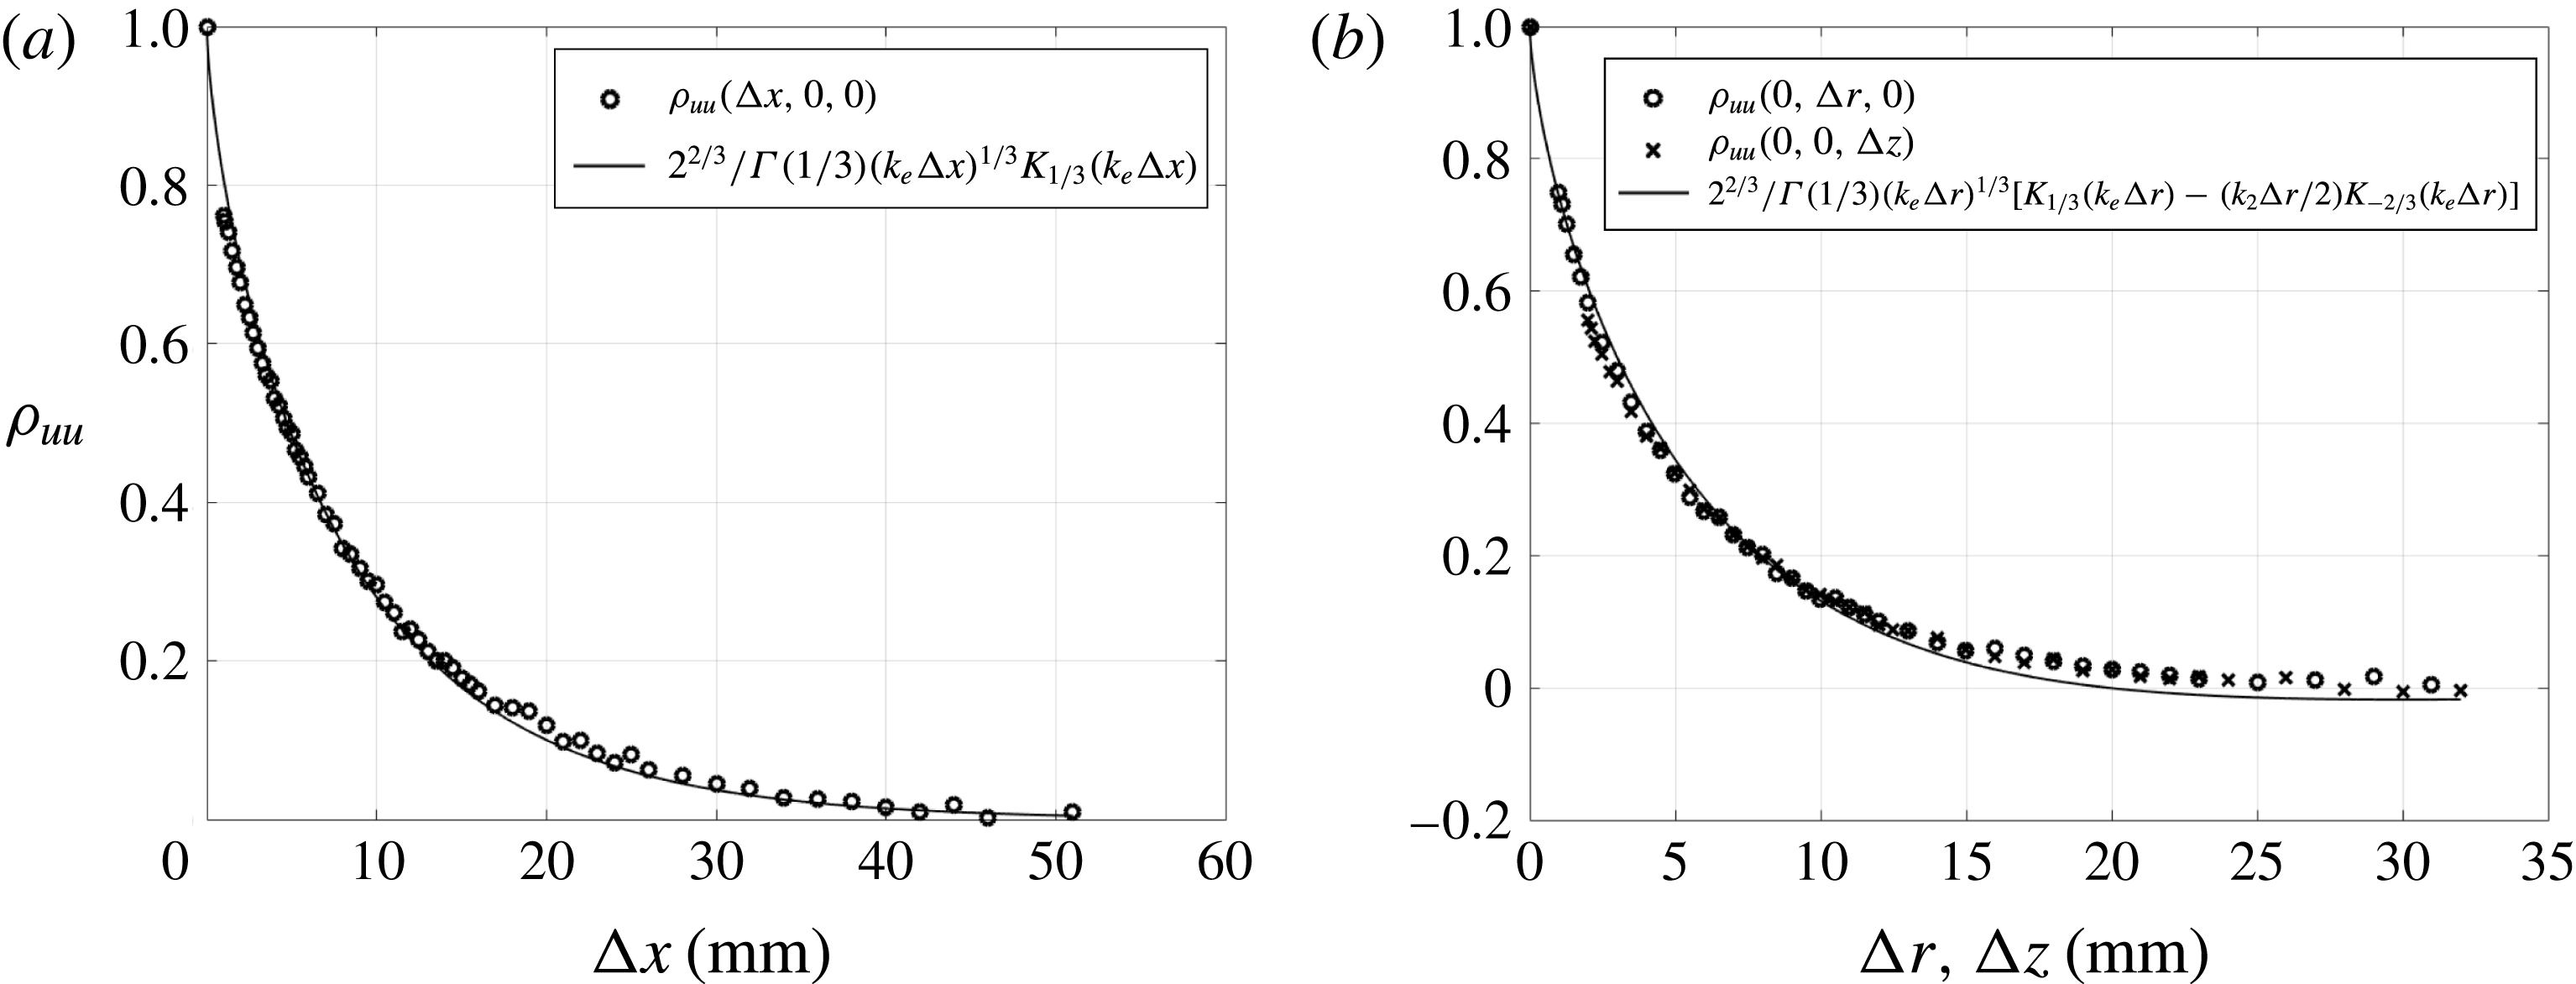
In order to further characterize the turbulent flow on the serrated flat plate the longitudinal (streamwise)
 $\unicode[STIX]{x1D70C}_{uu}(\unicode[STIX]{x0394}x,0,0)$
and transverse (spanwise and blade-normal) streamwise velocity correlation functions
 $\unicode[STIX]{x1D70C}_{uu}(0,\unicode[STIX]{x0394}r,0),\unicode[STIX]{x1D70C}_{uu}(0,0,\unicode[STIX]{x0394}z)$
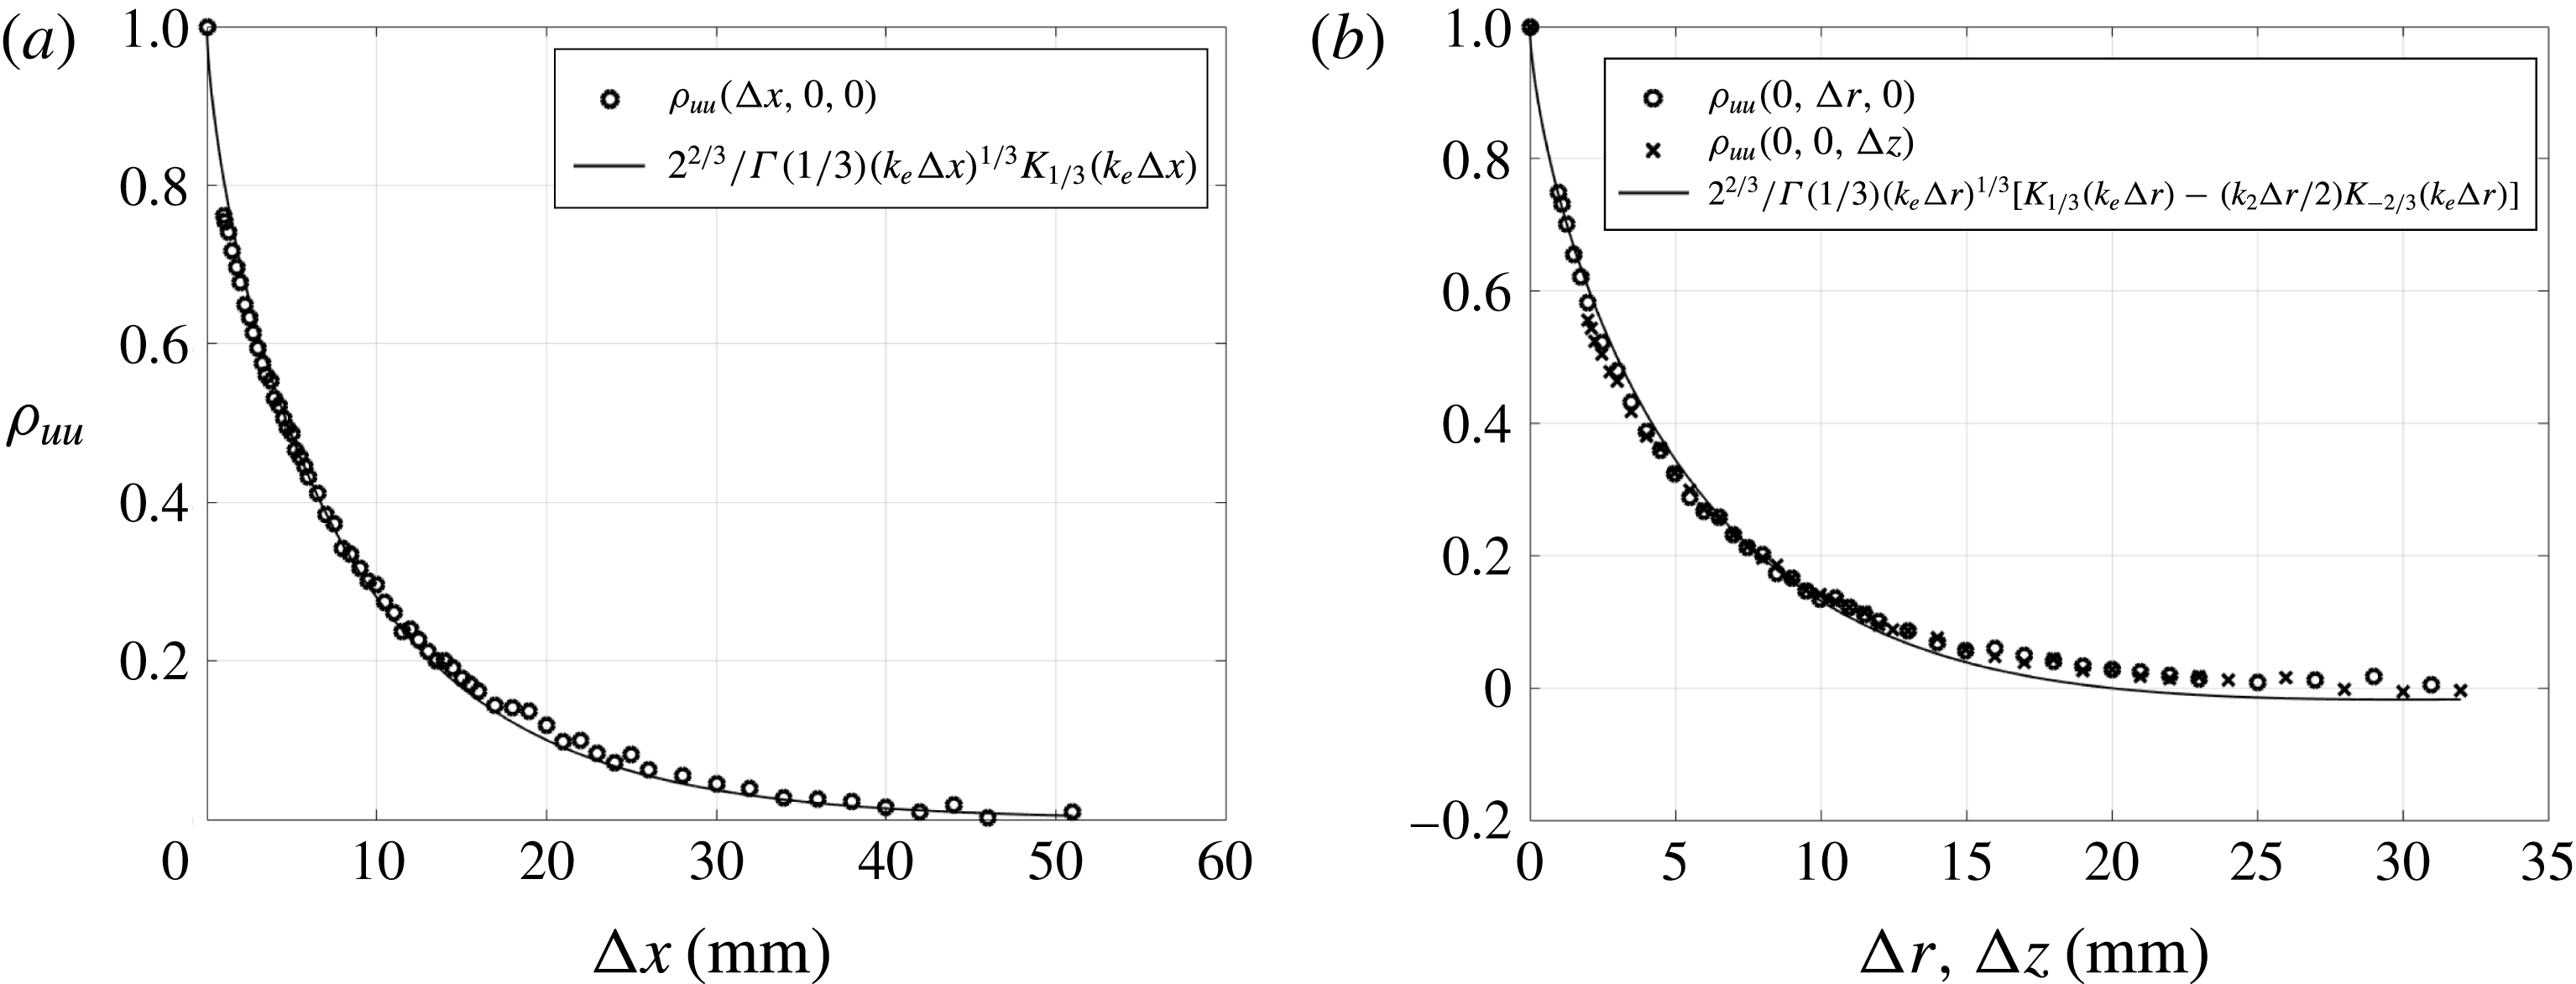
were measured using two single-wire hot-wires sampled at 40 kHz. The normalized results are compared against the theoretical von Kármán interpolation functions (given by (A 1) and (A 2)) in figure 4(a,b) to establish the degree of isotropy of the turbulent flow. The correlation functions were measured relative to the origin (0,0,0) located at the centre of the nozzle 145 mm downstream (corresponding to mid-span of the flat plate). These measurements are also used to determine the integral length scales which will be subsequently used in a simple analytic model to predict the noise reductions from the serrated aerofoils. These correlation measurements were repeated for four different spanwise reference positions no closer than 2 cm from the side plates. No discernible difference could be observed, thereby providing some confidence in the homogeneity of the flow field away from the side plates.
Figure 4(a,b) for the measured spatial correlation function together with figure 3 for the measured velocity spectrum demonstrate good agreement with the theoretical predictions for isotropic turbulence, suggesting that the inflow turbulence produced by the grid is a close approximation to isotropy (Hinze Reference Hinze1975). The integral length scales calculated from these correlation functions (
 $\unicode[STIX]{x1D6EC}_{uu,x}=\int _{0}^{\infty }\unicode[STIX]{x1D70C}_{uu}(\unicode[STIX]{x0394}x,0,0)\,\text{d}(\unicode[STIX]{x0394}x)$
) are calculated to be
 $\unicode[STIX]{x1D6EC}_{uu,x}=8.0$
,
 $\unicode[STIX]{x1D6EC}_{uu,r}=4.7$
and
 $\unicode[STIX]{x1D6EC}_{uu,z}=4.6~\text{mm}$
respectively. These are in the ratios of
 $1.74:1.02:1.00$
, which may be compared to the ratios of
 $2:1:1$
for ideal isotropic turbulence.
The noise generated by a flat plate in a turbulent inflow is generated by the unsteady velocity component normal to the flat plate. Our main interest in this paper is therefore the transverse component of turbulence velocity. The integral length scale (
 $\unicode[STIX]{x1D6EC}$
) associated with the transverse velocity component was inferred from
 $\unicode[STIX]{x1D70C}_{uu}(0,0,\unicode[STIX]{x0394}z)$
to be 4.6 mm based on the assumption of isotropy.
Comparison of correlation coefficient function measured at
 $40~\text{m}~\text{s}^{-1}$
compared with von Kármán interpolation formula using the integral length scale
 $\unicode[STIX]{x1D6EC}_{uu,x}=8~\text{mm}$
.
3.5 Flat-plate straight leading-edge validation
By way of validation of the accuracy of the measured turbulence quantities for predicting the radiated noise spectrum, the theoretical isotropic velocity spectrum
 $S_{ww}$
of (A 5) was used in the analytic model due to Amiet (Reference Amiet1975), Moreau & Roger (Reference Moreau and Roger2007) and Roger & Moreau (Reference Roger and Moreau2010). Equation (A 5) was computed based on
 $\unicode[STIX]{x1D6EC}_{uu}$
and
 $\bar{u^{2}}$
computed from the hot-wire results in § 3.4. The results were compared against the measured acoustic pressure spectrum. Both the trailing and leading edges were sharpened in order to avoid vortex shedding as well as to provide a better approximation to a zero-thickness flat plate. The power spectral density (PSD) of the sound pressure versus frequency measured at
 $90^{\circ }$
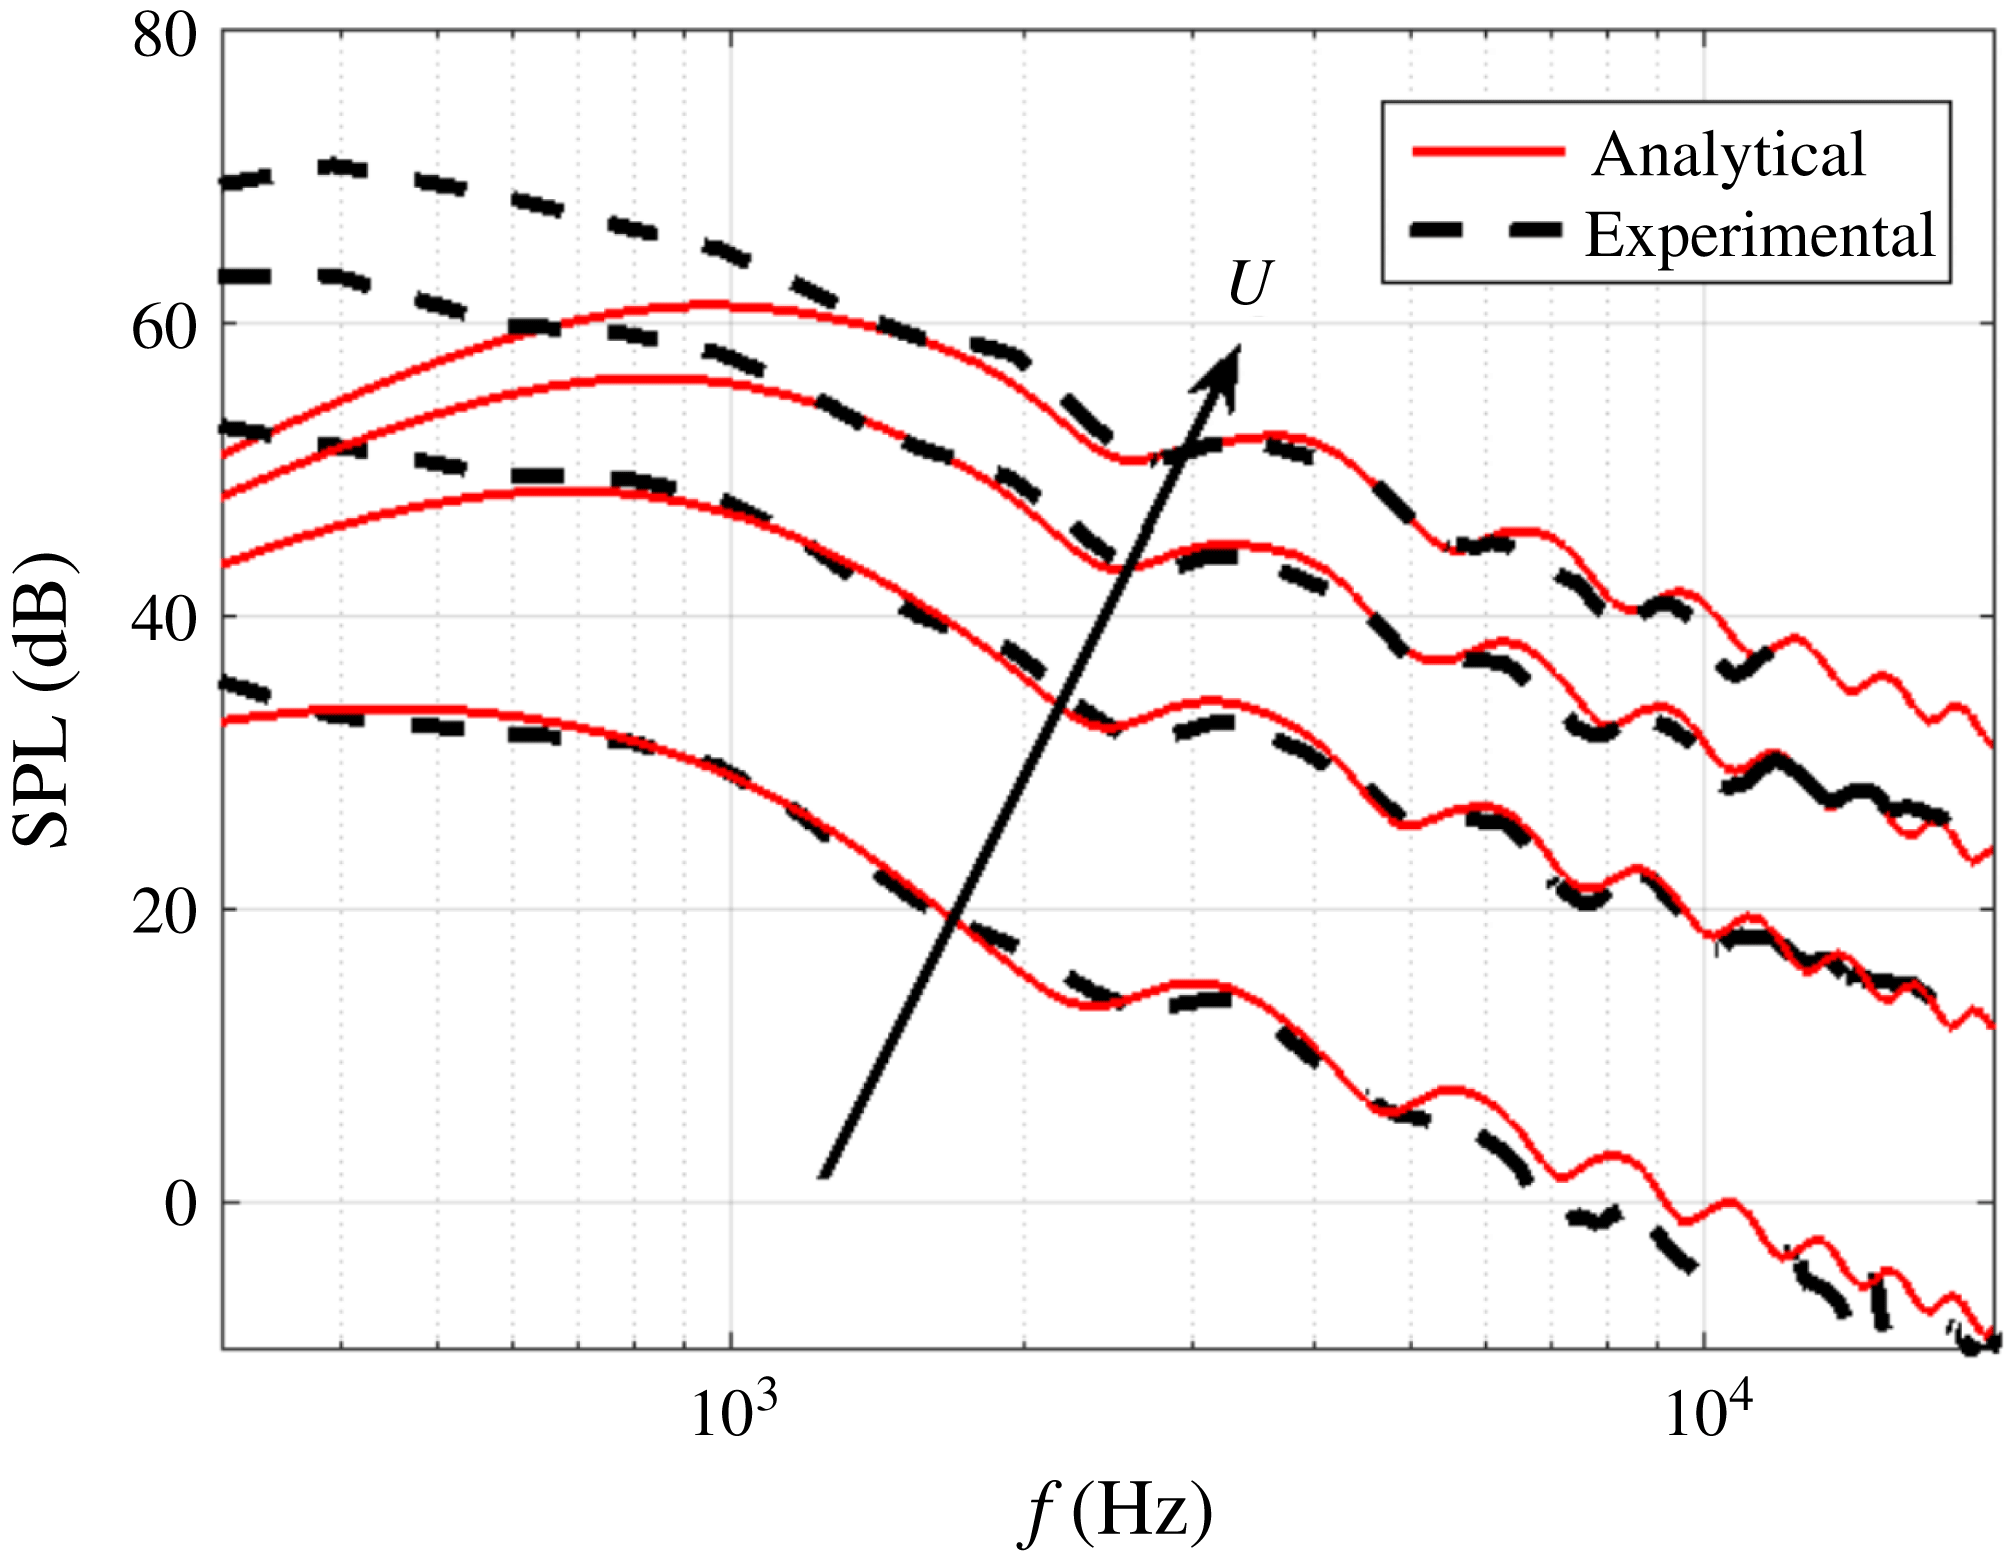
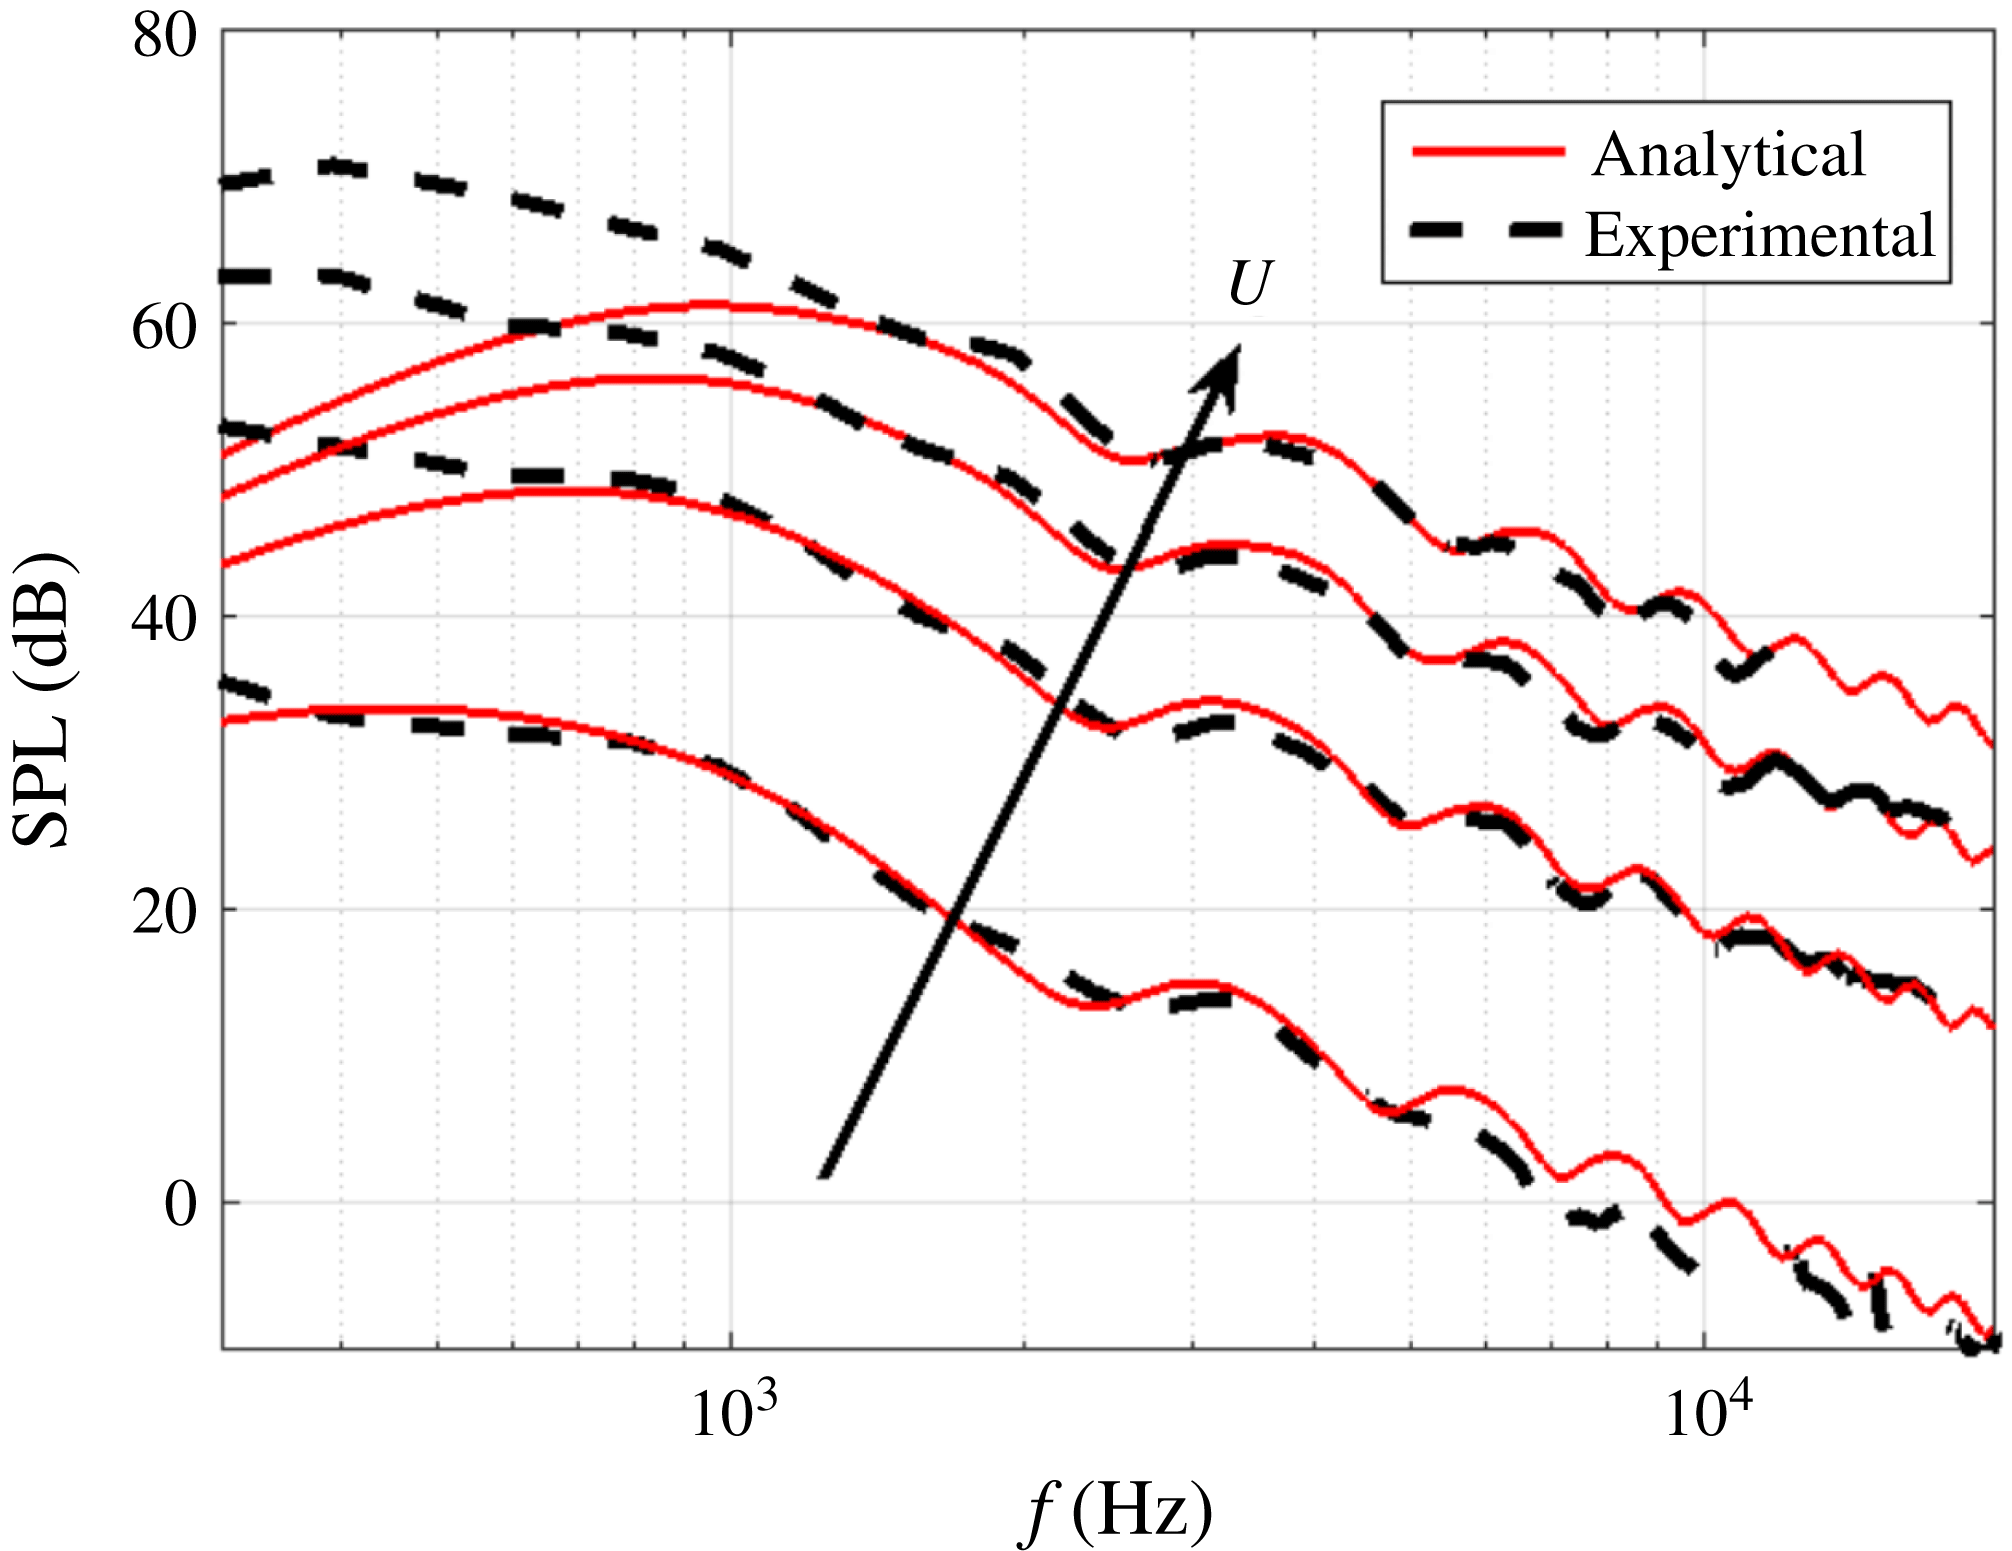
to the jet axis is compared in figure 5 against Amiet’s flat-plate analytic theory for a chord length of 150 mm and span of 450 mm at jet velocities of 20, 40, 60 and
 $80~\text{m}~\text{s}^{-1}$
. Excellent agreement with the flat-plate theory is observed for all velocity values at frequencies where interaction noise is dominant. Below this frequency the predictions are underestimated due to contamination of the measured spectra due to jet noise. The turbulence description provided from figures 3 and 4 therefore provides an accurate description of the turbulent flow for allowing accurate prediction of the noise radiation.
Comparison of sound pressure levels at the
 $90^{\circ }$
microphone location between Amiet’s analytic prediction (solid red) and experimental (dotted black) values for a fixed chord
 $(c_{0}=150~\text{mm})$
length and varying jet velocities (
 $U=20$
, 40, 60 and
 $80~\text{m}~\text{s}^{-1}$
).
4 Comparison of noise reductions due to double-wavelength and single-wavelength serrations
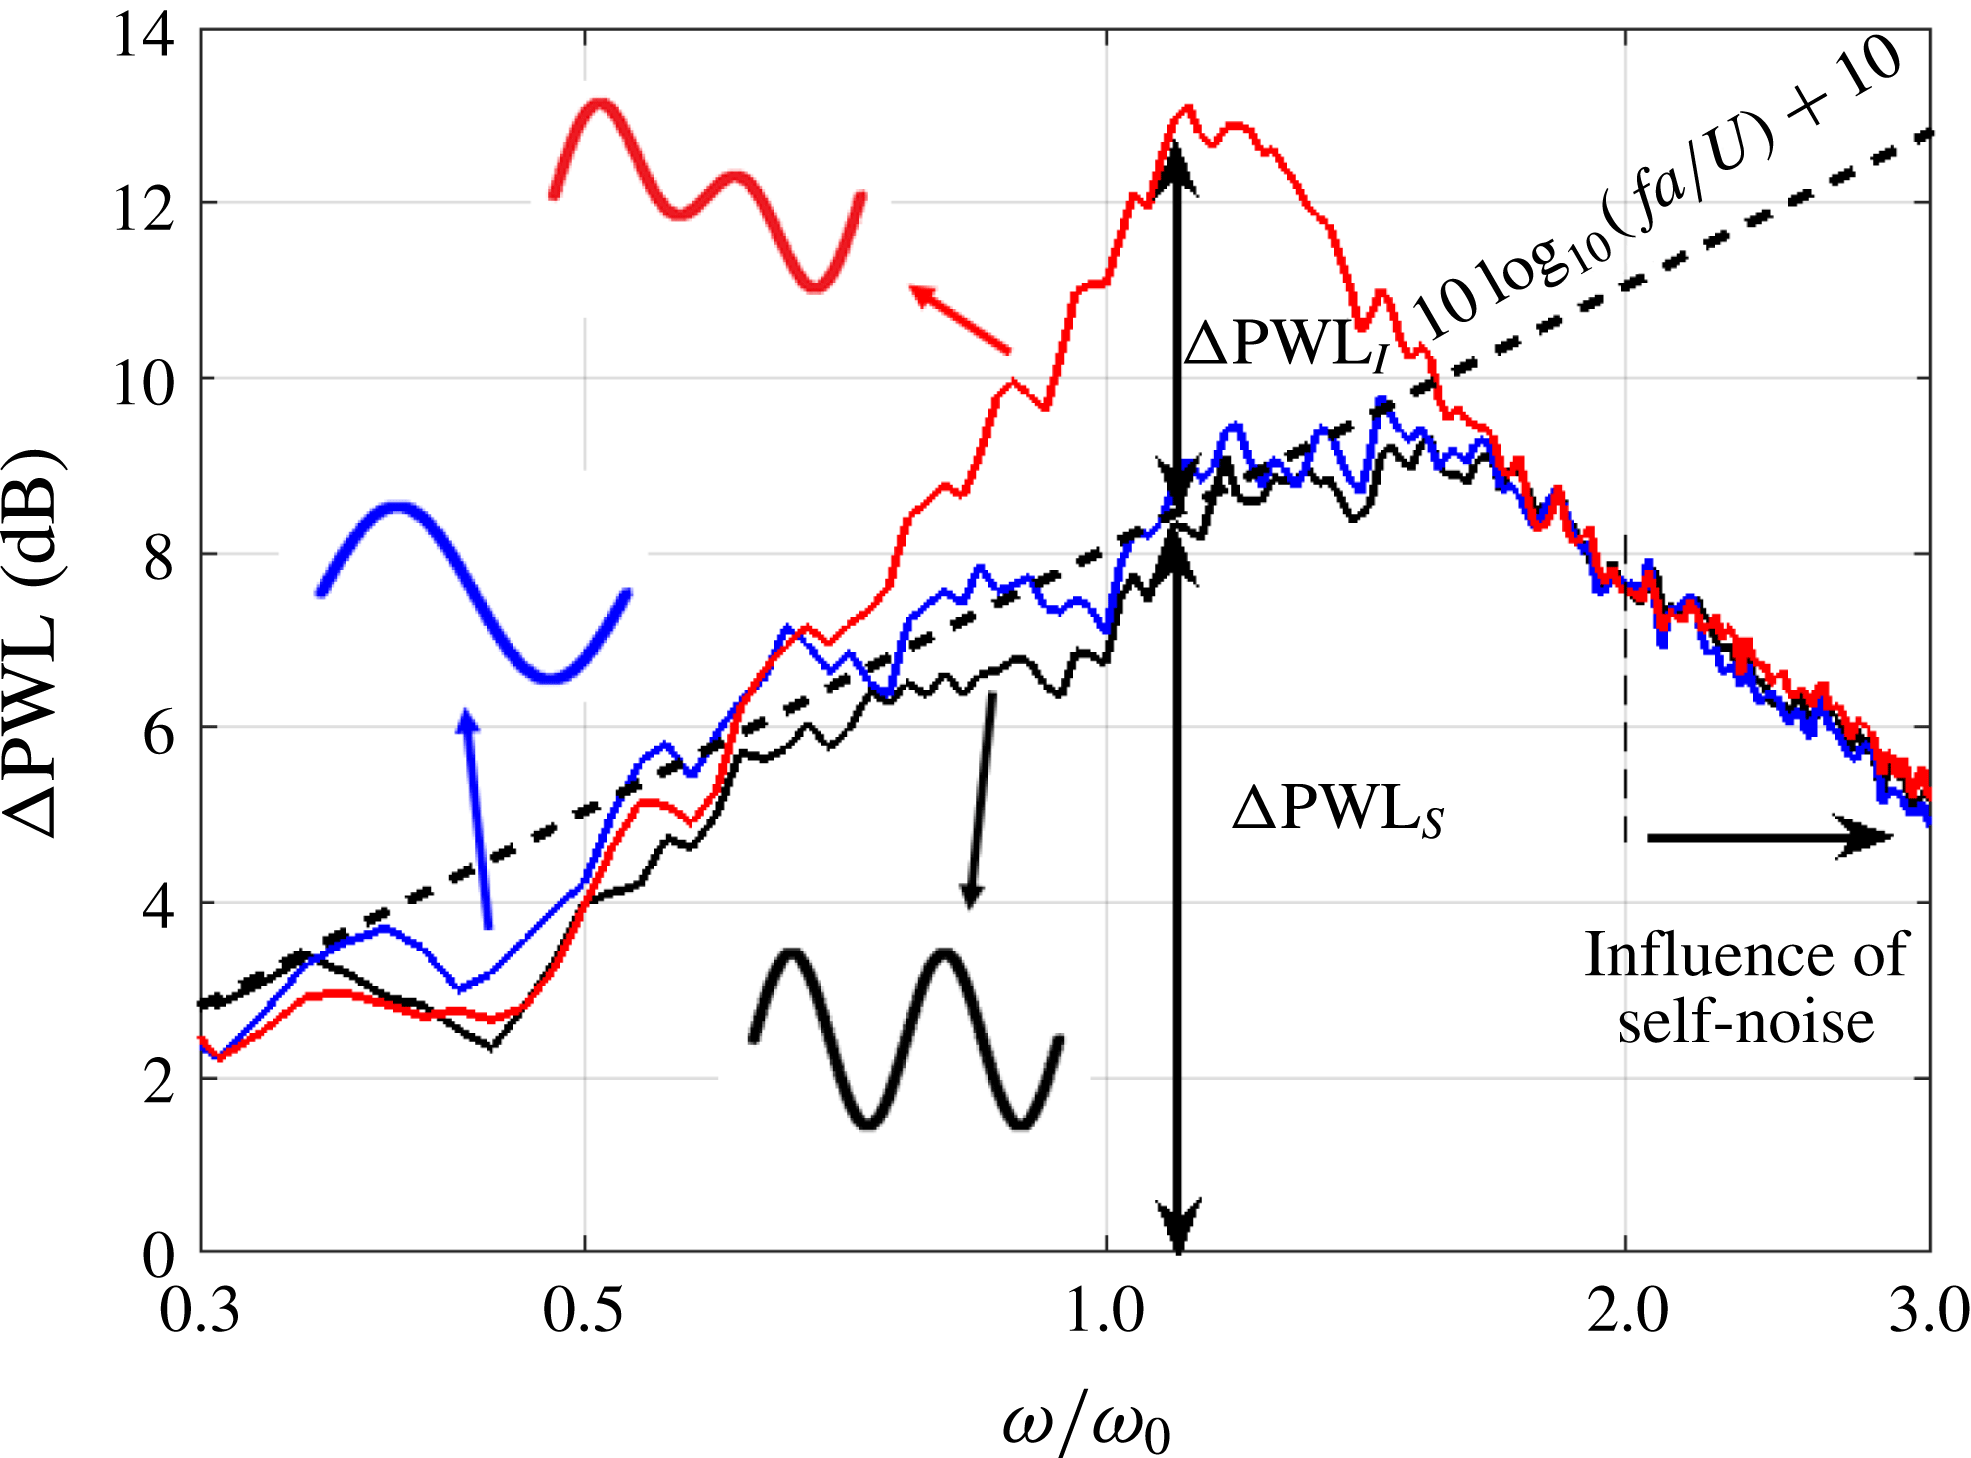
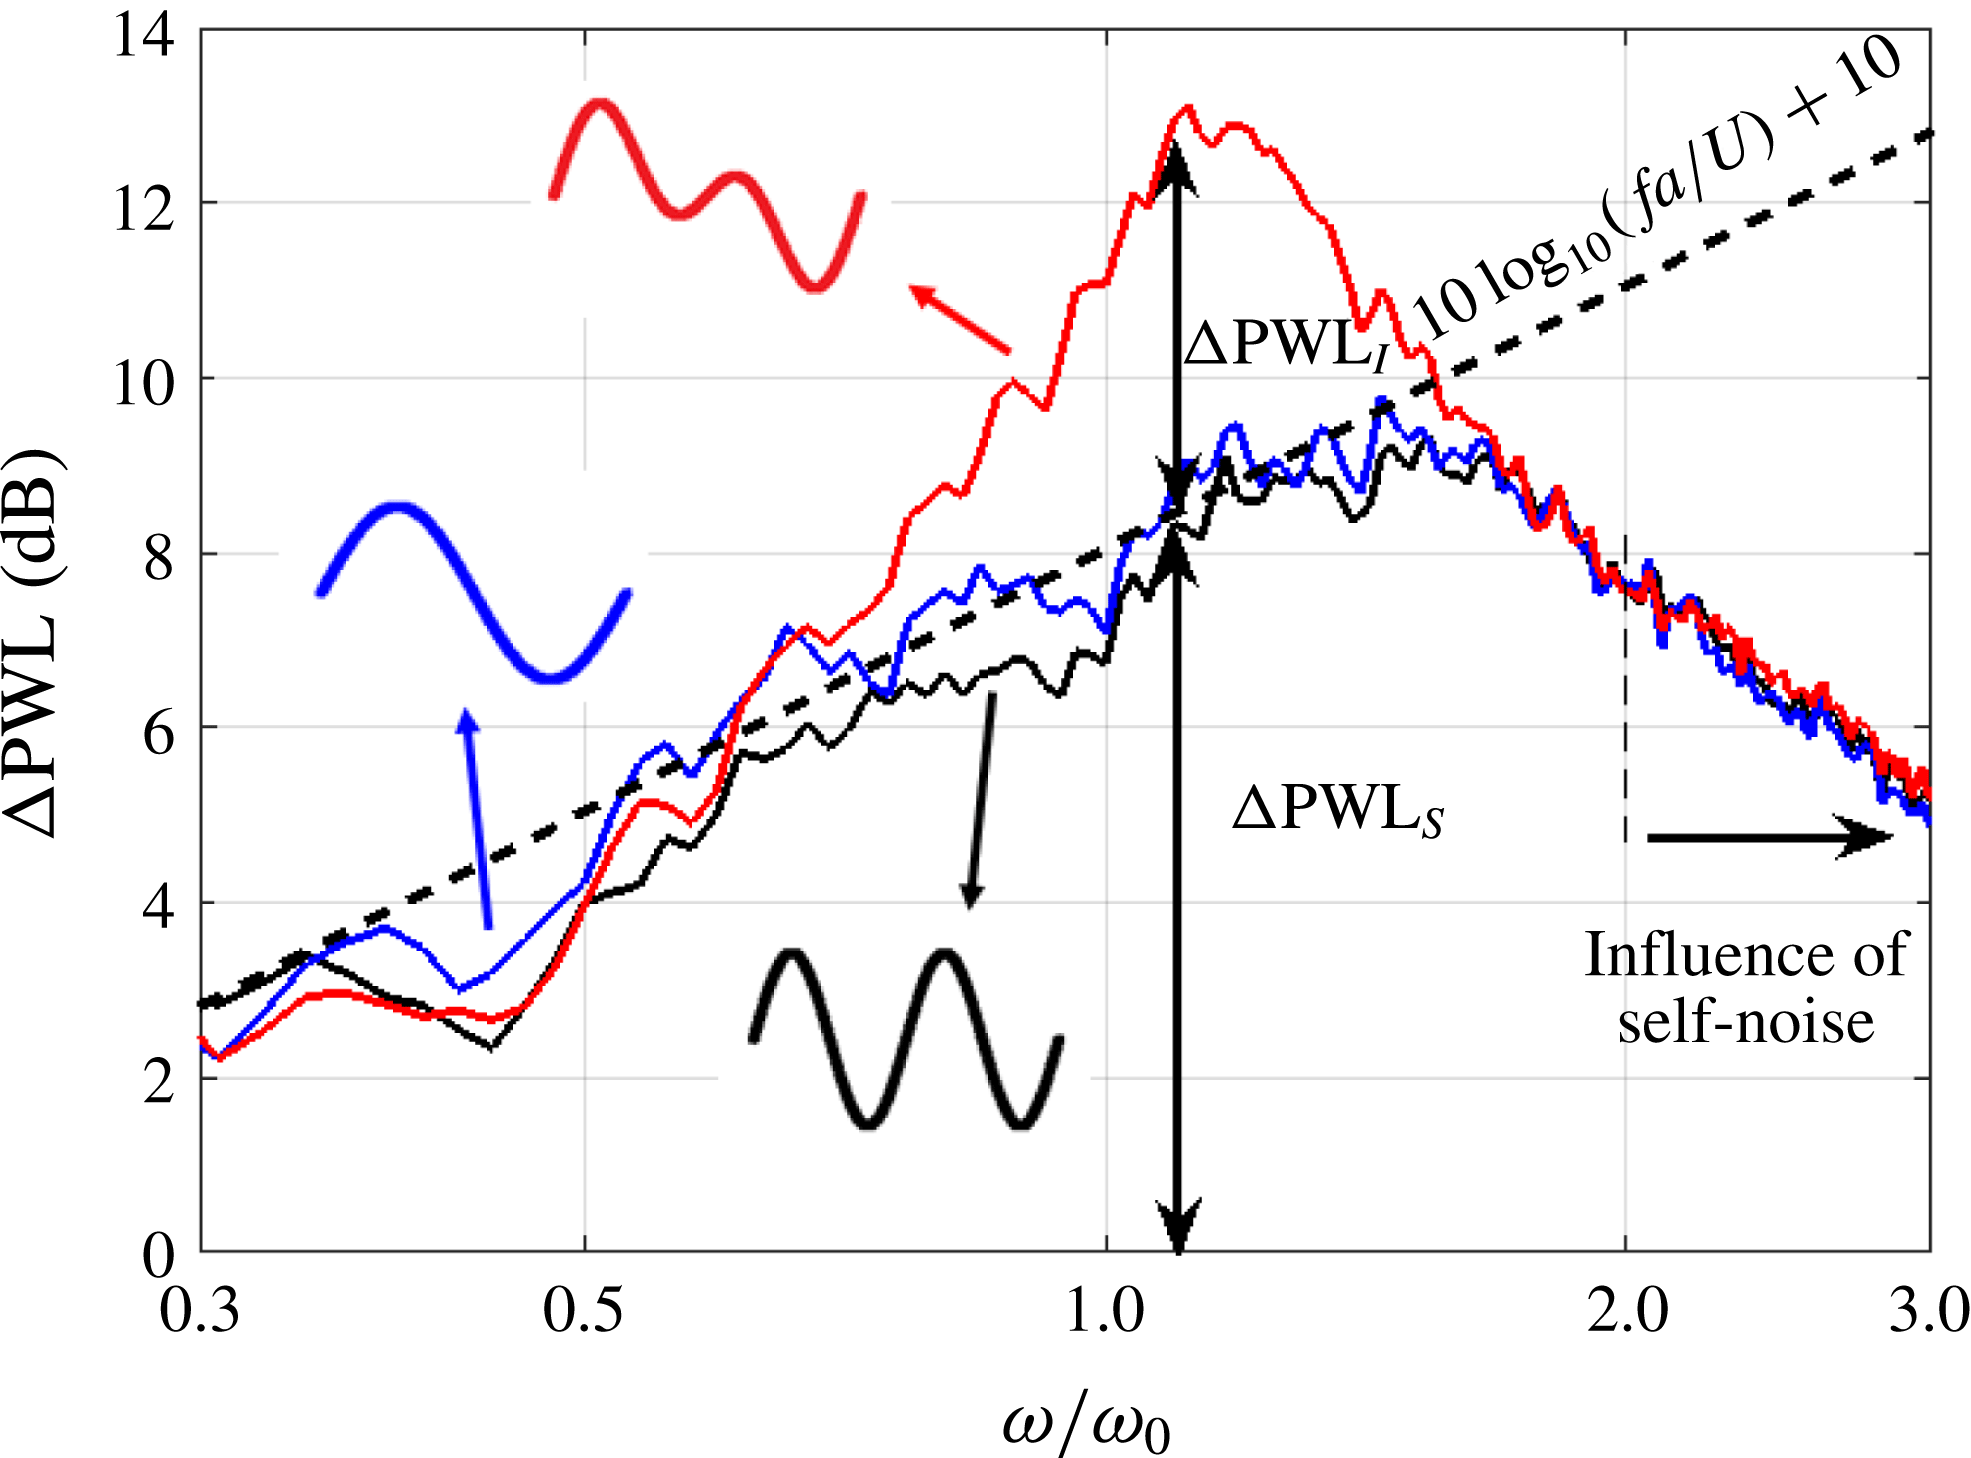
Figure 6 is a typical sound power reduction spectrum plotted against non-dimensional frequency
 $\unicode[STIX]{x1D714}/\unicode[STIX]{x1D714}_{0}$
obtained for a double-wavelength profile comprising the sum of two single-wavelength serrations with wavelengths of
 $\unicode[STIX]{x1D706}_{1}/c_{0}=0.033$
and
 $\unicode[STIX]{x1D706}_{2}=2\unicode[STIX]{x1D706}_{1}$
with identical serration amplitudes
 $h_{1}/c_{0}=h_{2}/c_{0}=0.0568$
with zero phase difference
 $\unicode[STIX]{x1D719}=0$
. The flow speed in this case is
 $U=60~\text{m}~\text{s}^{-1}$
. This double-wavelength profile has a total peak-to-root distance of
 $2a/c_{0}=0.2$
and spanwise distance between adjacent roots
 $\unicode[STIX]{x1D706}/\unicode[STIX]{x1D6EC}$
of 0.95. We shall show below that
 $\unicode[STIX]{x1D706}/\unicode[STIX]{x1D6EC}$
is a critical parameter in determining the level of noise reduction. Noise reduction spectra due to the double-wavelength serration profile and single-wavelength profiles whose amplitudes were chosen to equal that of the double-wavelength profile,
 $2a/c_{0}=0.2$
, are also shown in this figure. A sketch of the profiles is also shown in figure 6. The dashed line in this figure represents the optimum sound power reduction for a single-wavelength serration given by (2.4). Note also that at high frequencies, the self-noise radiated from the trailing edge starts to become the dominant noise source, causing the noise reduction spectra to deviate from the straight line of (2.4).
Simply adding the two single-wavelength components but maintaining the overall amplitude can be seen to provide an additional noise reduction compared to single-wavelength serrations of up to 4 dB in the non-dimensional frequency range of approximately
 $\unicode[STIX]{x1D714}/\unicode[STIX]{x1D714}_{0}=0.7{-}1.4$
. The frequency of maximum noise reduction occurs close to the tuned frequency of
 $\unicode[STIX]{x1D714}/\unicode[STIX]{x1D714}_{0}\approx 1$
, where two adjacent roots are
 $180^{\circ }$
out of phase. This increase in noise reduction performance therefore provides validation of the control principle of destructive interference between adjacent roots. An important finding in figure 6 is that noise reductions are confined to a well-defined frequency bandwidth with no additional noise reduction outside this bandwidth. A detailed explanation of this behaviour will be provided in § 6.
Acoustic performance of double-wavelength serrations for
 $\unicode[STIX]{x1D706}_{1}/c_{0}=0.033$
,
 $\unicode[STIX]{x1D706}_{2}/c_{0}=0.067,h/c_{0}=0.1,\unicode[STIX]{x1D719}=0$
and flow velocity
 $U=60~\text{m}~\text{s}^{-1}$
(black, single-wavelength
 $\unicode[STIX]{x1D706}_{1}$
; blue, single-wavelength
 $\unicode[STIX]{x1D706}_{2}$
; red, double-wavelength serration).
5 Sensitivity of noise reductions due to
 $h$
and
$\unicode[STIX]{x1D706}$


In this section the sensitivity of the noise reduction due to variations in the streamwise and spanwise distance between adjacent
 $h$
and
 $\unicode[STIX]{x1D706}$
respectively is investigated.
5.1 Sensitivity of noise reduction due to
$h$

The noise control principle outlined above suggests that to achieve significant noise reduction in the low frequency limit requires the streamwise distance between the adjacent roots
 $h$
to be as large as possible. The distance between adjacent roots may be altered, either by altering the amplitude of the single-wavelength components
 $h_{1}$
and
 $h_{2}$
or by altering the phase between them.
We now investigate the effect on noise reduction due to varying
 $h$
. Three values of
 $h$
were investigated by fixing
 $h_{1}=h_{2}$
and varying the phase difference to be
 $\unicode[STIX]{x1D719}:0$
,
 $\unicode[STIX]{x03C0}/4$
and
 $\unicode[STIX]{x03C0}/2$
. This combination of parameters has the effect of varying
 $h$
whilst keeping the peak-to-root amplitude
 $2a$
and the spanwise distance between roots
 $\unicode[STIX]{x1D706}$
constant. Note that in this example the spanwise distance
 $\unicode[STIX]{x1D706}/\unicode[STIX]{x1D6EC}=0.95$
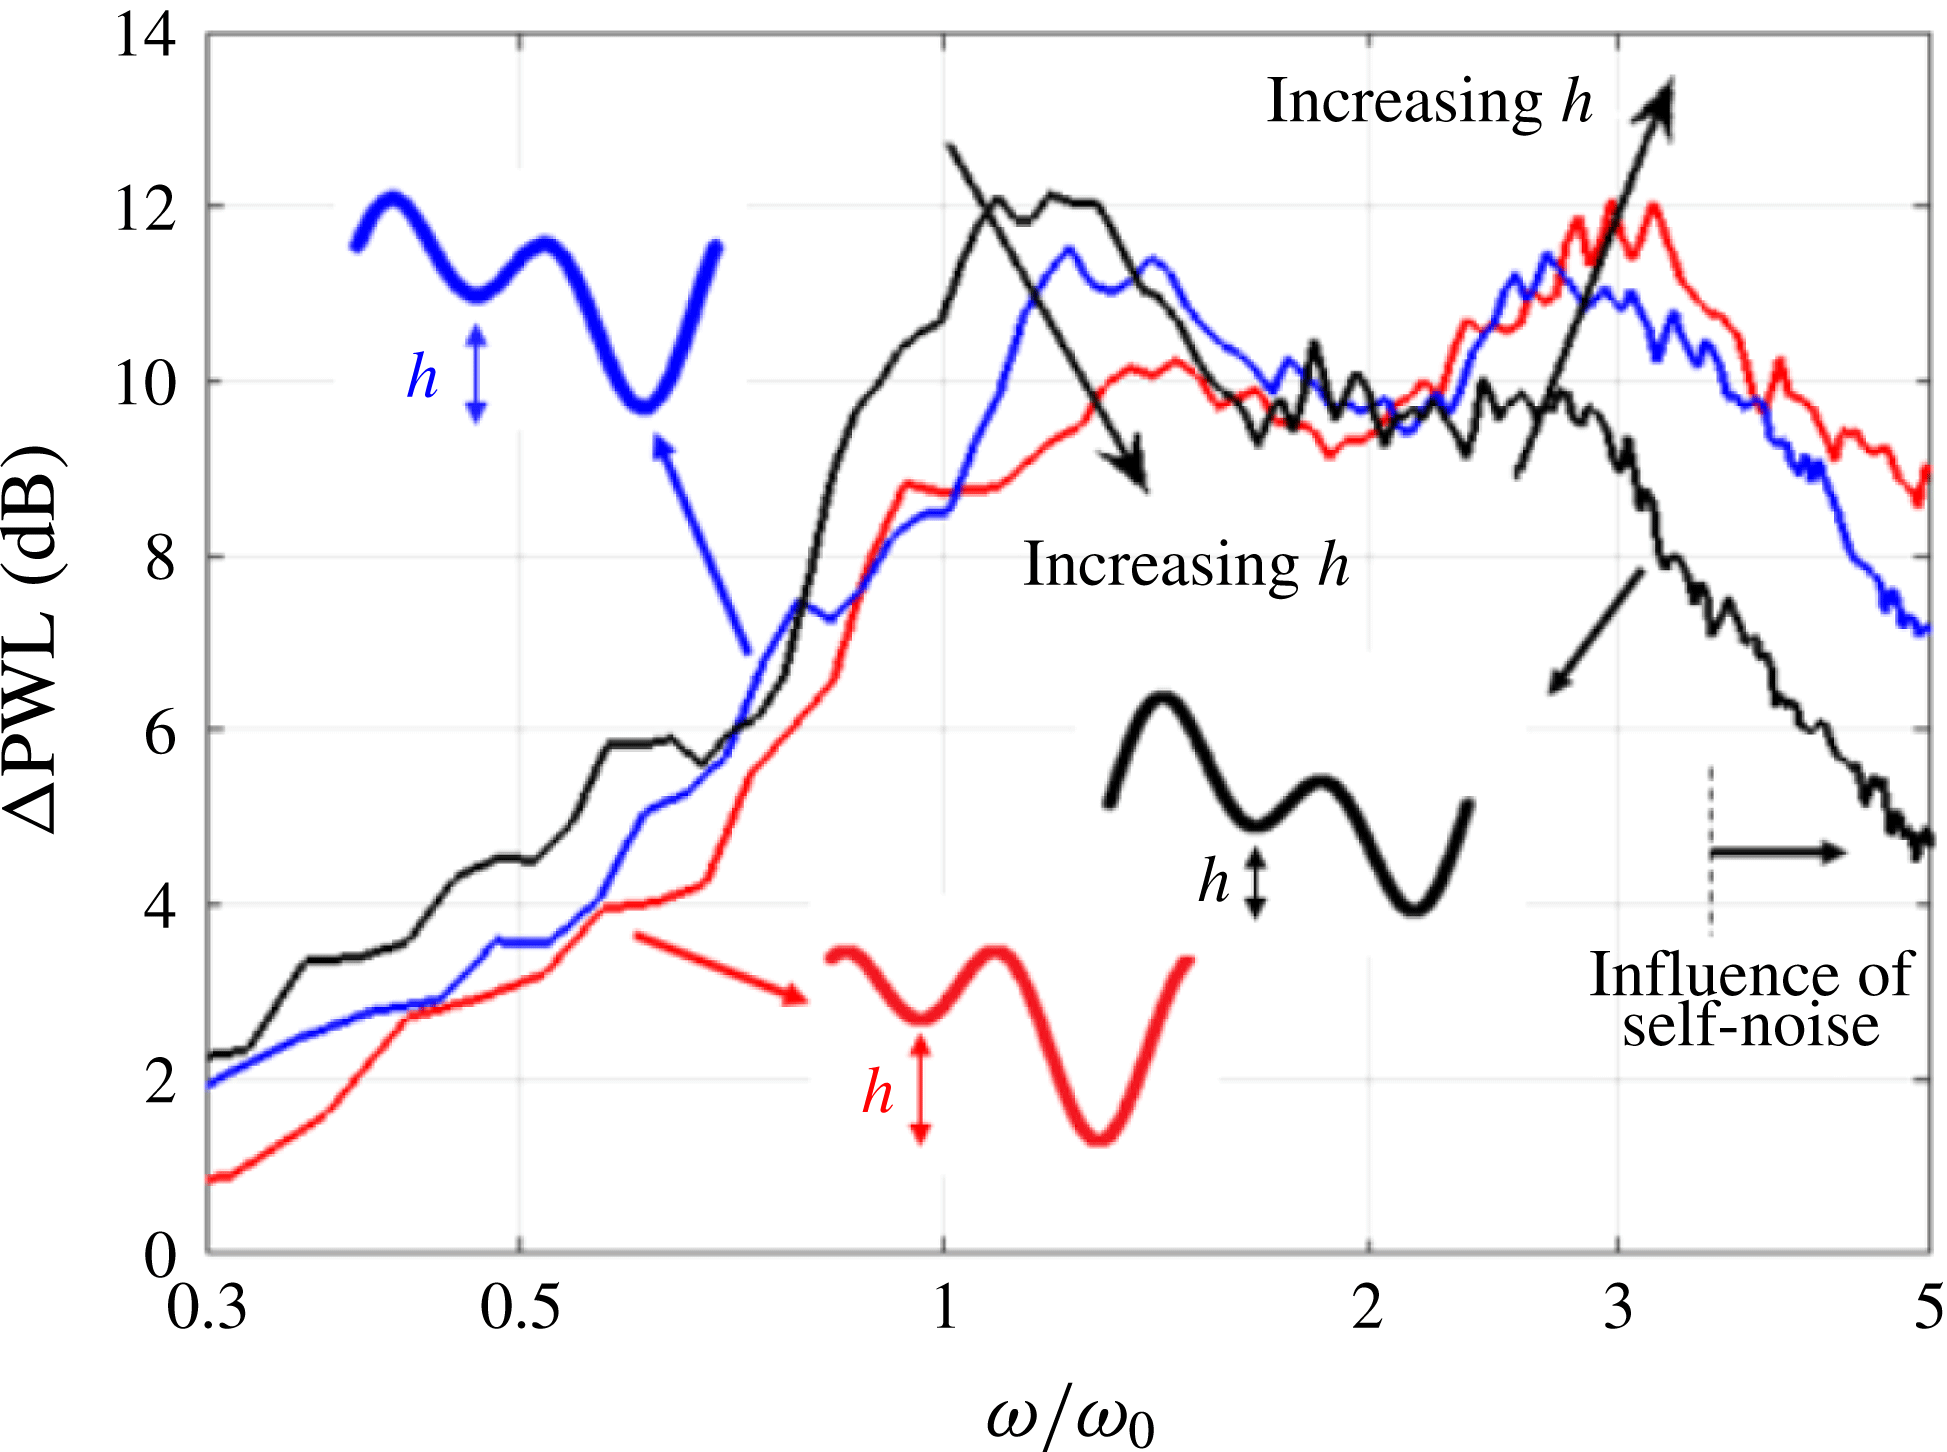
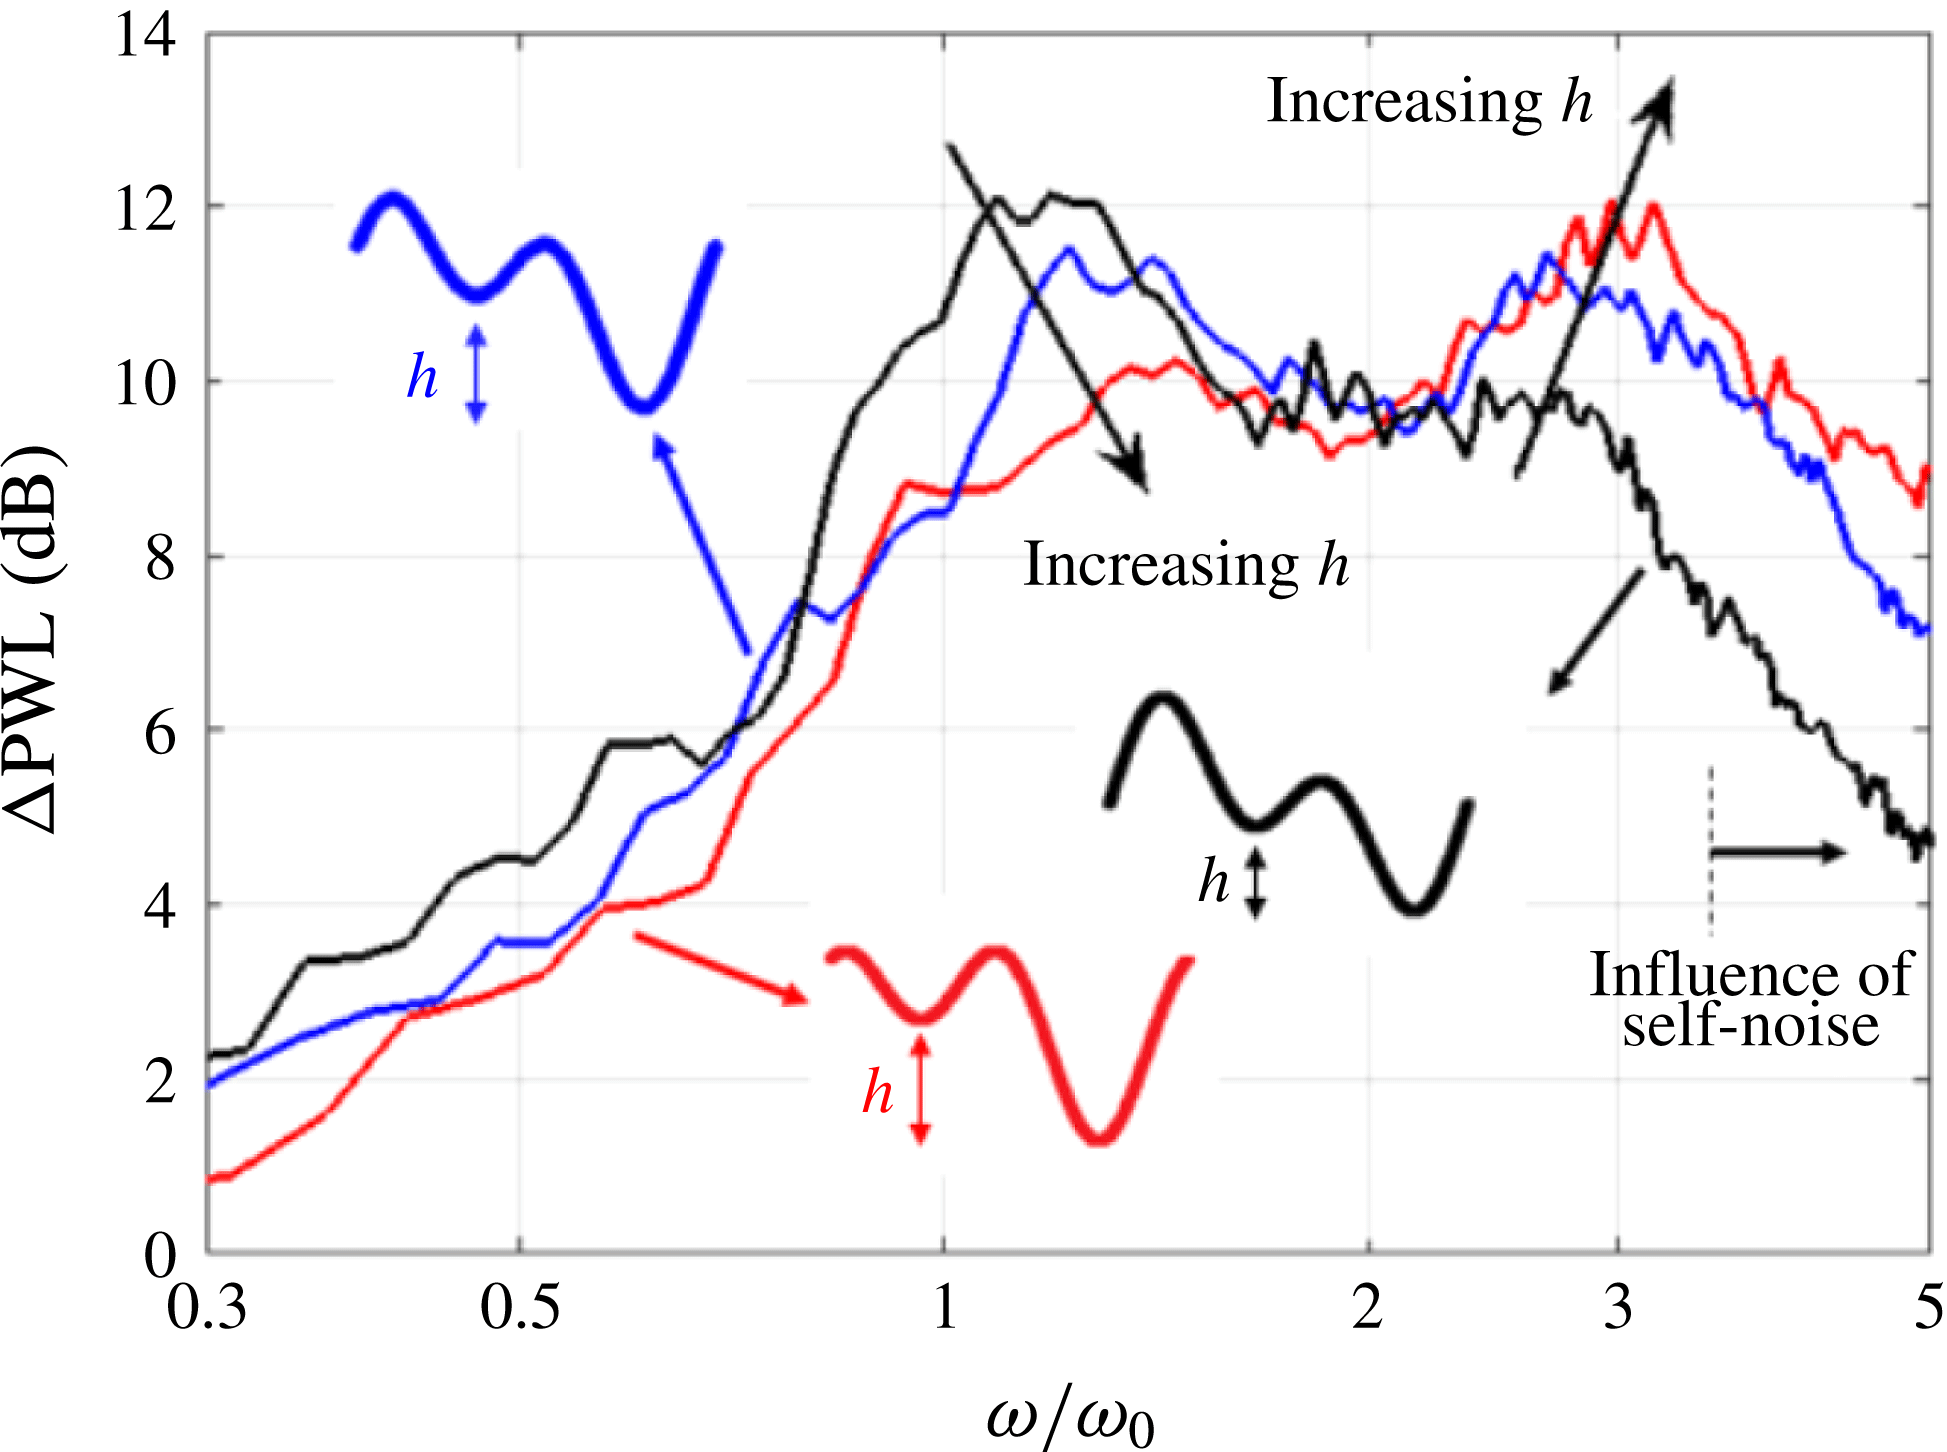
is considerably lower than the critical value of 4, which ensures that adjacent root sources radiate with a high degree of coherence and therefore strongly interfere, as shown in § 5.2. The three sound power reduction spectra are plotted in figure 7 against
 $\unicode[STIX]{x1D714}/\unicode[STIX]{x1D714}_{0}$
.
Acoustic performance of double-wavelength serrations for
 $\unicode[STIX]{x1D706}_{1}/c_{0}=0.033$
and
 $\unicode[STIX]{x1D706}_{2}/c_{0}=0.067,h/c_{0}=0.167$
,
 $U=60~\text{m}~\text{s}^{-1}$
at varying phase
 $\unicode[STIX]{x1D719}$
ratios of 0,
 $\unicode[STIX]{x03C0}/4$
,
 $\unicode[STIX]{x03C0}/2$
(black,
 $\unicode[STIX]{x1D719}=0$
; blue,
 $\unicode[STIX]{x1D719}=\unicode[STIX]{x03C0}/4$
; red,
 $\unicode[STIX]{x1D719}=\unicode[STIX]{x03C0}/2$
).
Noise reductions at the peak frequency
 $\unicode[STIX]{x1D714}/\unicode[STIX]{x1D714}_{0}\approx 1$
diminish as
 $h$
increases. A second peak is also observed in the noise reduction spectra at
 $\unicode[STIX]{x1D714}/\unicode[STIX]{x1D714}_{0}\approx 3$
(i.e. the odd harmonic frequency), again confirming the role of interference between adjacent roots as the main noise reduction mechanism. Increasing
 $h$
can be seen to have two effects on the noise reduction spectra. One is that the noise reduction reduces at the peak frequency
 $\unicode[STIX]{x1D714}_{0}$
but increases at the second peak frequency of
 ${\approx}3\unicode[STIX]{x1D714}_{0}$
. The second effect of increasing
 $h$
is that the frequency of the first peak steadily increases above
 $\unicode[STIX]{x1D714}/\unicode[STIX]{x1D714}_{0}=1$
while the second peak moves towards
 $\unicode[STIX]{x1D714}/\unicode[STIX]{x1D714}_{0}=3$
from below. Note that the dip in noise reduction at
 $\unicode[STIX]{x1D714}/\unicode[STIX]{x1D714}_{0}\approx 2$
corresponds to two root sources radiating in phase.
One explanation for the shifting peak frequencies is that the effective centre of the sources is not precisely located at the roots, as identified in the numerical simulations of Turner & Kim (Reference Turner and Kim2017).
5.2 Sensitivity of noise reduction due to
$\unicode[STIX]{x1D706}$

In this section we investigate the effect on noise reduction due to variations in the spanwise root-to-root separation distance
 $\unicode[STIX]{x1D706}$
. An important requirement for the double-wavelength serration concept to be effective is that the sources between adjacent roots must be highly coherent to be able to interfere destructively. The distance between adjacent roots
 $\unicode[STIX]{x1D706}$
is therefore required to be much less than the optimum spanwise distance identified in Chaitanya et al. (Reference Chaitanya, Joseph, Narayanan, Vanderwel, Turner, Kim and Ganapathisubramani2017) for single-wavelength serrations, necessary to ensure that adjacent roots are incoherent over the entire frequency range. We now investigate this dependence explicitly. A parametric study is performed in which only the spanwise distance
 $\unicode[STIX]{x1D706}$
between adjacent roots is varied whilst maintaining constant root-to-root streamwise distance
 $h$
. This was achieved by varying
 $\unicode[STIX]{x1D706}_{1}$
but maintaining the ratio between the two wavelengths
 $\unicode[STIX]{x1D706}_{1}/\unicode[STIX]{x1D706}_{2}$
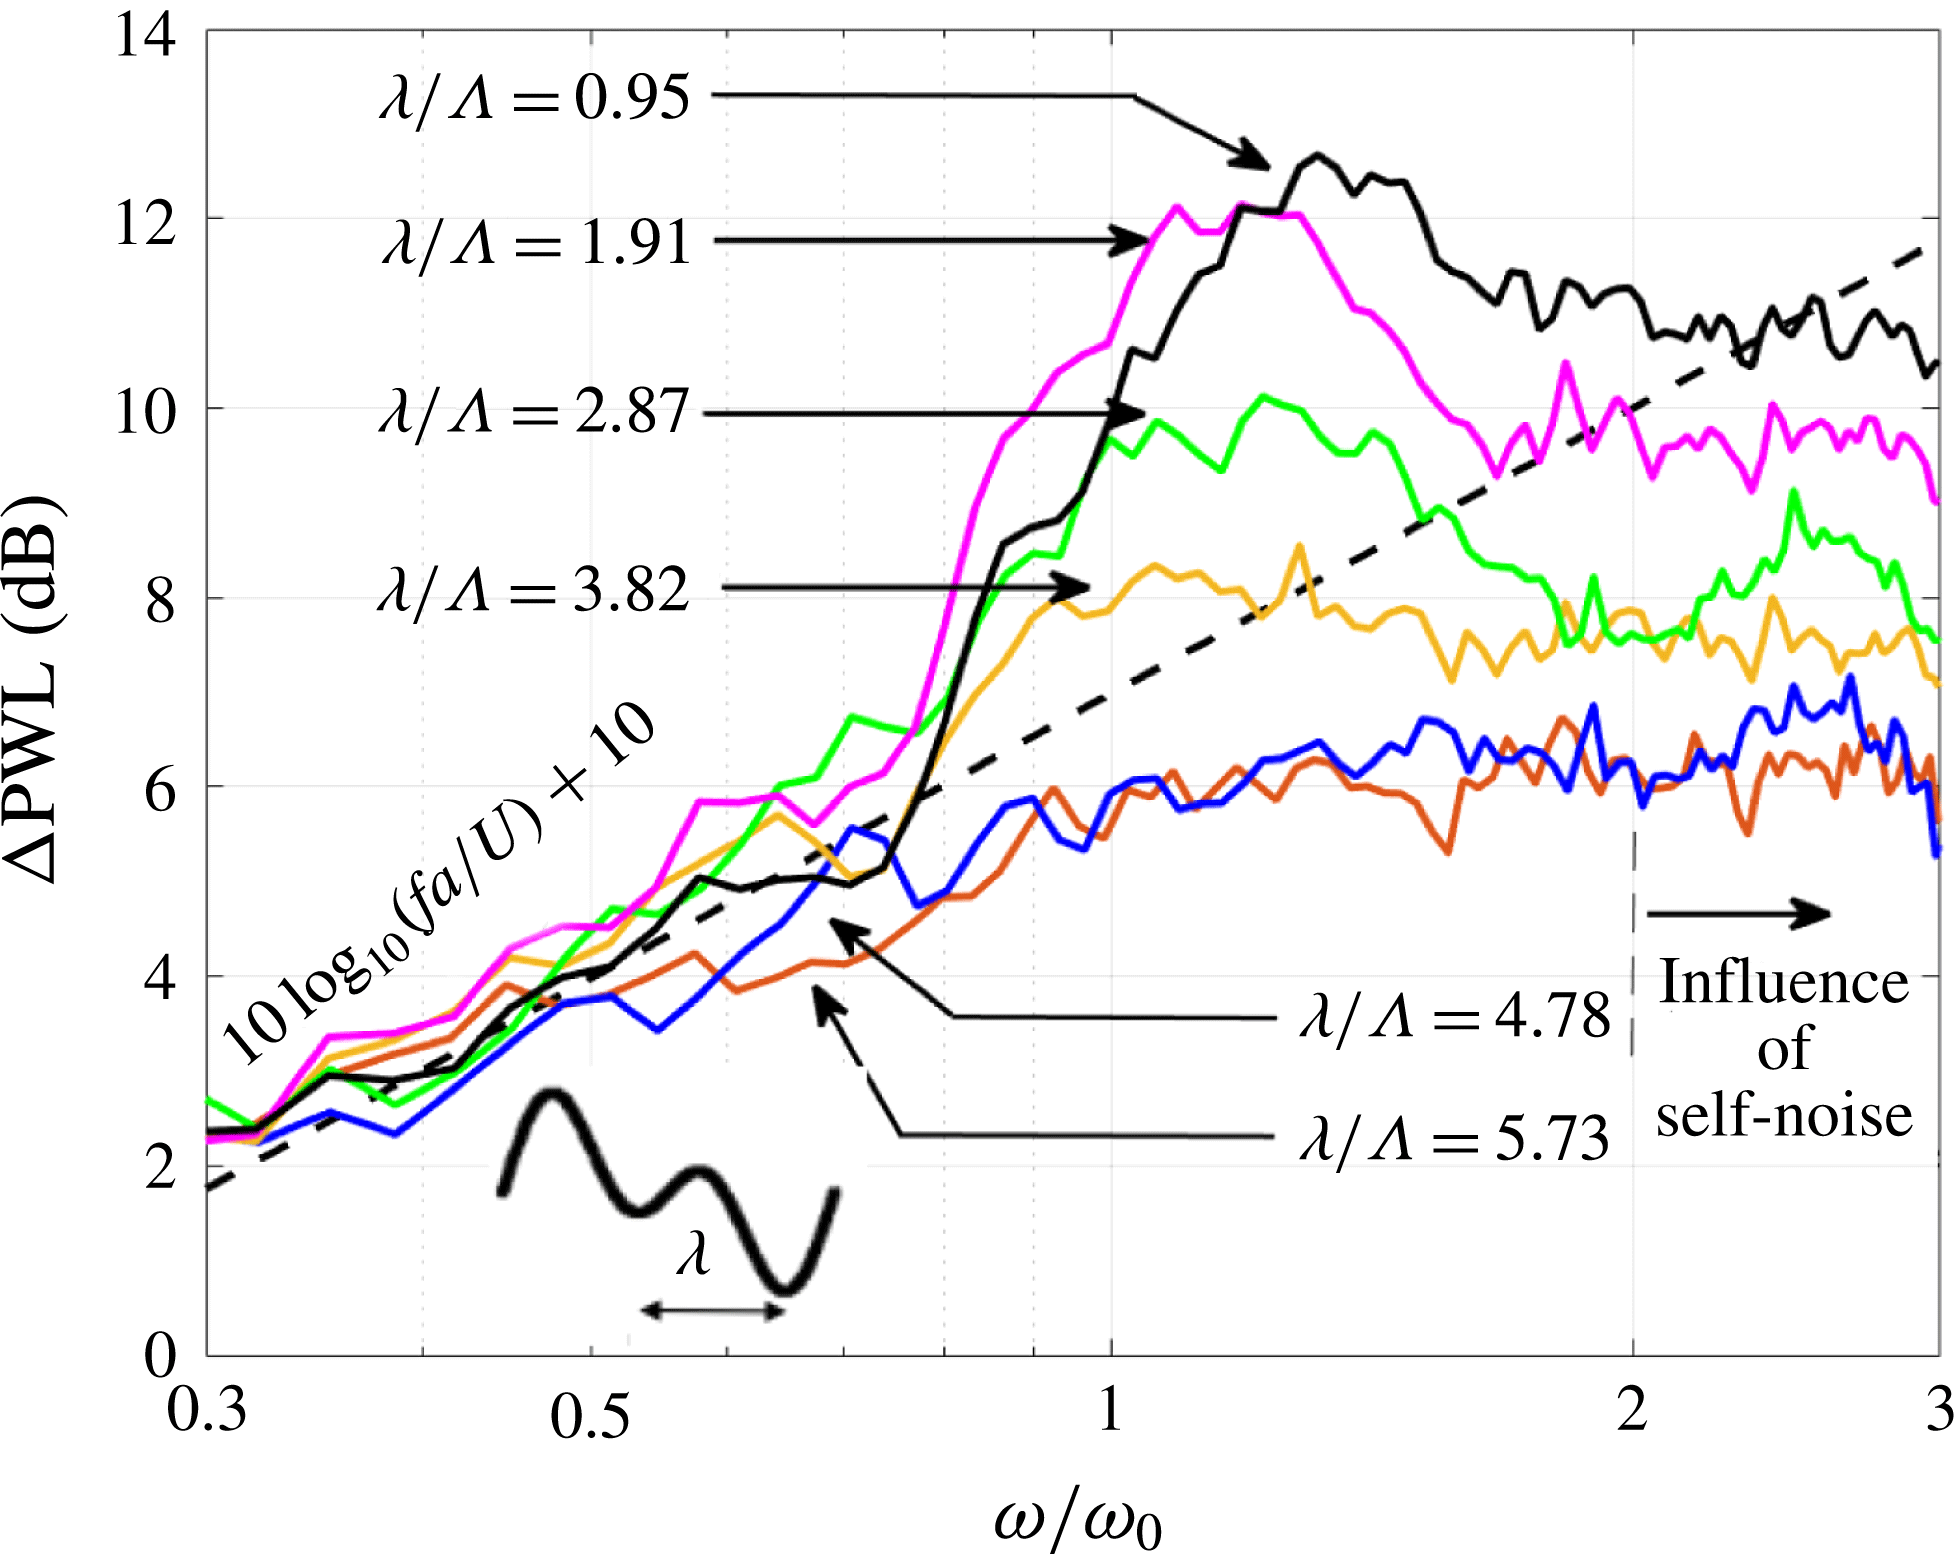
at 0.5. Figure 8 shows the sound power reduction versus
 $\unicode[STIX]{x1D714}/\unicode[STIX]{x1D714}_{0}$
for six different spanwise distances
 $\unicode[STIX]{x1D706}/\unicode[STIX]{x1D6EC}$
of between 0.95 and 5.73 at a fixed peak-to-root amplitude
 $2a/c_{0}=0.33$
and a flow speed of
 $U=60~\text{m}~\text{s}^{-1}$
. This range of values was chosen to vary either side of the optimum wavelength,
 $\unicode[STIX]{x1D706}/\unicode[STIX]{x1D6EC}$
of 4, for which maximum noise reductions occur for single-wavelength serrations. Also shown in this figure is the line
 $10\log _{10}(fa/U)+10$
corresponding to the maximum sound power reduction versus frequency that can be obtained by a single-wavelength serration, at the optimum wavelength
 $\unicode[STIX]{x1D706}=\unicode[STIX]{x1D706}_{o}$
.
Influence of serration wavelength on noise reduction at a fixed peak-to-root amplitude
 $2a=0.33$
and (
 $\unicode[STIX]{x1D706}_{1}/\unicode[STIX]{x1D706}_{2}=0.5$
) at jet velocity
 $60~\text{m}~\text{s}^{-1}$
.
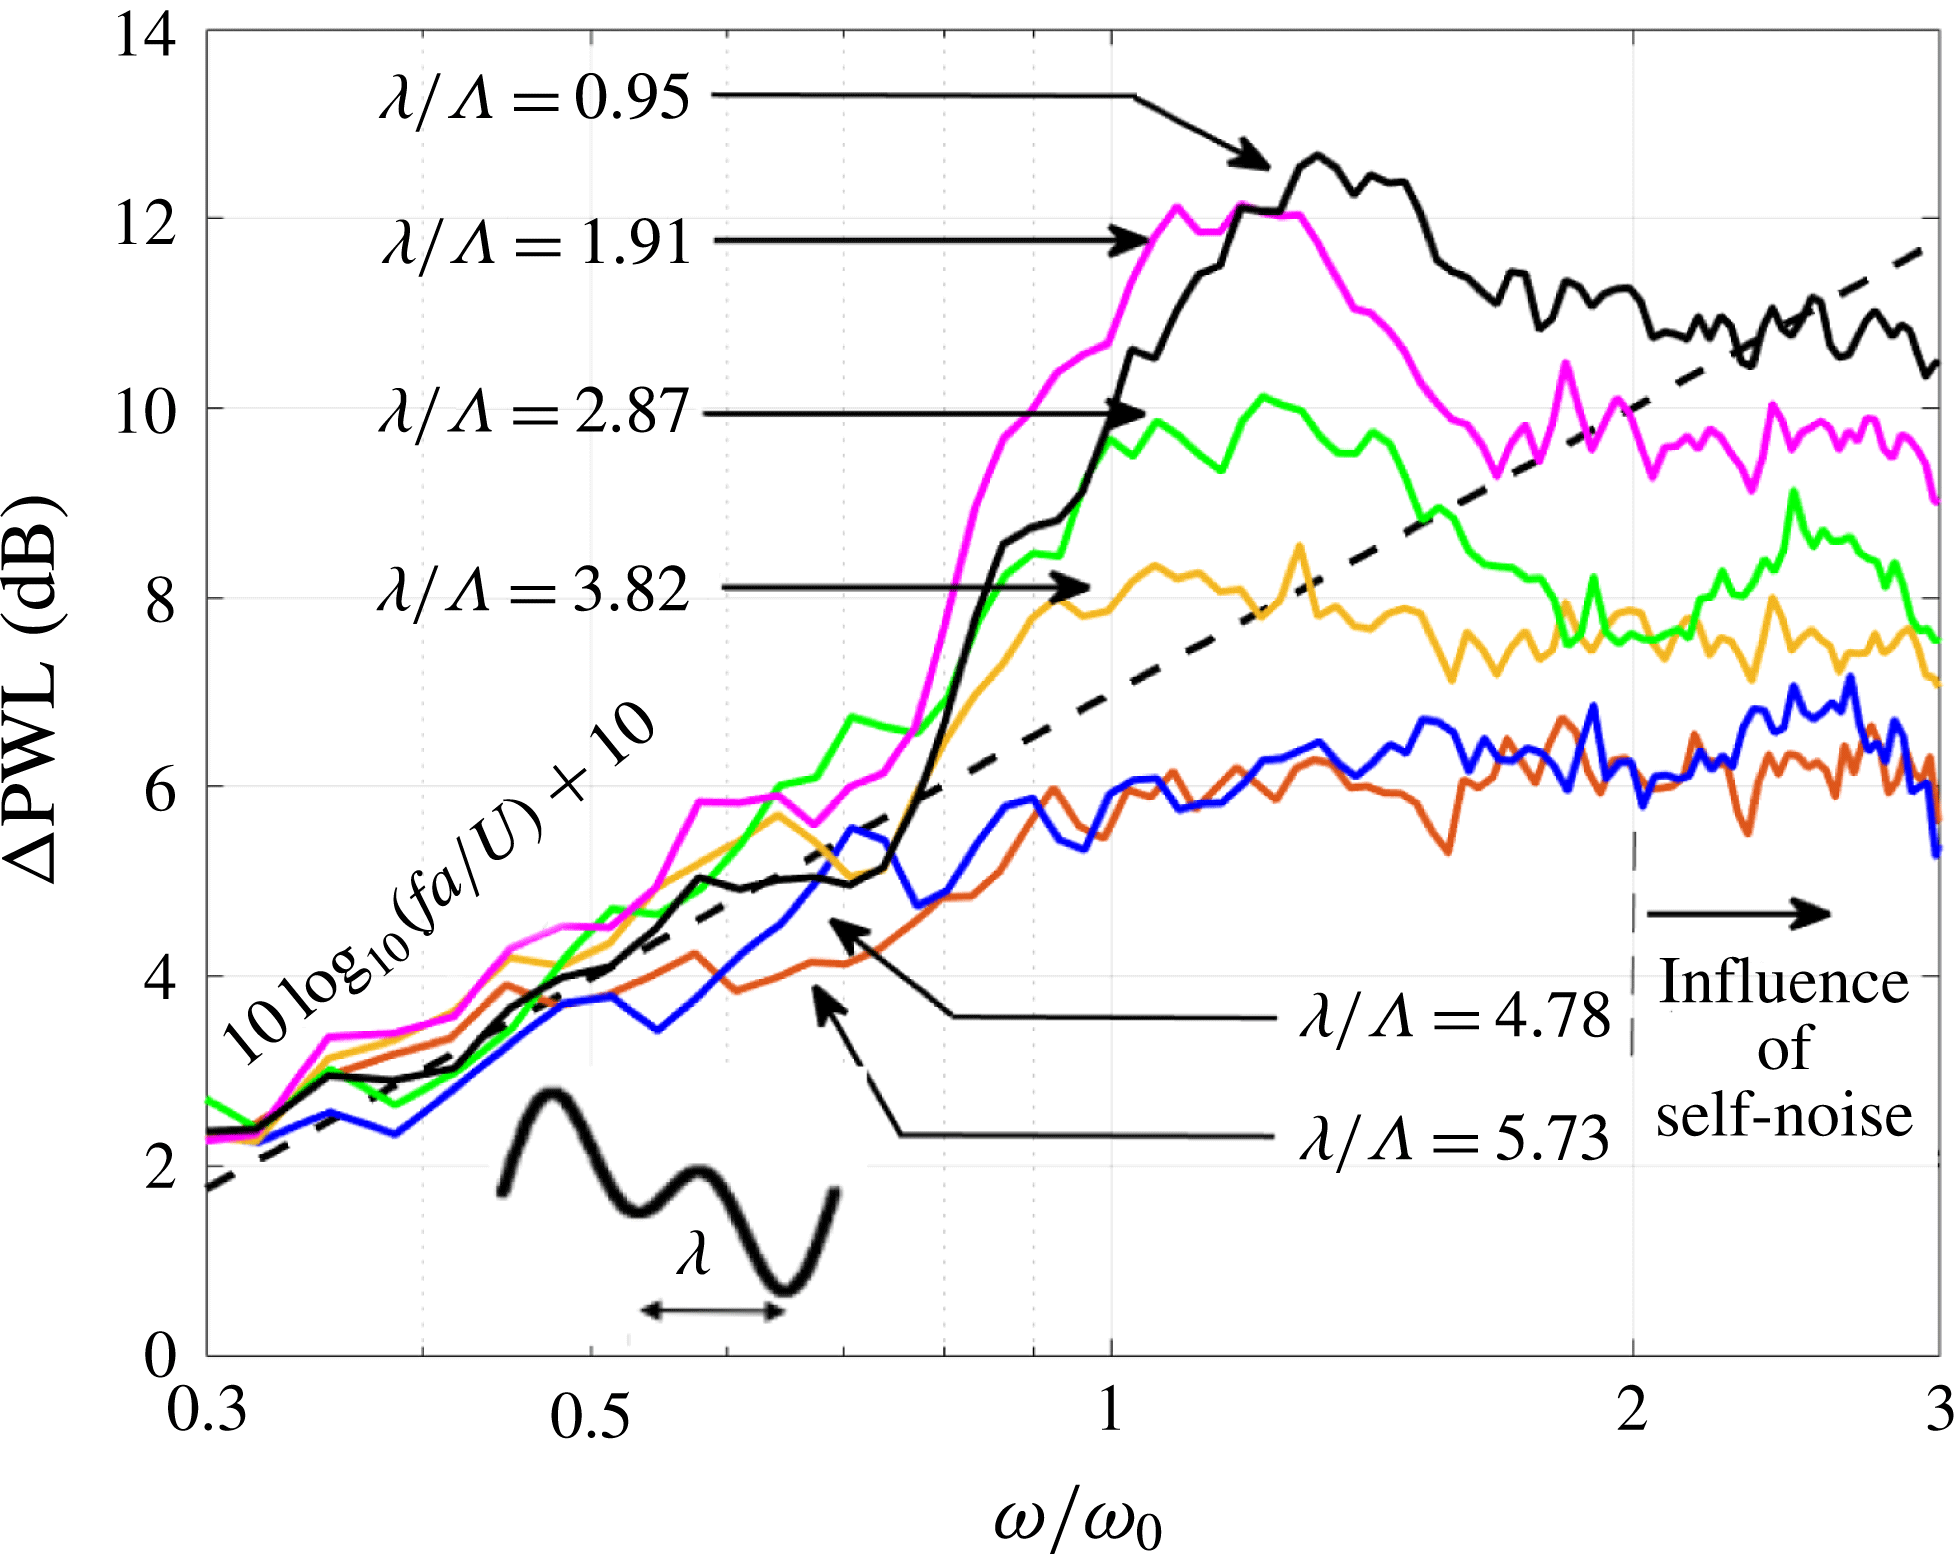
Figure 8 can be summarized as follows.
(i) Clearly defined peaks in the sound power reduction spectra at non-dimensional frequencies of approximately 1 are only observed for the four cases (
$\unicode[STIX]{x1D706}/\unicode[STIX]{x1D6EC}=0.95,1.91,2.87,3.82$
) in which
$\unicode[STIX]{x1D706}/\unicode[STIX]{x1D6EC}\leqslant$
4. In these cases, therefore, adjacent roots strongly interfere and the sound power reductions significantly exceed the fundamental upper limit
$10\log _{10}(fa/U)+10$
achievable using single-wavelength serrations (Chaitanya et al.
Reference Chaitanya, Joseph, Narayanan, Vanderwel, Turner, Kim and Ganapathisubramani2017). In contrast, no clear peaks in the noise reduction spectra can be observed for the three cases in which
$\unicode[STIX]{x1D706}/\unicode[STIX]{x1D6EC}\geqslant$
4 for which adjacent root sources are incoherent.(ii) Sound power reductions are only achieved over a band of frequencies, which is highly dependent on
$\unicode[STIX]{x1D706}$
. The reason for this behaviour will be explored in § 6 below.(iii) Sound power reductions generally improve as
$\unicode[STIX]{x1D706}/\unicode[STIX]{x1D6EC}$
is reduced below the threshold value of 4, suggesting that the level of coherence between the adjacent root sources increases as
$\unicode[STIX]{x1D706}/\unicode[STIX]{x1D6EC}$
is reduced and hence the degree of destructive interference is improved.(iv) The peak frequency of maximum noise reduction for the cases
$\unicode[STIX]{x1D706}/\unicode[STIX]{x1D6EC}\leqslant$
4 increases monotonically from the lowest value of 1 to 1.3 at the shortest separation distance
$\unicode[STIX]{x1D706}/\unicode[STIX]{x1D6EC}=0.95$
.





6 Simple analytical model for additional noise reductions
In this section a simple analytic model is derived to aid the understanding of the noise reductions with the serration geometry observed experimentally above. In the model we focus on the additional noise reduction
 $\unicode[STIX]{x0394}\text{PWL}_{I}$
due to interference between adjacent root sources.
In this simple model we assume that the root sources have identical source strength but radiate to a far-field observer with a phase difference
 $\unicode[STIX]{x1D714}h/U$
arising from the time delay taken for the turbulent eddies to convect between the streamwise distance
 $h$
between two adjacent roots. Consider two compact sources located at adjacent root spanwise positions
 $r_{1}$
and
 $r_{2}=r_{1}+\unicode[STIX]{x1D706}$
, and streamwise locations
 $x_{1}$
and
 $x_{2}=x_{1}+h$
with source strengths
 $q(r_{1},x_{1},\unicode[STIX]{x1D714}h/U)$
and
 $q(r_{2},x_{2},\unicode[STIX]{x1D714}h/U)$
along the span of the aerofoil, as shown in figure 1. The path length differences between adjacent roots to a far-field observer can be neglected since they are generally much closer together compared to an acoustic wavelength. The total radiated pressure at any given frequency
 $\unicode[STIX]{x1D714}$
is therefore proportional to the sum of the source strengths with relative phase difference included:
 $$\begin{eqnarray}p(\unicode[STIX]{x1D714})\propto q(r_{1},x_{1},\unicode[STIX]{x1D714}h/U)+q(r_{2},x_{2},\unicode[STIX]{x1D714}h/U)\text{e}^{-\text{i}\unicode[STIX]{x1D714}h/U}.\end{eqnarray}$$
The level of additional noise reduction due to interference between adjacent roots is therefore determined by the degree of coherence between them as turbulent flow convects over the aerofoil. In this paper we make the assumption that the turbulence is frozen and there is therefore no coherence loss in the streamwise direction. All reductions in coherence between the adjacent coherent sources therefore only arise from their spanwise separation distance
 $\unicode[STIX]{x1D706}$
. Finally we make the assumption that the source strength at the root position (
 $r_{2}$
,
 $x_{2}$
) is identical to that at root position (
 $r_{1}$
,
 $x_{1}$
), and as shown in Chaitanya et al. (Reference Chaitanya, Joseph, Narayanan, Vanderwel, Turner, Kim and Ganapathisubramani2017), is only a function of non-dimensional frequency
 $\unicode[STIX]{x1D714}a/U$
. The cross-spectrum between adjacent root sources may therefore be written as
 $$\begin{eqnarray}\displaystyle S_{qq}(r_{1},r_{1}+\unicode[STIX]{x1D706},x_{1},x_{1}+h,\unicode[STIX]{x1D714}) & = & \displaystyle \boldsymbol{E}[q^{\ast }(r_{1},x_{1},\unicode[STIX]{x1D714}h/U)q(r_{1}+\unicode[STIX]{x1D706},x_{1}+h,\unicode[STIX]{x1D714}h/U)]\nonumber\\ \displaystyle & = & \displaystyle \overline{q^{2}}(\unicode[STIX]{x1D714}a/U)\unicode[STIX]{x1D6FE}^{2}(\unicode[STIX]{x1D706},\unicode[STIX]{x1D714}),\end{eqnarray}$$
where
 $\overline{q^{2}}(\unicode[STIX]{x1D714}a/U)$
is the mean square source strength at the root locations.
The radiated sound power
 $W(\unicode[STIX]{x1D714})$
is related to the (integrated) mean square far-field pressure, i.e.
 $$\begin{eqnarray}W(\unicode[STIX]{x1D714})\propto \overline{p^{2}}(\unicode[STIX]{x1D714})\propto \boldsymbol{E}[p^{\ast }(\unicode[STIX]{x1D714})p(\unicode[STIX]{x1D714})].\end{eqnarray}$$
Substituting (6.1) and (6.2) into (6.3), the radiated sound power becomes
 $$\begin{eqnarray}W(\unicode[STIX]{x1D714})\propto 2\overline{q^{2}}(\unicode[STIX]{x1D714}a/U)[1+\unicode[STIX]{x1D6FE}^{2}(\unicode[STIX]{x1D706},\unicode[STIX]{x1D714})\cos (\unicode[STIX]{x1D714}h/U)].\end{eqnarray}$$
Equation (6.4) for the sound power radiated by the double-wavelength serration will now be compared to the sound power
 $W_{s}(\unicode[STIX]{x1D714})$
radiated by the optimum single-wavelength serration with the same amplitude. This can be calculated within the present theoretical framework by assuming zero phase difference and zero coherence between adjacent roots, i.e. substituting
 $h=0$
and
 $\unicode[STIX]{x1D6FE}^{2}(\unicode[STIX]{x1D706},\unicode[STIX]{x1D714})=0$
in (6.4), to give
 $$\begin{eqnarray}W_{s}(\unicode[STIX]{x1D714})\propto 2\overline{q^{2}}(\unicode[STIX]{x1D714}a/U),\end{eqnarray}$$
where the factor of 2 arises since we are considering the root sources in pairs.
The additional sound power reduction relative to the optimum single-wavelength serration may be written as
 $\unicode[STIX]{x0394}\text{PWL}_{I}(\unicode[STIX]{x1D714})=10\log _{10}(\unicode[STIX]{x1D716})$
, where
 $\unicode[STIX]{x1D716}=W_{s}(\unicode[STIX]{x1D714})/W(\unicode[STIX]{x1D714})$
(defined to be positive):
 $$\begin{eqnarray}\unicode[STIX]{x0394}\text{PWL}_{I}(\unicode[STIX]{x1D714})=-10\log _{10}[1+\unicode[STIX]{x1D6FE}^{2}(\unicode[STIX]{x1D706},\unicode[STIX]{x1D714})\cos (\unicode[STIX]{x1D714}h/U)].\end{eqnarray}$$
Noise reductions additional to single-wavelength serrations are therefore determined by the product of two factors. The first is related to the phase difference between adjacent roots
 $\unicode[STIX]{x1D714}h/U$
. The second factor is determined by the coherence between two adjacent root sources
 $\unicode[STIX]{x1D6FE}^{2}(\unicode[STIX]{x1D706},\unicode[STIX]{x1D714})$
. We now estimate this coherence value based on the observation by Kim et al. (Reference Kim, Haeri and Joseph2016). He showed through numerical simulation that the coherence between two sources along the leading edge of a single-wavelength serrated flat plate separated one wavelength
 $\unicode[STIX]{x1D706}$
apart is identical to that along a straight leading edge at the same spanwise separation distance
 $\unicode[STIX]{x1D706}$
.
The coherence function
 $\unicode[STIX]{x1D6FE}^{2}(\unicode[STIX]{x1D706},\unicode[STIX]{x1D714})$
between two points
 $r_{1}$
and
 $r_{1}+\unicode[STIX]{x1D706}$
along the leading edge of a flat plate at any streamwise position
 $x$
from the leading edge can be readily computed from
 $\unicode[STIX]{x1D6FE}^{2}(\unicode[STIX]{x1D706},\unicode[STIX]{x1D714})=S_{qq}(x,\unicode[STIX]{x1D706}/\unicode[STIX]{x1D6EC},\unicode[STIX]{x1D714})/S_{qq}(x,0,\unicode[STIX]{x1D714})$
, where
 $S_{qq}(x,r_{1},r_{1}+\unicode[STIX]{x1D706},\unicode[STIX]{x1D714})$
is the surface pressure cross-spectrum given in Amiet (Reference Amiet1975) and Mish (Reference Mish2003). Amiet’s original expression is in terms of the non-dimensional pressure jump
 $g(x,K_{x},k_{r})$
across the flat plate at streamwise position
 $x$
from the leading edge due to a single frequency vortical gust with streamwise and spanwise wavenumber components
 $K_{x}=\unicode[STIX]{x1D714}/U$
and
 $k_{r}$
, respectively, and the upwash turbulence velocity wavenumber spectrum
 $\unicode[STIX]{x1D6F7}_{ww}(K_{x},k_{r})$
. By making the substitution
 $\hat{K_{x}}=K_{x}\unicode[STIX]{x1D6EC}$
,
 $\hat{k_{r}}=k_{r}\unicode[STIX]{x1D6EC}$
in this expression,
 $S_{qq}$
may be written as
 $$\begin{eqnarray}S_{qq}(x,\unicode[STIX]{x1D706}/\unicode[STIX]{x1D6EC},\hat{K_{x}})=(2\unicode[STIX]{x03C0}\unicode[STIX]{x1D70C}b)^{2}U\int _{-\infty }^{\infty }g^{\ast }(x,\hat{K_{x}},\hat{k_{r}})g(x,\hat{K_{x}},\hat{k_{r}})\unicode[STIX]{x1D6F7}_{ww}(\hat{K_{x}},\hat{k_{r}})\text{e}^{\text{i}\hat{k_{r}}\unicode[STIX]{x1D706}/\unicode[STIX]{x1D6EC}}\,\text{d}\hat{k_{r}}.\end{eqnarray}$$
The form of
 $S_{qq}$
makes explicit that the spanwise surface pressure coherence function is only a function of
 $\unicode[STIX]{x1D706}/\unicode[STIX]{x1D6EC}$
and non-dimensional frequency
 $\hat{K_{x}}=\unicode[STIX]{x1D714}\unicode[STIX]{x1D6EC}/U$
. The degree of coherence between adjacent root sources is therefore completely determined by these two quantities. From here on we denote the non-dimensional frequency
 $\hat{K_{x}}$
by
 $\unicode[STIX]{x1D714}/\unicode[STIX]{x1D714}_{\unicode[STIX]{x1D6EC}}$
, to indicate the significance of the characteristic frequency
 $\unicode[STIX]{x1D714}_{\unicode[STIX]{x1D6EC}}$
linked to the turbulence length scale defined by
 $$\begin{eqnarray}\unicode[STIX]{x1D714}_{\unicode[STIX]{x1D6EC}}=U/\unicode[STIX]{x1D6EC}.\end{eqnarray}$$
The sound power level reductions can therefore be expressed completely in terms of two non-dimensional frequencies
 $\unicode[STIX]{x1D714}/\unicode[STIX]{x1D714}_{0}$
,
 $\unicode[STIX]{x1D714}/\unicode[STIX]{x1D714}_{\unicode[STIX]{x1D6EC}}$
and the non-dimensional separation distance between adjacent roots relative to the turbulence integral length scale
 $\unicode[STIX]{x1D706}/\unicode[STIX]{x1D6EC}$
:
 $$\begin{eqnarray}\unicode[STIX]{x0394}\text{PWL}_{I}(\unicode[STIX]{x1D714})=-10\log _{10}[1+\unicode[STIX]{x1D6FE}^{2}(\unicode[STIX]{x1D706}/\unicode[STIX]{x1D6EC},\unicode[STIX]{x1D714}/\unicode[STIX]{x1D714}_{\unicode[STIX]{x1D6EC}})\cos (\unicode[STIX]{x03C0}\unicode[STIX]{x1D714}/\unicode[STIX]{x1D714}_{0})].\end{eqnarray}$$
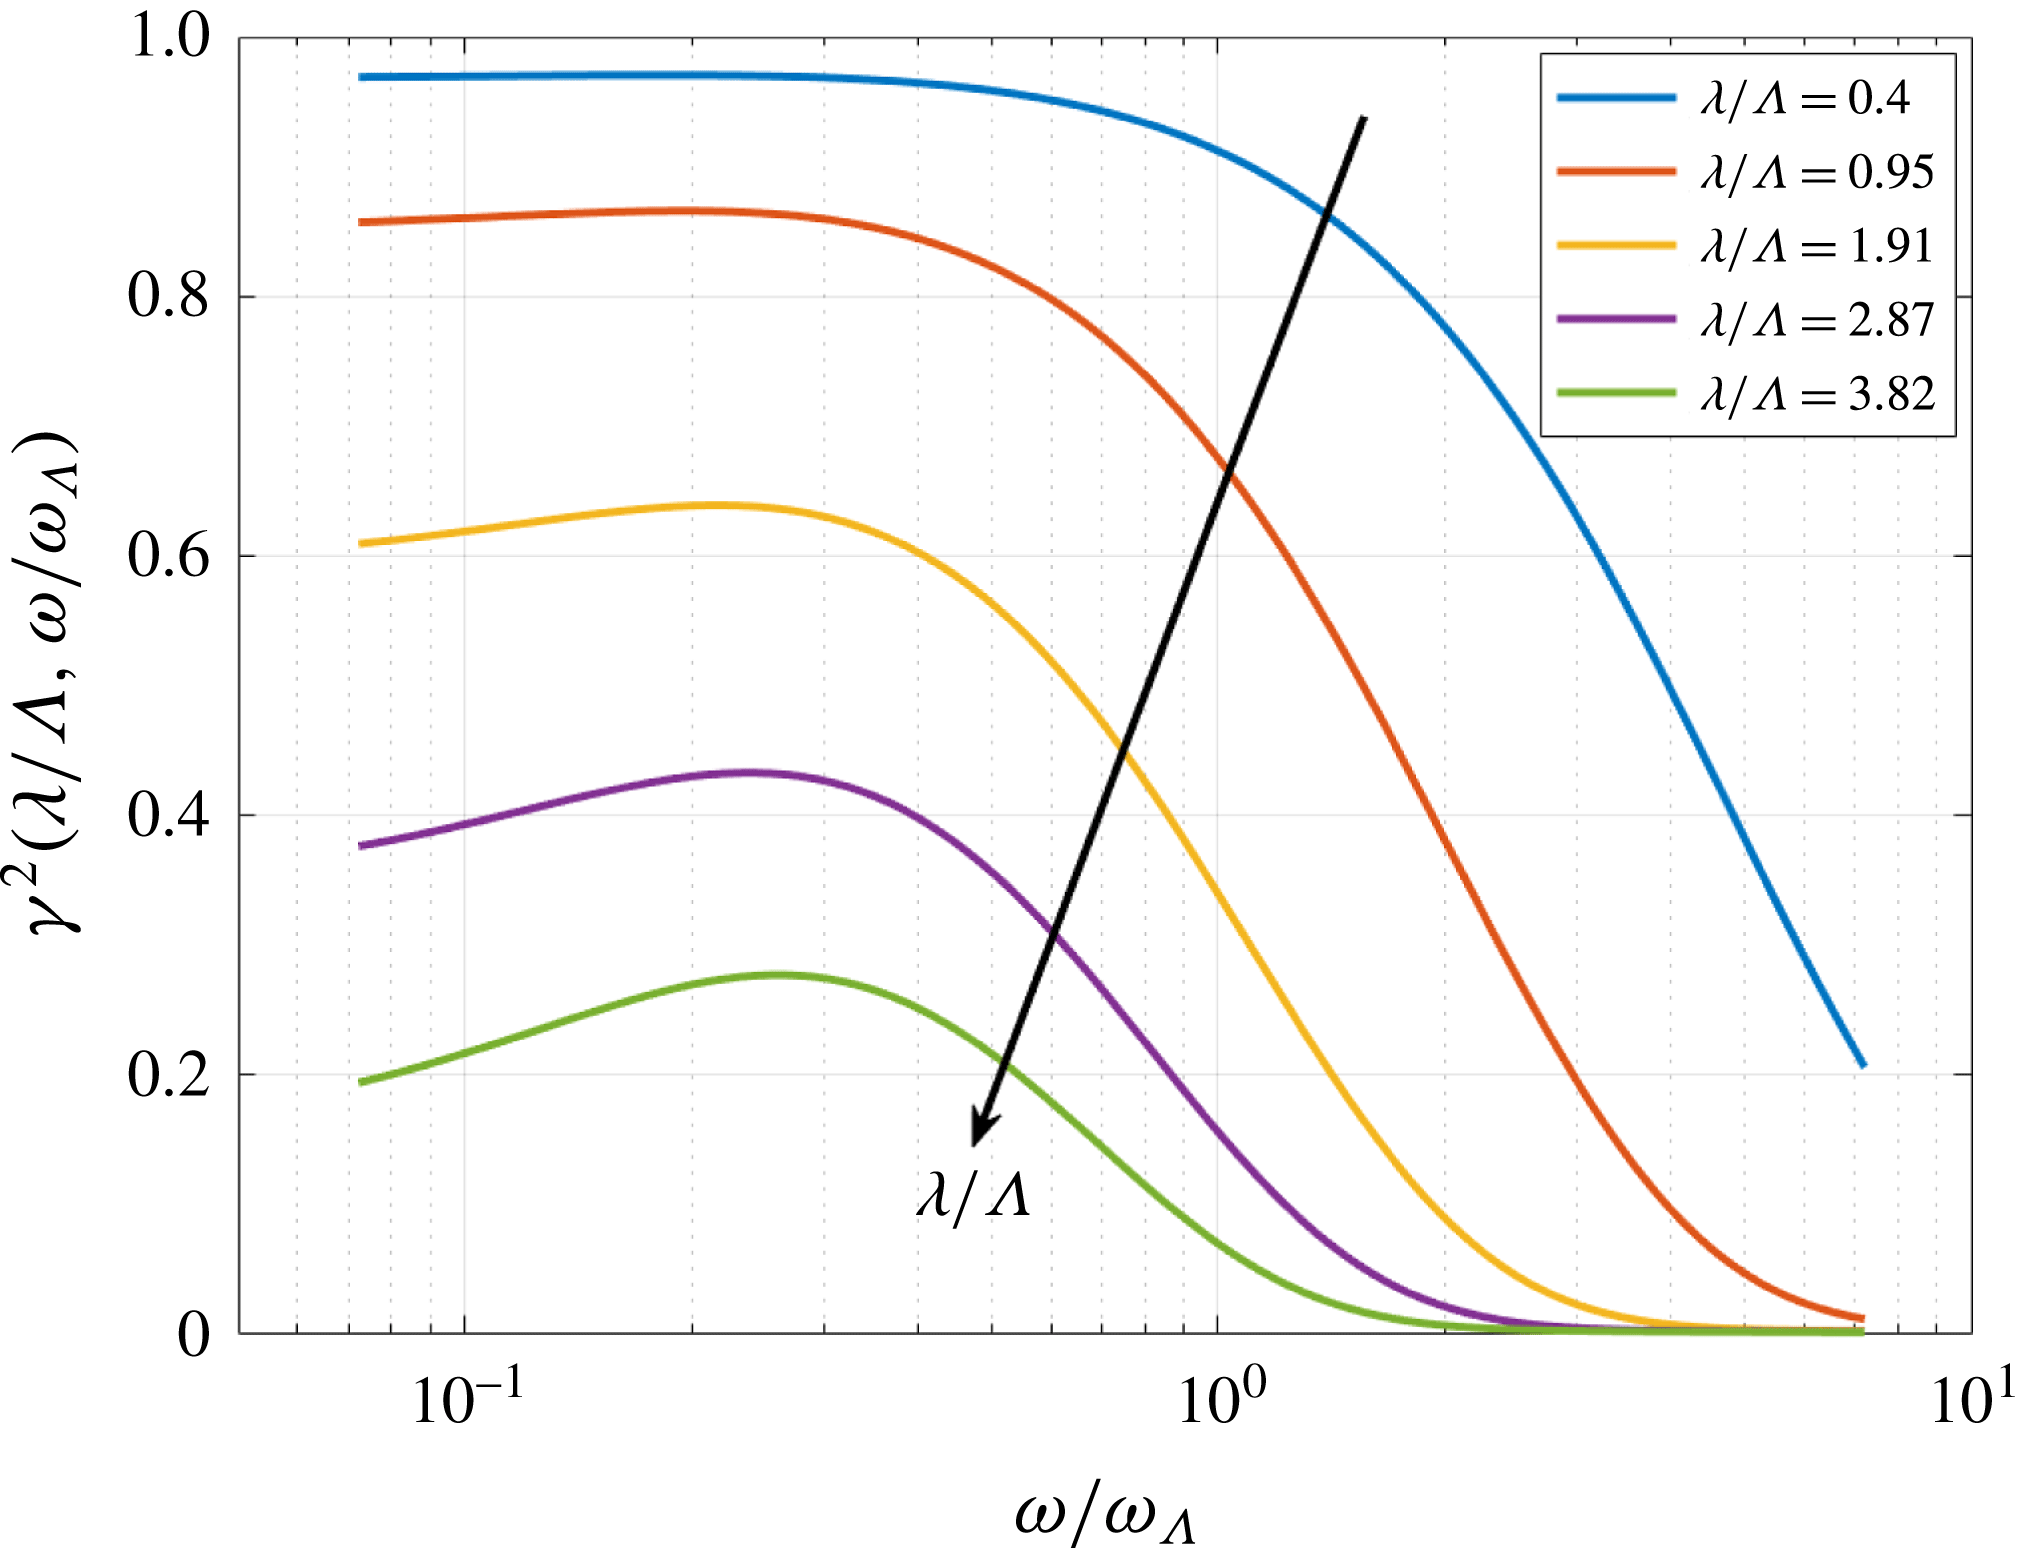
Central to the effectiveness of this double-wavelength serration design is the behaviour of the spanwise coherence function close to the leading edge. This has been evaluated from (6.2) to (6.7) using the von Kármán wavenumber velocity spectra
 $\unicode[STIX]{x1D6F7}_{ww}$
for isotropic turbulence given by
 $$\begin{eqnarray}\unicode[STIX]{x1D719}_{ww}(k_{x},k_{y})=\frac{4}{9\unicode[STIX]{x03C0}}\frac{\bar{u^{2}}}{k_{e}^{2}}\frac{(k_{x}/k_{e})^{2}+(k_{y}/k_{e})^{2}}{((1+k_{x}/k_{e})^{2}+(k_{y}/k_{e})^{2})^{7/3}}\end{eqnarray}$$
and using the forms of the aerofoil response function
 $g$
presented by Mish (Reference Mish2003) for super-critical and sub-critical vortical gusts. Coherence predictions are made at 0.01
 $c_{0}$
from the leading edge at four values of
 $\unicode[STIX]{x1D706}/\unicode[STIX]{x1D6EC}$
varying between 0.95 and 3.82 chosen to match experimental values, where the integration over
 $k_{r}$
in (6.7) is taken over the range of values necessary to ensure convergence of the integral. The results are plotted versus
 $\unicode[STIX]{x1D714}/\unicode[STIX]{x1D714}_{\unicode[STIX]{x1D6EC}}$
in figure 9.
Variation of coherence for different spanwise separation distances
 $\unicode[STIX]{x1D706}/\unicode[STIX]{x1D6EC}$
.
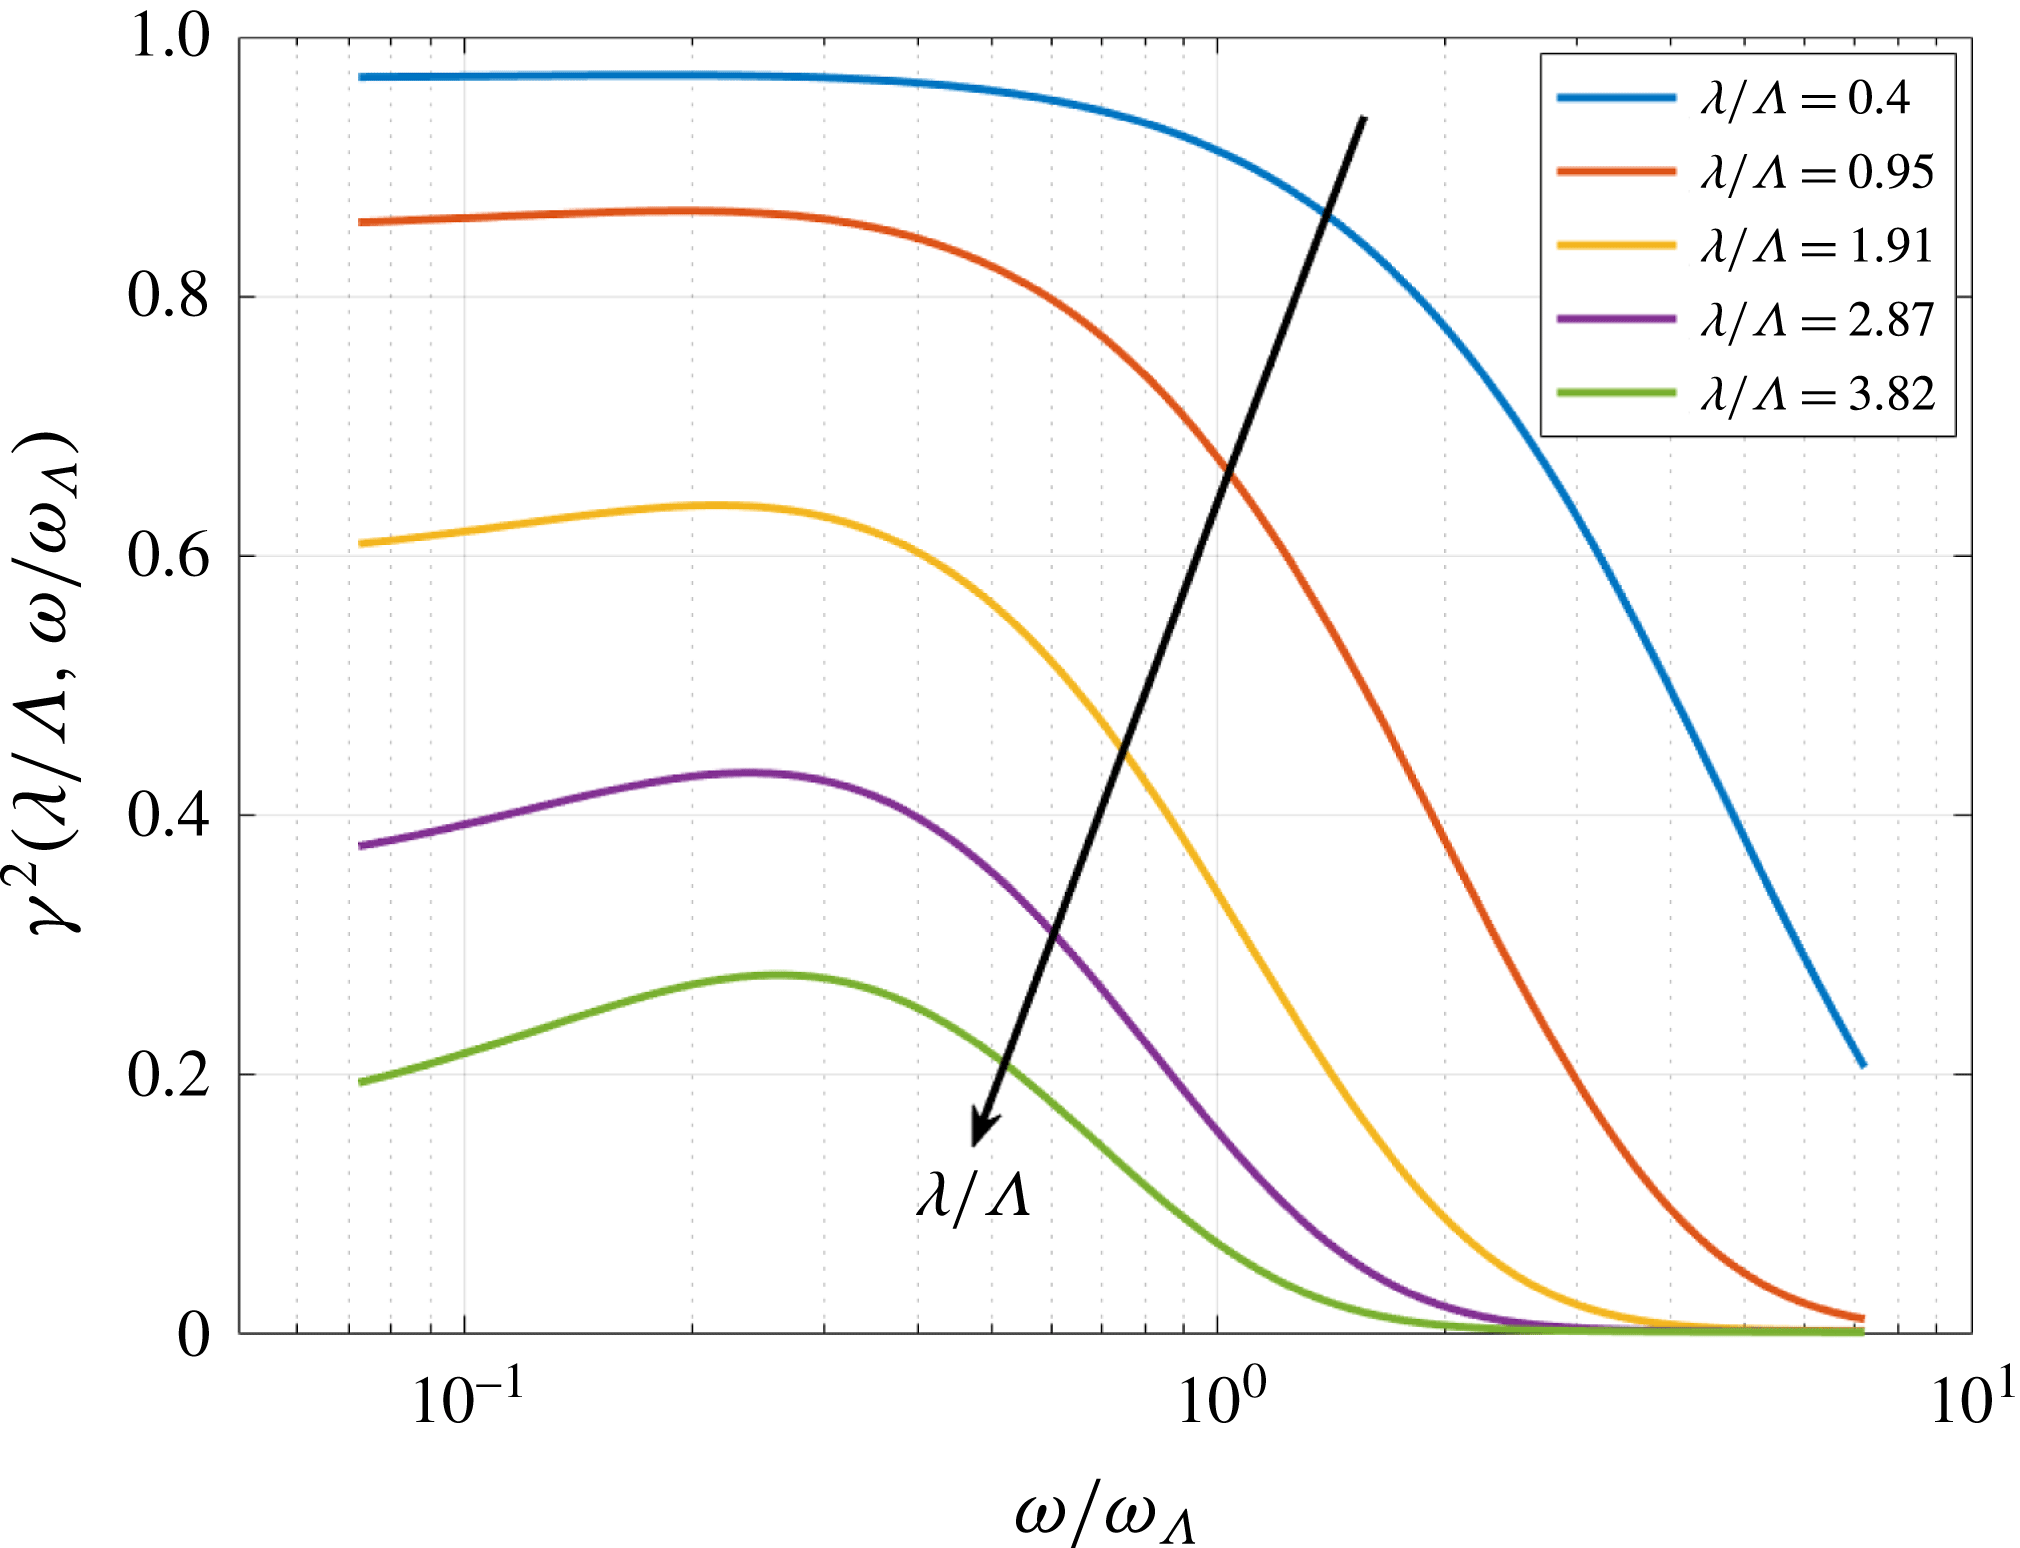
The spanwise surface pressure coherence function can be observed to be highly sensitive to separation distance relative to the turbulence length scale. Equation (6.9) suggests that at least 3 dB of additional noise reduction at the ‘tuned’ frequency
 $\unicode[STIX]{x1D714}_{0}$
is only possible when the coherence between adjacent roots is greater than 0.5. Figure 9 indicates that, for any given value of
 $\unicode[STIX]{x1D706}/\unicode[STIX]{x1D6EC}$
, this threshold value is only exceeded below a certain threshold frequency that depends strongly on the value of
 $\unicode[STIX]{x1D706}/\unicode[STIX]{x1D6EC}$
. For values of
 $\unicode[STIX]{x1D706}/\unicode[STIX]{x1D6EC}\geqslant 2.87$
, the coherence is less than 0.5 at all frequencies. These observations are entirely consistent with the additional noise reduction measured at the tuned frequency in figure 8.
In addition to the requirement for high coherence between adjacent root sources is the condition that adjacent roots sources are close to being
 $180^{\circ }$
out of phase. This requirement imposes a frequency bandwidth over which additional noise reductions are confined. Formally, the upper and lower frequency limits,
 $\unicode[STIX]{x1D714}_{1}$
and
 $\unicode[STIX]{x1D714}_{2}$
, either side of
 $\unicode[STIX]{x1D714}_{0}$
, at which an additional noise reduction of
 $10\log _{10}(\unicode[STIX]{x1D716})$
is obtained may be deduced from the two solutions of (6.9) either side of
 $\unicode[STIX]{x1D714}_{0}$
, which we express here in terms of the tuned frequency
 $\unicode[STIX]{x1D714}_{0}$
as
 $$\begin{eqnarray}\frac{\unicode[STIX]{x1D714}_{1,2}}{\unicode[STIX]{x1D714}_{0}}=\frac{1}{\unicode[STIX]{x03C0}}\cos ^{-1}\left(\frac{(1-\unicode[STIX]{x1D716})}{\unicode[STIX]{x1D716}}\frac{1}{\unicode[STIX]{x1D6FE}^{2}(\unicode[STIX]{x1D706}/\unicode[STIX]{x1D6EC},\unicode[STIX]{x1D714}_{1,2}/\unicode[STIX]{x1D714}_{\unicode[STIX]{x1D6EC}})}\right).\end{eqnarray}$$
The fundamental upper limit on the frequency bandwidth of 3 dB additional noise reduction is achieved as
 $\unicode[STIX]{x1D706}$
tends to zero and the coherence between adjacent root sources approaches unity. In this limit, the upper and lower frequencies are
 $\unicode[STIX]{x1D714}_{1}/\unicode[STIX]{x1D714}_{0}=2/3,\unicode[STIX]{x1D714}_{2}/\unicode[STIX]{x1D714}_{0}=4/3$
and therefore the upper limit on the frequency bandwidth
 $\unicode[STIX]{x0394}\unicode[STIX]{x1D714}_{3dB}$
at additional noise reduction
 $\unicode[STIX]{x0394}\text{PWL}_{I}=3~\text{dB}$
is given by
 $$\begin{eqnarray}\frac{\unicode[STIX]{x0394}\unicode[STIX]{x1D714}_{3dB}}{\unicode[STIX]{x1D714}_{0}}=\frac{2}{3}.\end{eqnarray}$$
The upper limiting frequency bandwidth is therefore proportional to the tuned frequency
 $\unicode[STIX]{x1D714}_{0}$
. Tuning to a low frequency, therefore, only produces noise reduction over a small frequency bandwidth in absolute terms.
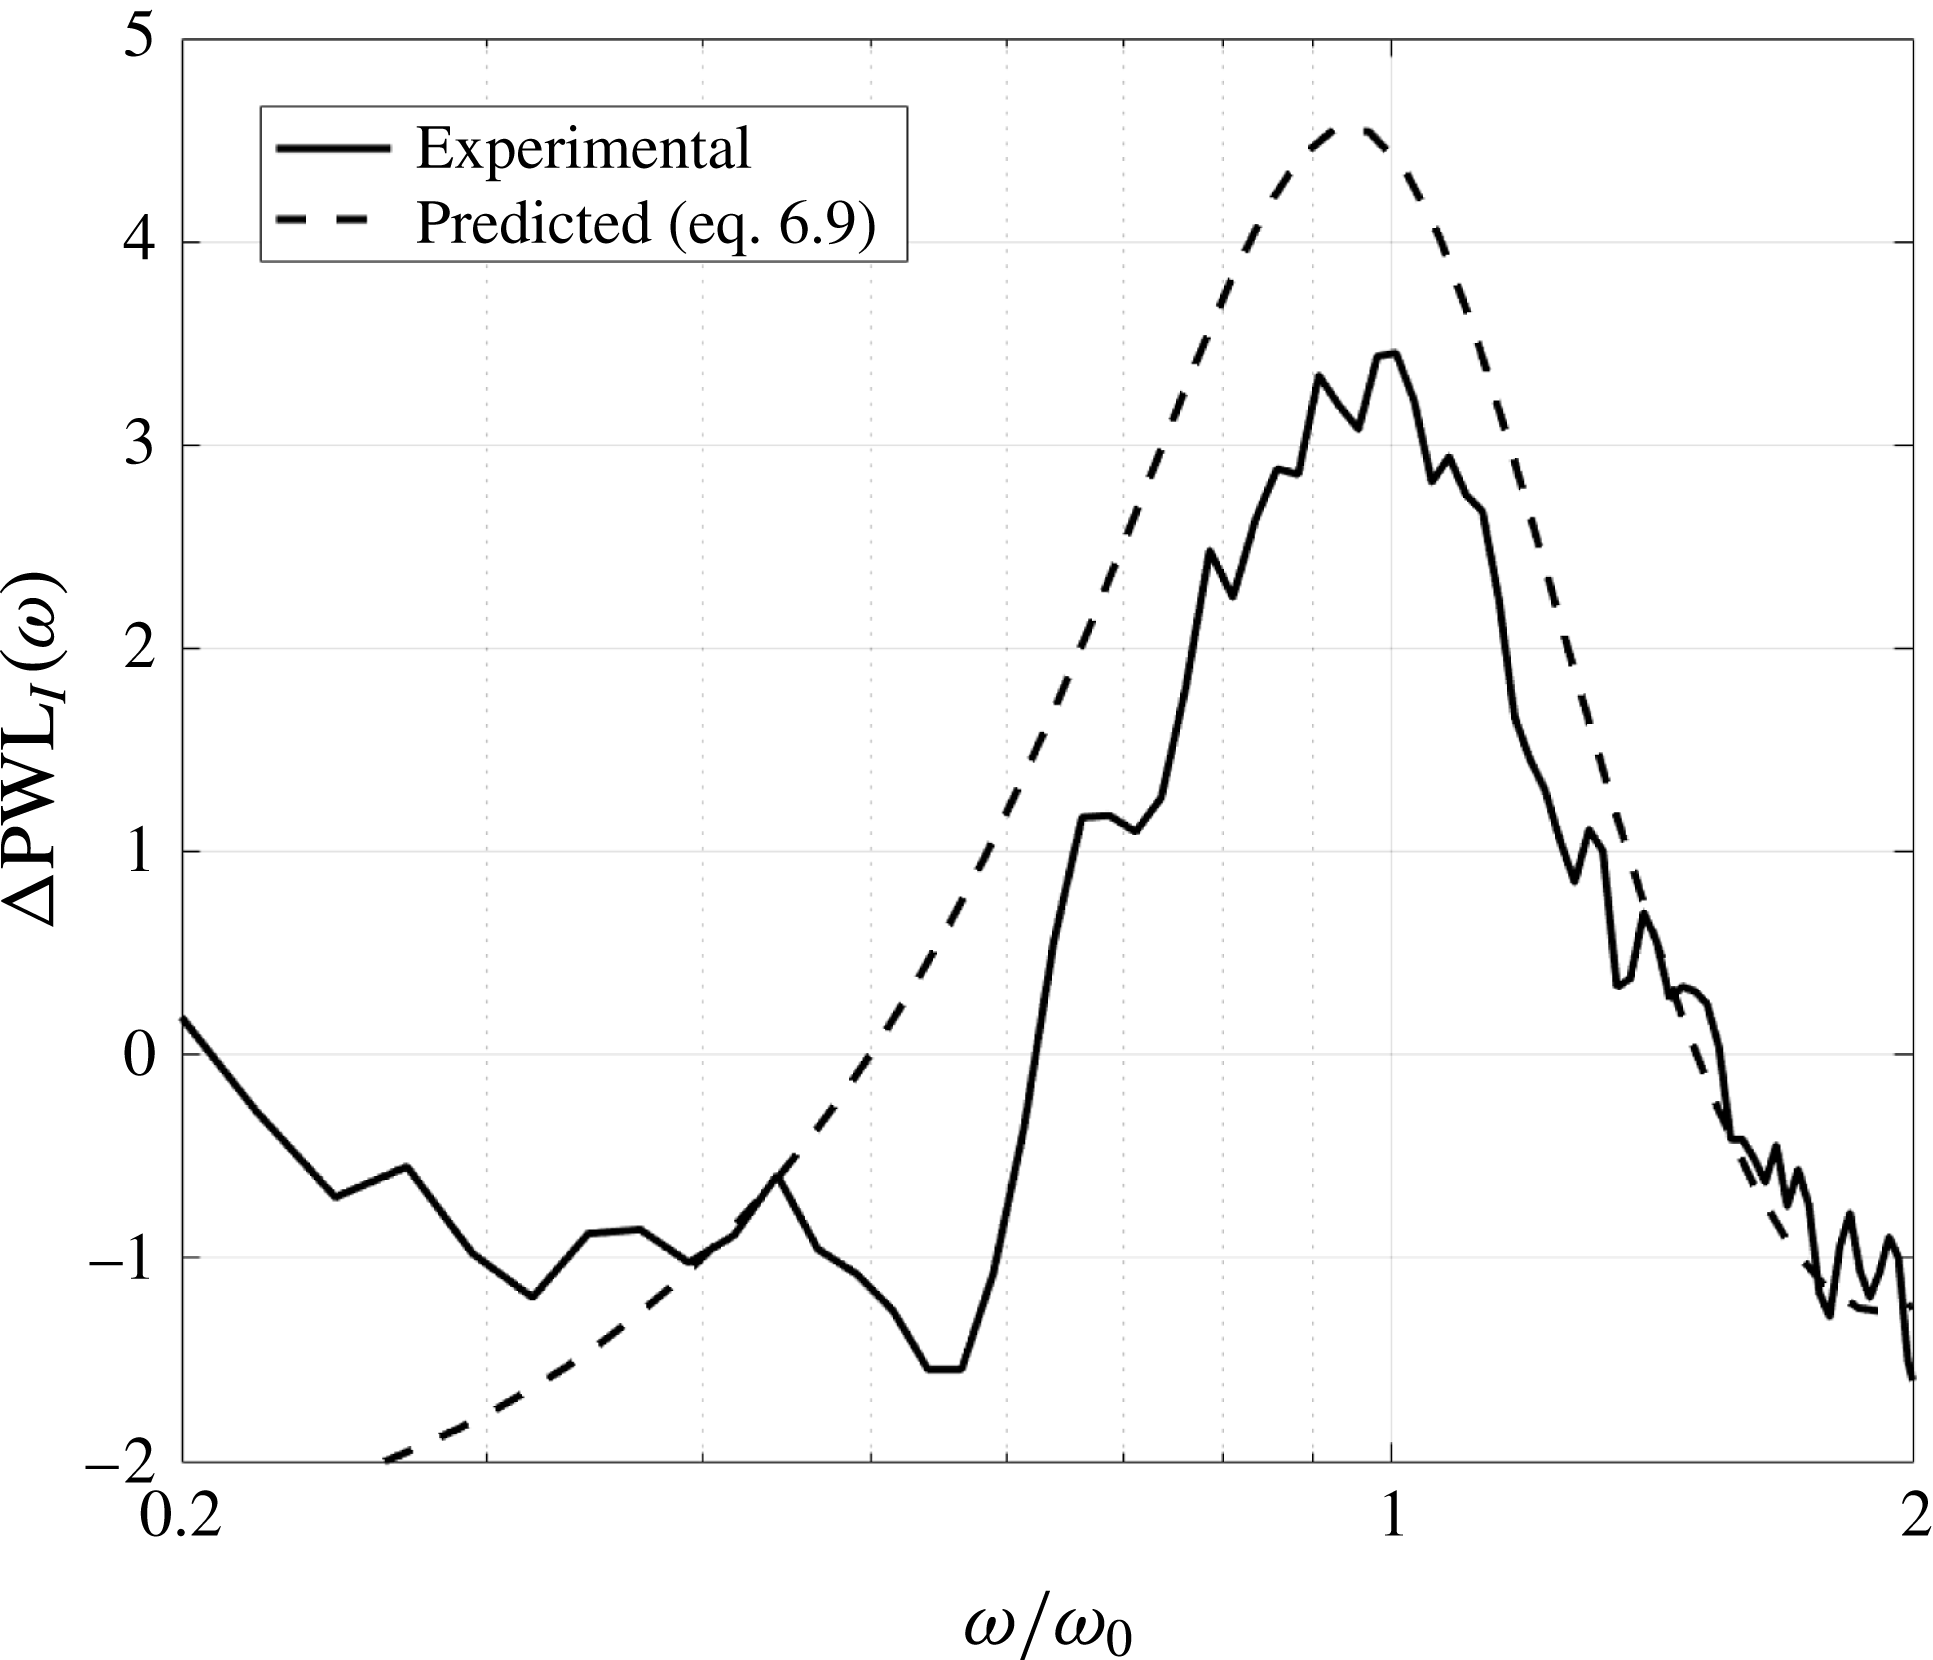
In order to assess the validity of the proposed mechanism for the additional noise reductions, equation (6.9) was compared against the measured additional noise reductions versus
 $\unicode[STIX]{x1D714}/\unicode[STIX]{x1D714}_{0}$
in figure 10 for the case of
 $\unicode[STIX]{x1D706}/\unicode[STIX]{x1D6EC}=0.95$
and
 $h/c_{0}=0.13$
with the coherence computed from (6.2) and (6.7).
The measured noise spectra were obtained by subtracting
 $10\log _{10}(fa/U)+10$
(for single-wavelength serrations) from the measured noise reduction spectra plotted in figure 10. A reasonably good comparison is observed between the measured and predicted noise reduction spectra. Note that to obtain matching of the peak noise reduction at
 $\unicode[STIX]{x1D714}=\unicode[STIX]{x1D714}_{0}$
the value of
 $h$
used to calculate
 $\unicode[STIX]{x1D714}_{0}$
to plot the experimental spectra was increased by 10 % to take into account the observation by Turner et al. (Reference Turner, Kim, Chaitanya and Joseph2016) that the root sources are located slightly further upstream of the exact root location. Nevertheless, this level of agreement proves unequivocally that the additional benefit of double-wavelength serrations is a result of interference between two compact sources located close to adjacent roots.
Comparison between measured and predicted additional noise reduction spectra (
 $\unicode[STIX]{x0394}\text{PWL}_{I}$
) for a double-wavelength serration with
 $\unicode[STIX]{x1D706}/\unicode[STIX]{x1D6EC}=0.95$
and
 $h/c_{0}=0.13$
. Predictions are based on coherence estimates from figure 9.

7 Self-similarity of double-wavelength serrations
The expressions above for the two components of noise reduction
 $\unicode[STIX]{x0394}\text{PWL}_{S}$
and
 $\unicode[STIX]{x0394}\text{PWL}_{I}$
can all be expressed in terms of the non-dimensional frequency
 $fL/U$
where
 $L$
takes the three characteristic lengths of
 $a$
,
 $h$
and
 $\unicode[STIX]{x1D6EC}$
. Overall noise reductions are therefore determined by the ratio of hydrodynamic wavelength
 $U/f$
to these three dimensions. Double-wavelength serrations for which these four dimensions are in constant ratio are therefore predicted to produce identical noise reductions. The noise reduction mechanism may therefore be regarded as self-similar in these four length scales.
An important consequence of this observation is that noise reductions obtained for a fixed geometry and integral length scale should be identical at all flow speeds when plotted against non-dimensional frequency
 $fL/U$
, where
 $L$
can be any of the length scales
 $a$
,
 $h$
and
 $\unicode[STIX]{x1D6EC}$
.
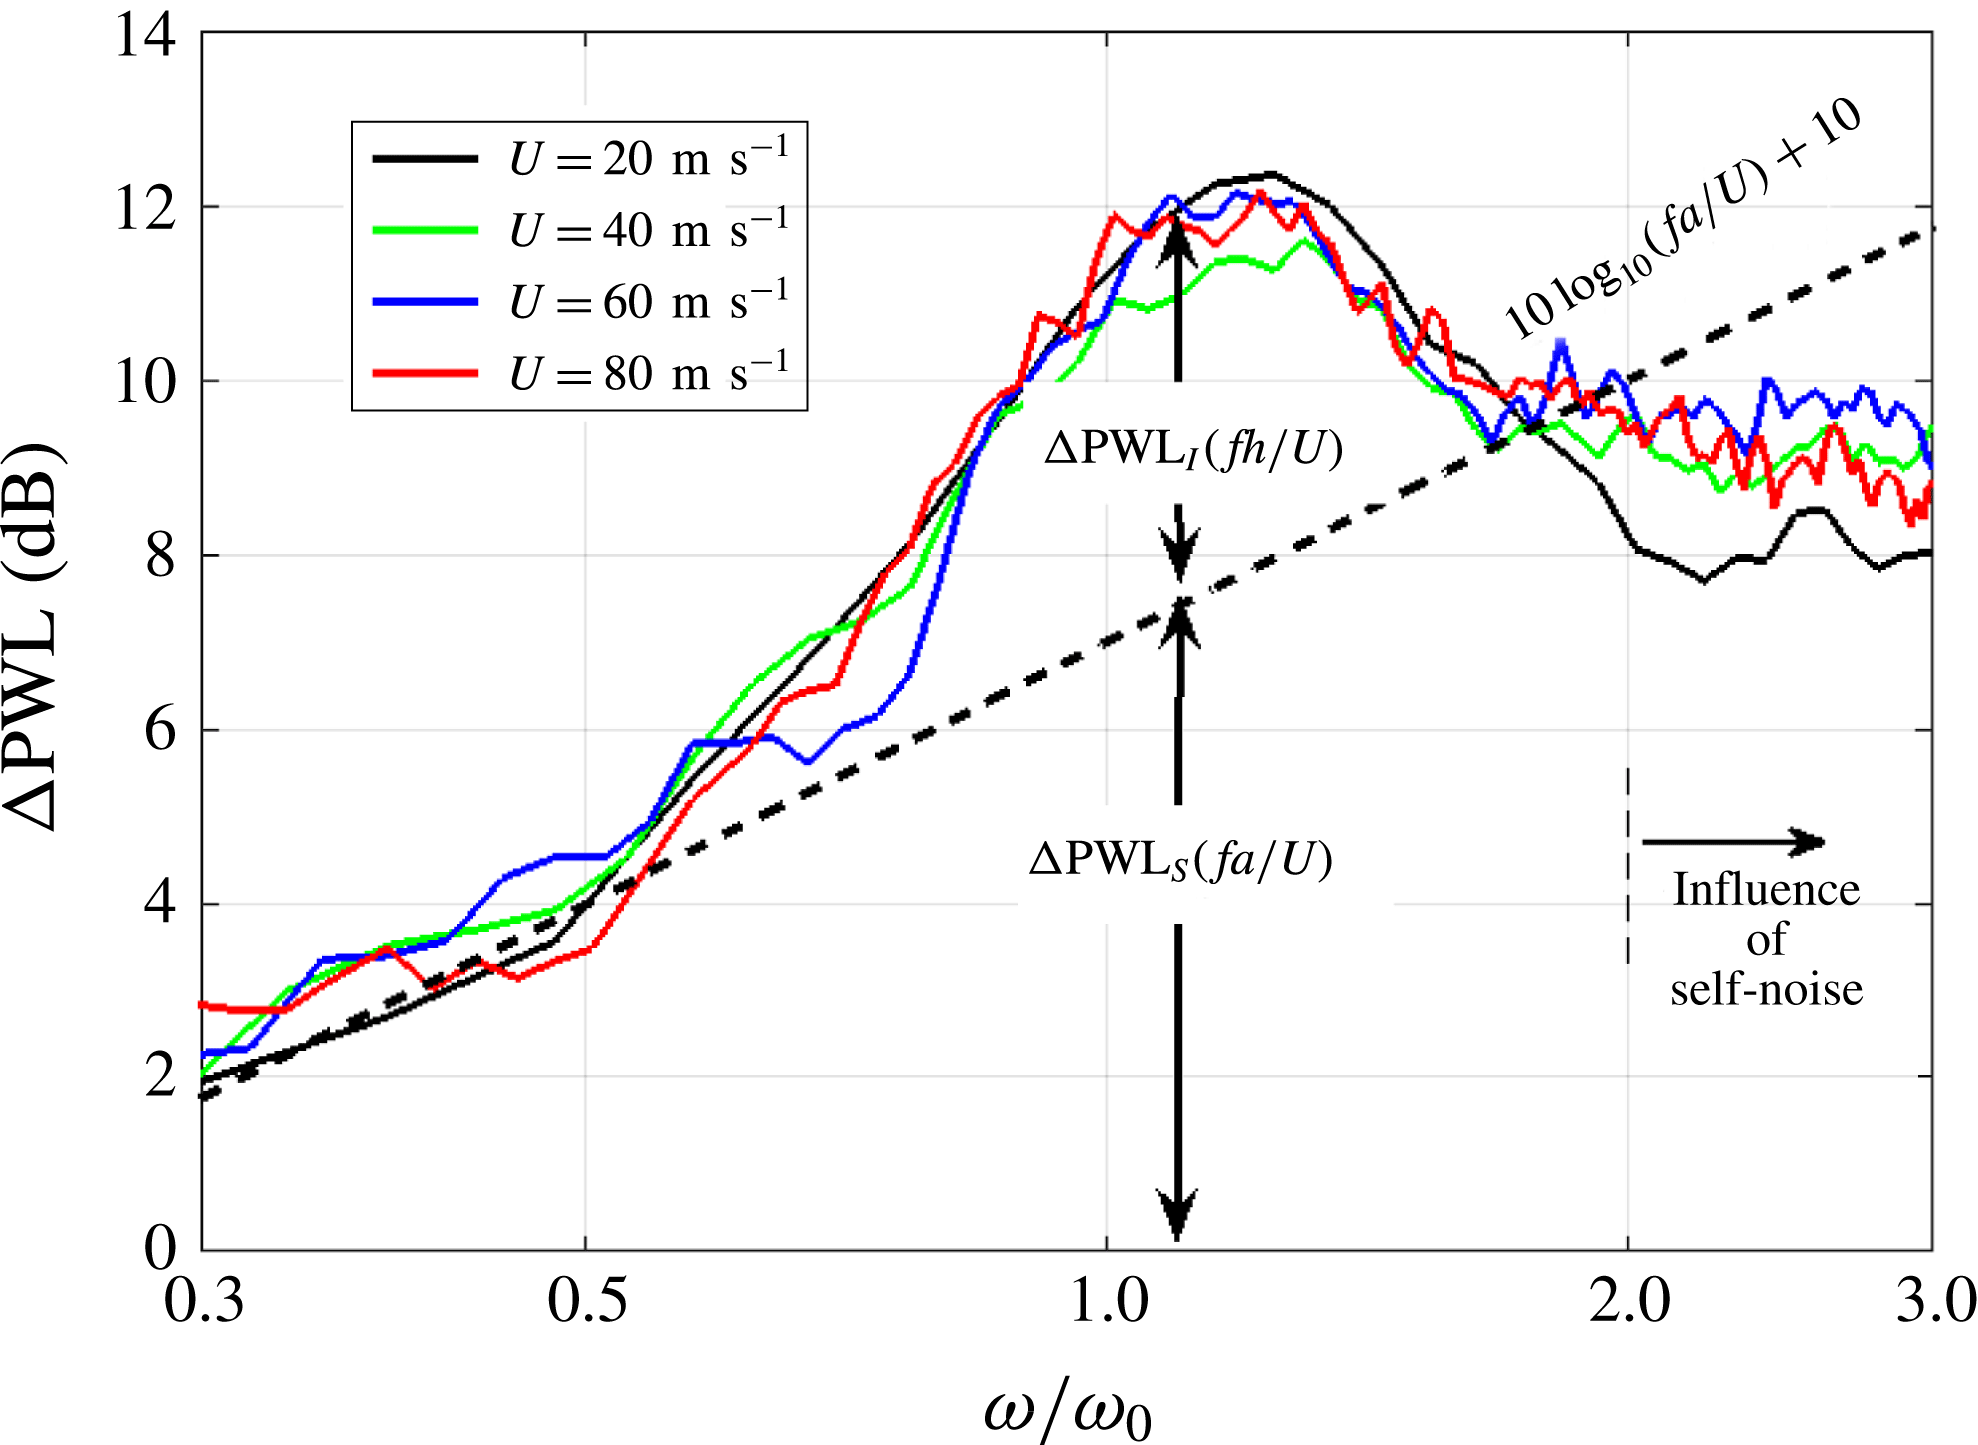
To confirm this prediction, the noise reduction spectra are shown in figure 11 plotted against
 $\unicode[STIX]{x1D714}/\unicode[STIX]{x1D714}_{0}$
, i.e. for
 $L=h$
, at the four different velocities
 $U$
of 20, 40, 60 and
 $80~\text{m}~\text{s}^{-1}$
for the typical double-serration wavelength example of
 $\unicode[STIX]{x1D706}/\unicode[STIX]{x1D6EC}=1.91$
and
 $h/c_{0}=0.13$
.
Influence of flow velocity on noise reduction due to double-wavelength serration profiles.
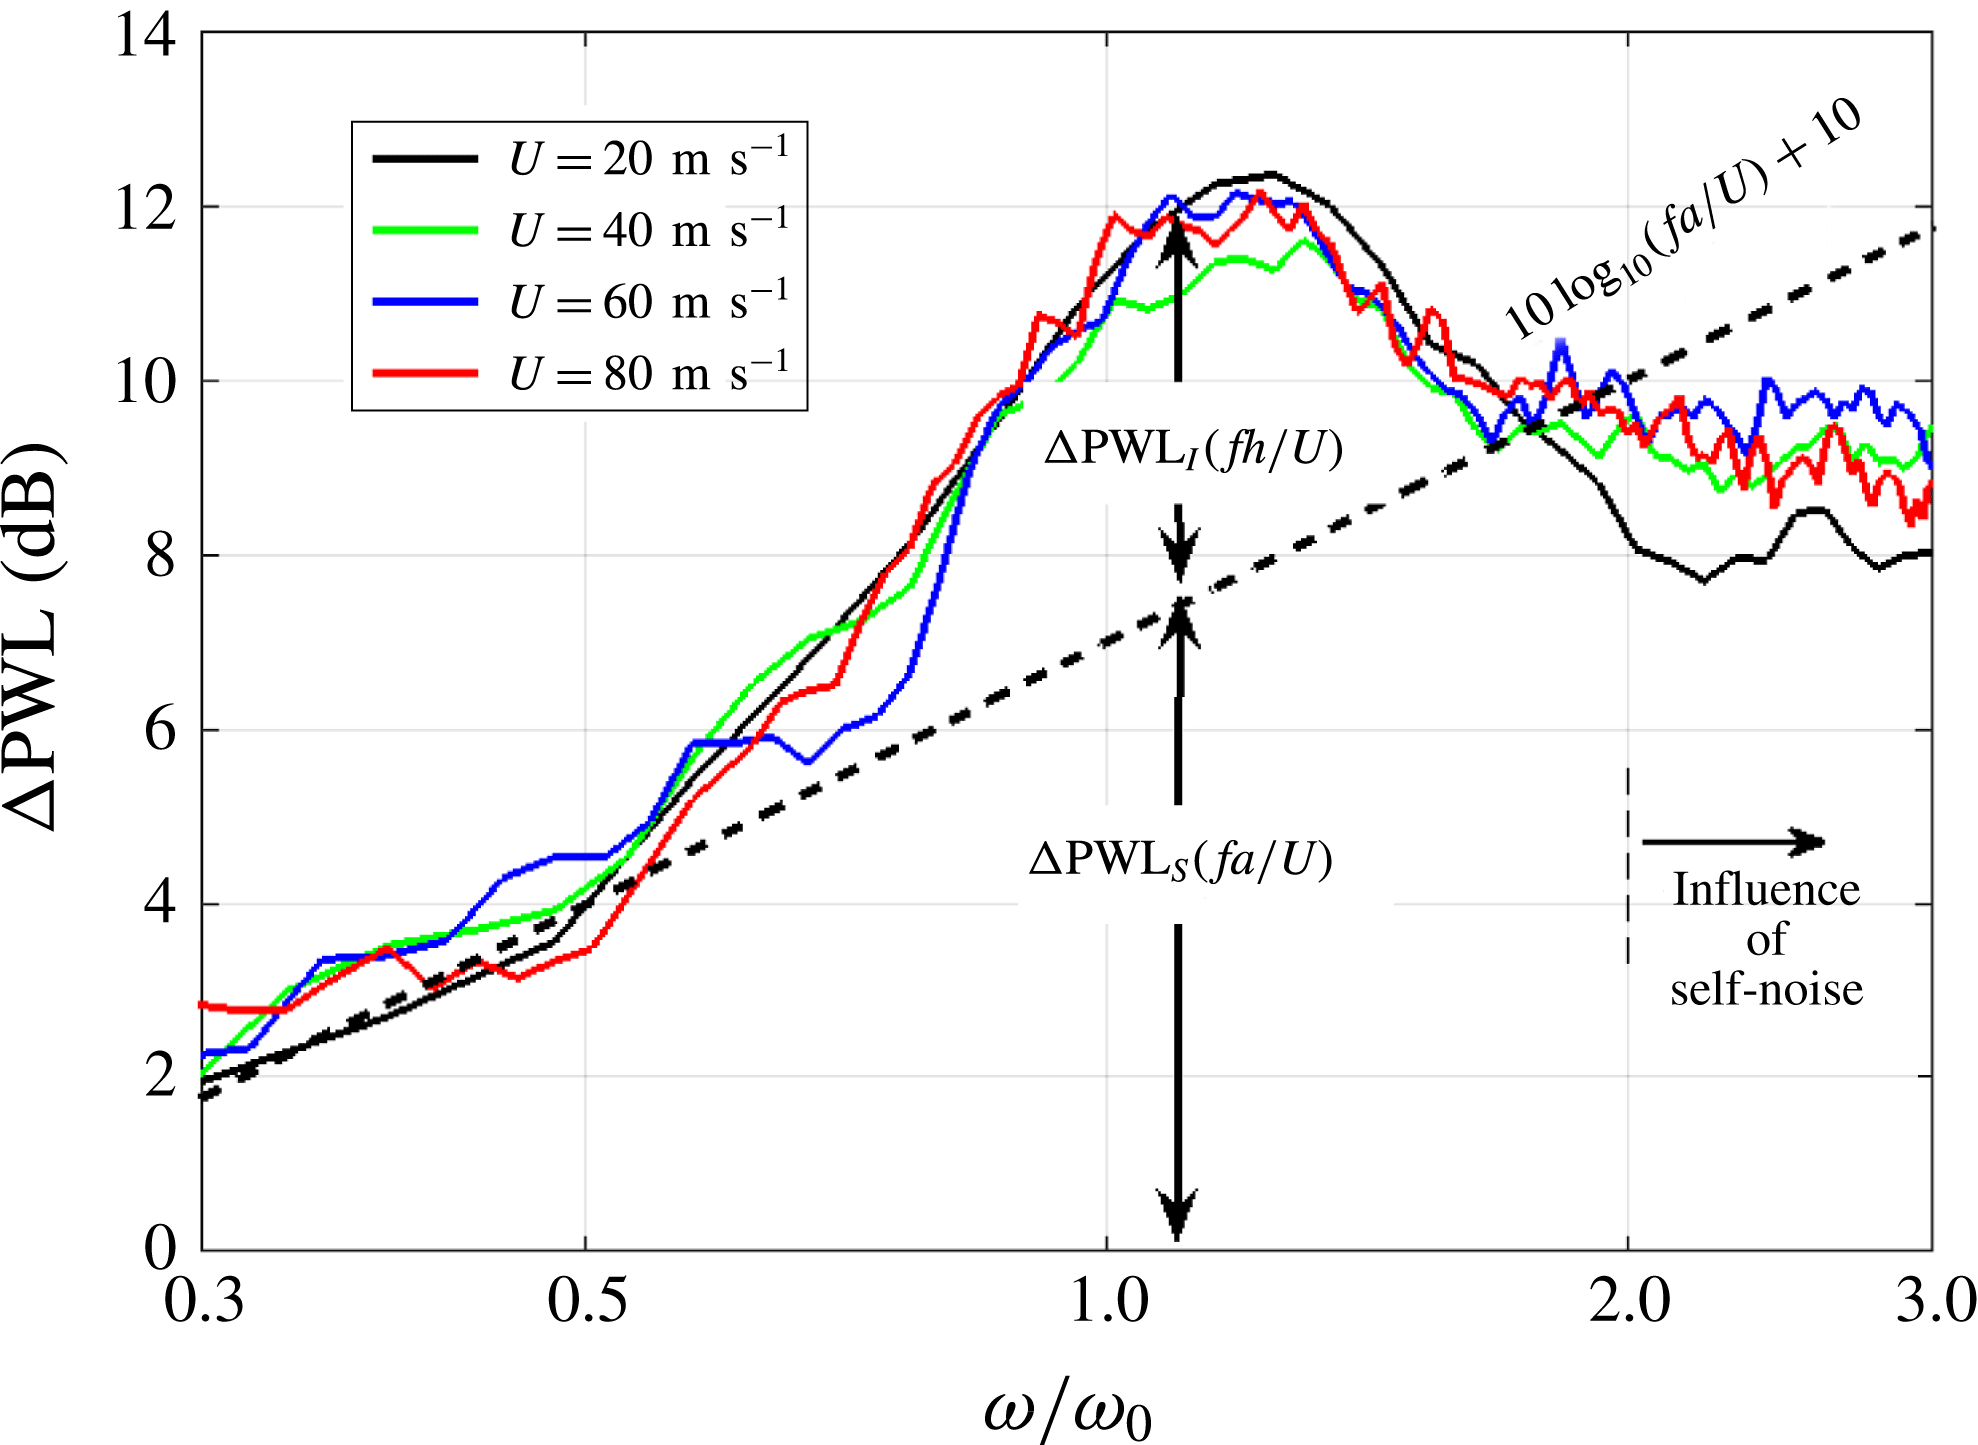
As predicted, the noise reduction spectra are almost identical to within 1 dB, with the greatest deviation being observed at the highest frequencies where self-noise starts to dominate.
8 Sound power spectra comparison for 3-D aerofoils
Finally, we validate the noise reduction principle established on flat plates in § 4 by applying it to the leading edge of a NACA65(12)-10 aerofoil with 10 % thickness, 150 mm mean chord and 450 mm span. Noise measurements were made on the aerofoil with a double-wavelength serration comprising two single wavelengths of (
 $\unicode[STIX]{x1D706}_{1}/c_{0}=0.067$
and
 $\unicode[STIX]{x1D706}_{2}/c_{0}=0.13$
) with zero phase difference. Summing these two single-wavelength components gives a total peak-to-root distance of
 $2a/c_{0}=0.33$
, and root-to-root spanwise and streamwise distances
 $\unicode[STIX]{x1D706}/c_{0}=0.059$
and
 $h/c_{0}=0.13$
respectively. In terms of the important non-dimensional ratios identified above, these distances correspond to
 $\unicode[STIX]{x1D706}/\unicode[STIX]{x1D6EC}=1.91$
,
 $\unicode[STIX]{x1D714}_{0}/\unicode[STIX]{x1D714}_{\unicode[STIX]{x1D6EC}}\approx 1$
, where the tuned frequency
 $\unicode[STIX]{x1D714}_{0}$
corresponds to 1530 Hz at the flow speed of the measurement
 $U=60~\text{m}~\text{s}^{-1}$
. Also measured for comparison were the noise reductions for the two single-wavelength serrations of the same peak-to-root amplitude
 $2a$
together with the baseline (un-serrated) aerofoil. All aerofoils were fabricated using a 3-D printer, which provides smooth surface finish.
The serrated aerofoils are defined such that if
 $y(X)=f(X)$
defines the NACA65 aerofoil profile, where
 $X=0$
represents the trailing edge and
 $X=1$
the leading edge, the profile
 $y(x,r)$
at any spanwise position
 $r$
along the aerofoil is given by
 $$\begin{eqnarray}y(x,r)=\left\{\begin{array}{@{}ll@{}}f(x/c_{0}),\quad & 0<x/c_{0}<2/3,\\ f(x/c(r)),\quad & 2/3<x/c(r)<1,\end{array}\right.\end{eqnarray}$$
where the chord is a function of span
 $r$
, i.e.
 $c(r)=c_{0}+h_{eff}\sin (2\unicode[STIX]{x03C0}r/\unicode[STIX]{x1D706}_{1})+h_{eff}\sin (2\unicode[STIX]{x03C0}r/\unicode[STIX]{x1D706}_{2})$
and
 $x$
varies between 0 at the trailing edge and
 $x=c(r)$
at the leading edge. The total peak-to-root distance of
 $2a$
is maintained by adjusting
 $h_{eff}$
.
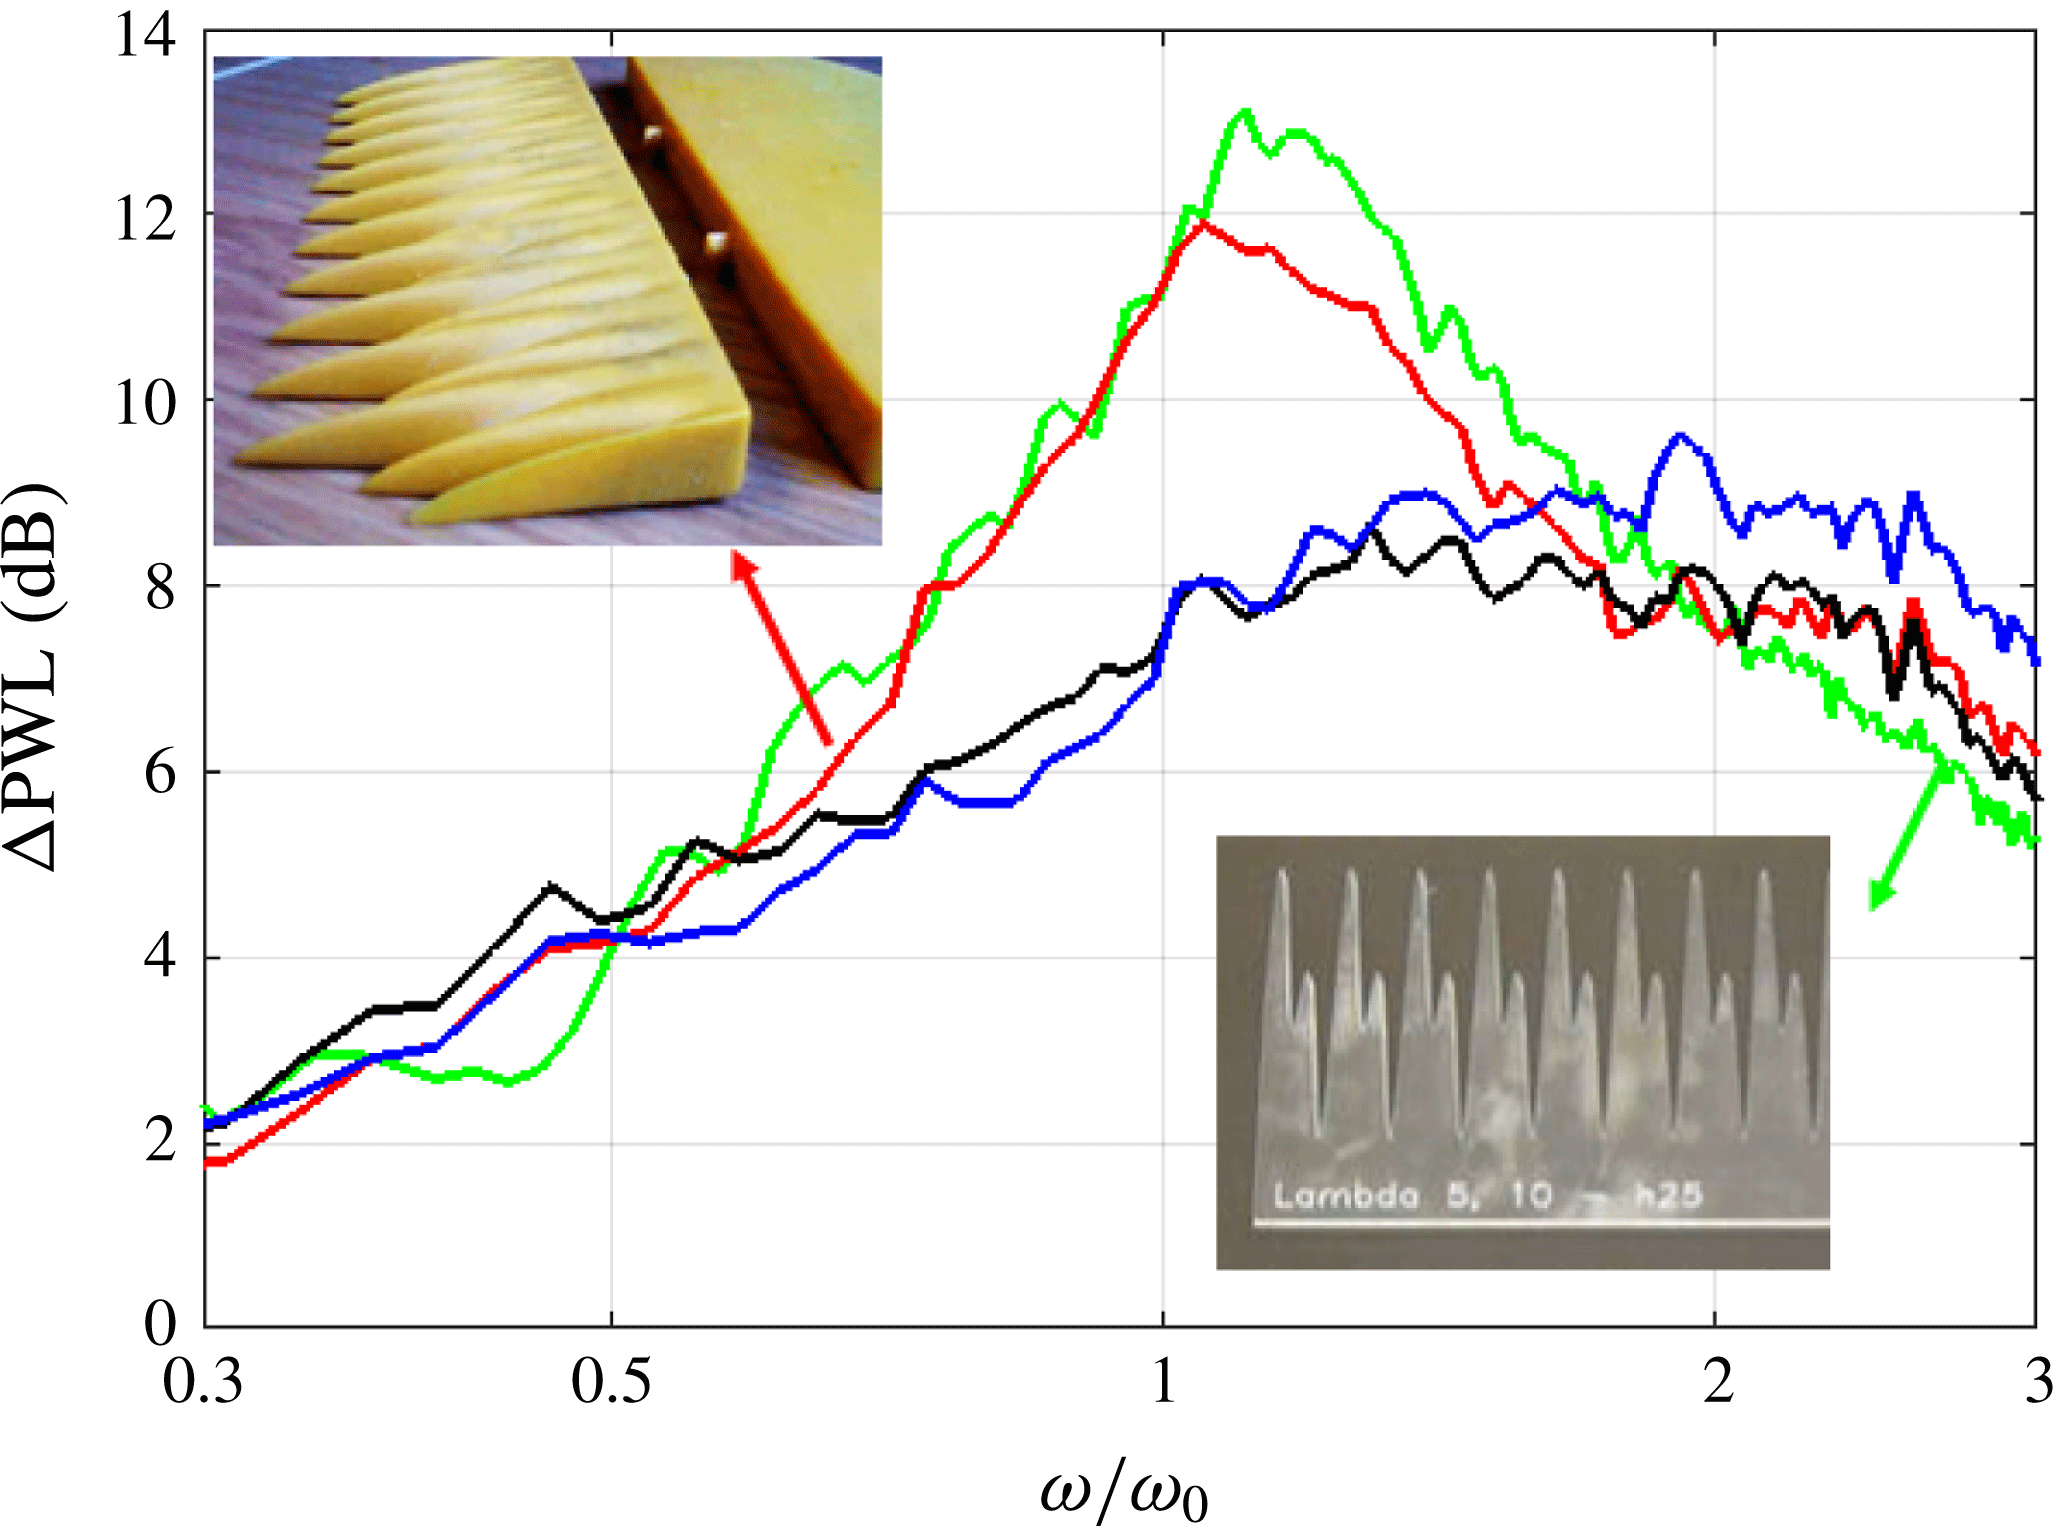
Total sound power reductions level (
 $\unicode[STIX]{x0394}\text{PWL}$
) for single- and double-wavelength serrations on 3-D aerofoils of
 $\unicode[STIX]{x1D706}_{1}/c_{0}=0.067$
and
 $\unicode[STIX]{x1D706}_{2}/c_{0}=0.13$
,
 $\unicode[STIX]{x1D706}/\unicode[STIX]{x1D6EC}=1.91$
,
 $2a/c_{0}=0.33$
,
 $U=60~\text{m}~\text{s}^{-1}$
(blue, single wavelength,
 $\unicode[STIX]{x1D706}_{1}$
(aerofoil); black, single wavelength,
 $\unicode[STIX]{x1D706}_{2}$
(aerofoil); red, double wavelength (aerofoil); green, double wavelength (flat plate)).

Figure 12 shows the comparison of the sound power reduction spectra between the two single-wavelength serrations and the double-wavelength serration when introduced onto the aerofoil and also on a flat plate. Differences between the respective spectra for the aerofoil and a flat plate are typically approximately 1 dB, confirming that the flat plate encapsulates the same physical principles as the 3-D aerofoil. Furthermore, it confirms the validity of the new noise reduction principle on relatively thick aerofoil geometries.
9 Conclusion
A new noise control principle has been developed and validated for the reduction of broadband interaction noise on aerofoils. The new control method is capable of providing substantially better noise reduction than the maximum noise reduction achievable on single-wavelength serration geometries. A simple analytic model is proposed to explain the additional noise reduction over and above that due to single-wavelength profiles. This additional noise reduction has been shown to depend on just the three non-dimensional factors of
 $\unicode[STIX]{x1D714}/\unicode[STIX]{x1D714}_{0}$
,
 $\unicode[STIX]{x1D714}/\unicode[STIX]{x1D714}_{\unicode[STIX]{x1D6EC}}$
and
 $\unicode[STIX]{x1D706}/\unicode[STIX]{x1D6EC}$
. In summary, therefore, the total noise reduction from the double-wavelength serration can be written as the sum of a reduction due to the source strength at the root and additional noise reductions due to interference between adjacent root sources:
 $$\begin{eqnarray}\unicode[STIX]{x0394}\text{PWL}(\unicode[STIX]{x1D714})=10\log _{10}(fa/U)-10\log _{10}(1+\unicode[STIX]{x1D6FE}^{2}(\unicode[STIX]{x1D706}/\unicode[STIX]{x1D6EC},\unicode[STIX]{x1D714}/\unicode[STIX]{x1D714}_{\unicode[STIX]{x1D6EC}})\cos (\unicode[STIX]{x03C0}\unicode[STIX]{x1D714}/\unicode[STIX]{x1D714}_{0}))+10.\end{eqnarray}$$
This paper has shown that double-wavelength serrations can be tuned to provide maximum noise reductions at any given frequency by an appropriate choice of streamwise distance between adjacent roots. Noise reductions are shown to be greatest when the coherence between adjacent root sources is highest over the frequency bandwidth over which adjacent root sources are close to being
 $180^{\circ }$
out of phase. To achieve at least 3 dB of additional noise reductions in this bandwidth, coherence values are required to be sufficiently high, which can be achieved when the spanwise separation distance between adjacent roots is less than twice the turbulence integral length scale.
Further work is needed to establish the aerodynamic performance of such leading-edge geometries. However there is no reason to believe that these profiles will perform any worse than single-wavelength serrations whose aerodynamic performance has been shown to be only marginally worse than a non-serrated aerofoil. These profiles also pose a challenge to structural engineers to ensure that there is no reduction in structural integrity due to stress concentrations at the roots. This work opens up the possibility of research into the development of a new family of leading-edge profiles based on the same noise reduction principle of destructive interference between dominant compact sources distributed over the leading edge (e.g. Chaitanya et al. Reference Chaitanya, Narayanan, Joseph and Kim2016; Ayton & Chaitanya Reference Ayton and Chaitanya2018; Chaitanya & Joseph Reference Chaitanya and Joseph2018; Chaitanya et al. Reference Chaitanya, Joseph and Ayton2018).
Acknowledgements
This work was partly supported by the EPSRC (EP/J007633/1) and by Innovate UK, HARMONY Programme (GA no. 101367). Rolls-Royce plc is also acknowledged for the financial and technical support given. We give thanks to Mr J. Turner and Mr A. Proenca at the University of Southampton for their valuable discussions on simulations and hot-wire measurements. All data supporting this study are openly available from the University of Southampton repository at doi:10.5258/SOTON/D0599.
Appendix A
In this appendix the expressions for the spatial correlation and one-dimensional frequency spectrum for homogeneous and isotropic turbulence are summarized. From Hinze (Reference Hinze1975), the theoretical von Kármán interpolation functions for the longitudinal (streamwise)
 $\unicode[STIX]{x1D70C}_{uu}(\unicode[STIX]{x0394}x,0,0)$
and transverse (spanwise and blade-normal) streamwise velocity correlation functions
 $\unicode[STIX]{x1D70C}_{uu}(0,\unicode[STIX]{x0394}r,0)$
and
 $\unicode[STIX]{x1D70C}_{uu}(0,0,\unicode[STIX]{x0394}z)$
are given by
 $$\begin{eqnarray}\displaystyle & \displaystyle \unicode[STIX]{x1D70C}_{uu}(\unicode[STIX]{x0394}x,0,0)=\frac{2^{2/3}}{\unicode[STIX]{x1D6E4}(\frac{1}{3})}(k_{e}\unicode[STIX]{x0394}x)^{1/3}K_{1/3}(k_{e}\unicode[STIX]{x0394}x), & \displaystyle\end{eqnarray}$$
 $$\begin{eqnarray}\displaystyle & \displaystyle \unicode[STIX]{x1D70C}_{uu}(0,\unicode[STIX]{x0394}r,0)=\frac{2^{2/3}}{\unicode[STIX]{x1D6E4}(\frac{1}{3})}(k_{e}\unicode[STIX]{x0394}x)^{1/3}\left[K_{1/3}(k_{e}\unicode[STIX]{x0394}r)-\frac{k_{e}\unicode[STIX]{x0394}r}{2}K_{-2/3}(k_{e}\unicode[STIX]{x0394}x)\right], & \displaystyle\end{eqnarray}$$
where
 $k_{e}=(\sqrt{\unicode[STIX]{x03C0}}/\unicode[STIX]{x1D6EC}_{uu}(\unicode[STIX]{x0394}x))(\unicode[STIX]{x1D6E4}(5/6)/\unicode[STIX]{x1D6E4}(1/3))$
.
The integral length scale in the streamwise direction can be calculated from the correlation function of (A 1) as
 $$\begin{eqnarray}\unicode[STIX]{x1D6EC}_{uu}=\int _{0}^{\infty }\unicode[STIX]{x1D70C}_{uu}(\unicode[STIX]{x0394}x,0,0)\,\text{d}(\unicode[STIX]{x0394}x).\end{eqnarray}$$
The value of the mean square velocity
 $\bar{u^{2}}$
and turbulence length scale
 $\unicode[STIX]{x1D6EC}_{uu}$
obtained by integrating the correlation function was verified by using these values in the theoretical von Kármán streamwise velocity spectrum
 $$\begin{eqnarray}S_{uu}(k_{x})=\frac{\bar{u^{2}}\unicode[STIX]{x1D6EC}_{uu}}{\unicode[STIX]{x03C0}U}\frac{1}{(1+(k_{x}/k_{e})^{2})^{5/6}},\end{eqnarray}$$
where
 $k_{x}=\unicode[STIX]{x1D714}/U$
, and comparing with the measured spectrum.
In this paper, the estimated turbulence quantities
 $\bar{u^{2}}$
and
 $\unicode[STIX]{x1D6EC}_{uu}$
are used to estimate the upwash velocity spectrum
 $S_{ww}$
given by
 $$\begin{eqnarray}S_{ww}(k_{x})=\frac{\bar{u^{2}}\unicode[STIX]{x1D6EC}_{uu}}{6\unicode[STIX]{x03C0}U}\frac{3+8(k_{x}/k_{e})^{2}}{(1+(k_{x}/k_{e})^{2})^{11/6}}\end{eqnarray}$$
to predict the radiated noise from a flat plate interacting with isotropic turbulence using the theory due to Amiet (Amiet Reference Amiet1975; Moreau & Roger Reference Moreau and Roger2007; Roger & Moreau Reference Roger and Moreau2010).