

1. Introduction: why study the skill premium?
Relative prices are the DNA of an economy. They are basic units of information that both reflect and define its structural features. They tell us about relative scarcities, and are the incentives that guide economic behaviour. In particular in the period before the mid nineteenth century, when other sources of information (such as historical national accounts) are relatively difficult to acquire and subject to large margins of error, relative prices and wages are crucial sources of information about the structure of the economy and its level of development.
The study of relative prices should therefore allow us to understand more fully the backgrounds and the dynamics of western Europe in the centuries before the Industrial Revolution. A team of scholars led by Peter Lindert has recently been working together to find out if the study of relative prices and wages can contribute to the discussion about the ‘Great Divergence’. The first and highly preliminary results of the ‘global history of prices and incomes’ presented in Buenos Aires in 2002 suggested that during the early modern period the structure of relative prices in north-western Europe was already distinctive. The paper hypothesised that capital goods and knowledge-intensive products were relatively cheap in this part of the world, and, linked to that, interest rates were relatively low, whereas agricultural products and foodstuffs (and land) were relatively expensive there.Footnote 1 So perhaps from the late medieval period onwards, western Europe had a comparative advantage in ‘high tech’ products and was characterised by a well-developed capital market.
This article investigates one aspect of this hypothesis, namely concerning the remuneration of human capital. It tries to test the Lindert et al. idea that northwest Europe had a comparative advantage in knowledge-intensive sectors by looking at the long-term development of the skill premium in Europe and the most developed parts of Asia. It takes a rather limited look at this skill premium by focusing on the difference in daily wages between skilled craftsmen (carpenters and masons) and unskilled labourers in the construction industry, a skill premium about which we are relatively well informed (but some additional information on the skill premium in other trades is discussed as well). Moreover, it also attempts to explain the patterns found by focusing on a number of factors that explain the level of the skill premium, such as interest rates (reflecting factor endowments), the efficiency of training institutions (such as guilds) and demand-related factors in relation to the flexibility of supply. These factors help to explain the ‘Great Divergence’ between the West and the East that can be observed, although, significantly, southern China and Japan differ from the rest of Asia.
Why study the relative wages of carpenters and masons – apart from the obvious reason that we know quite a lot about the remuneration of these specific professions? One advantage of the construction industry is that technological change was relatively slow, implying that the skills acquired by those craftsmen did not change much over time, and were also more or less identical in different regions of the world (although some variation did occur, of course).Footnote 2 It can also be argued that carpenters and masons possessed very strategic skills. They were the builders and often also the designers of capital goods – of houses, mills, ships, carts and a large variety of other constructions made of wood and stone.Footnote 3 The relative price of their skills must therefore have affected the relative price of capital goods, and thus the profitability of investment. Moreover, it will be argued that studying this segment of the labour market can lead to insights into the conditions for human capital formation in the economy as a whole, and that the skill premium of construction workers can be used to develop and test ideas about the factor endowments and the relative efficiency of institutions in general. Finally, the construction industry was in large parts of Europe organised in guilds. It has been argued in the past that the European guilds played a pernicious role in economic development, because they tried to monopolise markets and limit the entry to the profession they controlled. More recently, their role has been reassessed, and they are now being seen by many scholars as relatively efficient ways of collectively managing the skills of a profession and transferring this human capital to following generations.Footnote 4 If the critics of the guild system are right, one would expect the skill premium (the pay of master craftsmen relative to that of unskilled labourers) to be relatively high in regions and cities where guilds were strong, and low outside these regions.
2. Interpreting the skill premium
The determinants of the skill premium can best be understood within a simple supply and demand framework. According to standard economic theory the skill premium is the remuneration for investing in human capital, for example, for not earning an income during the period in which the apprentice was undergoing training and for other expenses related to the training period, such as the payment of fees to the master craftsman (or other supervisors) who trained the apprentice.Footnote 5 Therefore, seen from the supply side, the skill premium will in the long term be determined by (1) the costs of training (including the unearned income); (2) the chance that the apprentice will successfully finish his training period and will acquire a skilled job, which is related to possible institutional barriers to entry into the trade; (3) the interest rate linking the higher future earnings to the present (the lower the interest rate, the higher the net present value of the increased income resulting from the skill premium); and finally (4) the number of years the skilled worker can earn the higher wage (a demographic factor that we ignore here, as the societies that are under study do not have very different life expectancies). These factors determine the ‘costs’ of producing skilled workers (and the number of years over which these costs can be spread); when costs go down, one expects, other things remaining equal, a decline in the skill premium. The degree of segmentation of labour markets − do guilds, for example, restrict entry to the skilled jobs? – plays a role here as well.
Demand factors may also be important: economic development in combination with biased technological change usually leads to a growing demand for certain new skills (such as printers and compositors after the invention of the printing press in the 1450s), and to the displacement of old skills (such as those of the scribe in the same period). Tinbergen (Reference Tinbergen1975) saw these processes as a race between schooling and technology. Similarly, one can expect that in periods of rapid demographic growth the building trades will expand rapidly, leading to an increased demand for carpenters, masons and the like, and that in periods of population decline the opposite will happen. This will probably lead to a rising skill premium in the construction industry in periods of growth and a decline in periods of recession. The degree to which changes in demand will affect the skill premium will obviously also depend on the flexibility of supply.
It is not the aim of this article to model these supply and demand factors, but to try to understand the long-term changes and global patterns in the level of the skill premium within such a framework, and identify the main sources of long-run change. The focus on the analysis will be on supply-side factors, in particular the interest rate (which helps to explain much of the difference between western Europe and large parts of Asia), and on the institutions that regulate the training process, determine the costs of the training period and influence the barriers to entry into the trade. Moreover, by looking at the relationship between demographic growth and the skill premium, the effect of demand factors can also be taken into account, as well as the degree of flexibility of supply of skills in (southern and northwestern) Europe.
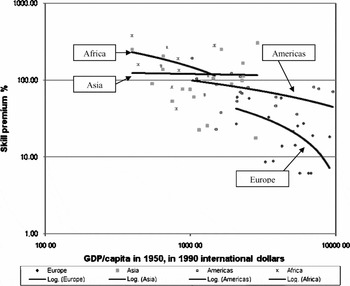
An important observation to start with is that, in general, economic development appears to result in a decline of skill premiums and the variability of wage rates. Only recently, since the 1970s or 1980s, do rising skill premiums and economic growth seem to move together, pointing to strong biases in technological change.Footnote 6 For England the negative link between skill premium and GDP per capita has, for example, been demonstrated by Clark (Reference Clark2007), and for the world economy in 1990 by Freeman and Oostendorp (Reference Freeman and Oostendorp2001), who used the data from the ILO October Census to reconstruct wage differentials in manufacturing, and found a strong negative correlation between different measures of the degree of variation in the wages paid (or in wage rates) and GDP per capita.Footnote 7 Similar data for about 1950 for the skill premium in construction can be derived from the same ILO dataset, showing a similar, tentative relationship with GDP per capita.Footnote 8Figure 1 shows that the skill premium ranged from almost 400 per cent in Ethiopia (GDP per capita less than 400 dollars) to 6 per cent in Denmark and Norway (with a GDP per capita of about 6,000 dollars). This suggests that the very partial measure of the skill premium used in this article – the difference between skilled and unskilled wages in construction – reflects the same kind of forces as the more complex and integral measures of wage dispersion analysed by Freeman and Oostendorp (Reference Freeman and Oostendorp2001). The negative link between GDP per capita and skill premium also suggests that in the process of economic development the supply of human capital is usually growing more rapidly than the demand for it. It also demonstrates that the demand shocks inherent to economic and technological change, which occasionally must have led to increased wage dispersion, appear to have only modest effects on the long-term patterns; in the long term, supply factors dominate the picture.
The relationship between GDP per capita and the skill premium of building craftsmen (c. 1950)

Figure 1 also includes trend lines for different regions. It shows that the relationship between GDP per capita and skill premium was not exactly the same for all regions. Wage inequality in the Americas (north and south did not make a difference here), Asia and Africa was higher than in Europe. Regressions with the data confirm this picture (where skill premium is the dependent variable and GDP per capita the independent variable): dummies for Europe consistently had a negative sign (and are highly significant), whereas dummies for the other continents had a positive sign.Footnote 9 This suggests that the European skill premium was lower there than in the rest of the world, even than in North America; for example, the skill premium for the United States, the country with the highest GDP per capita (and probably the highest level of human capital formation), was still 71 per cent, much higher than in most western European countries (which generally had somewhat lower levels of human capital formation).Footnote 10 It is to the genesis of this low skill premium that we now turn.
3. Europe 1300–1914
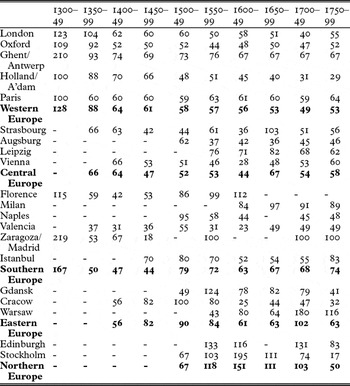
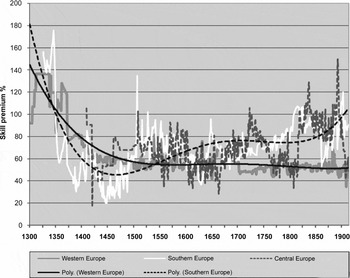
The work by Allen and Özmucur and Pamuk on the wages of construction workers in European cities in the very long run makes it relatively easy to construct time series of the skill premium in this industry between c. 1300 and 1914.Footnote 11 The series have been clustered in a number of groups, representing different regions and patterns. Table 1 shows the estimates for individual cities, whereas Figure 2 presents the average skill premium for three such regions: western Europe (Ghent/Antwerp, Amsterdam, Oxford, London and Paris), southern Europe (Florence, Milan, Naples, Valencia, Zaragoza/Madrid and Istanbul) and eastern Europe (Danzig, Cracow and Warsaw). The regions not presented in the Figure 2 are northern Europe (series for Scotland and Sweden, both starting in the sixteenth century) and central Europe (Strasbourg, Augsburg, Leipzig and Vienna). The clustering of the series is a bit ad hoc – other classifications are possible as well (for example, Leipzig also fits quite well into the eastern European group) – but more or less reflects the different patterns that can be found. The point should also be made that all observations are subject to certain margins of error and not completely free from possible biases. Although ‘labourers’ and ‘carpenters’ are relatively standardised professions, some variation does occur. Sometimes Allen uses the wages of masons or of other craftsmen, and there is probably some regional variation in the type of unskilled labourers that are found in the data – are they helpers of masons, or unskilled labourers as such? As the data from some cities show, the structure of summer wages may be slightly different from that of winter wages. By clustering observations from a number of cities in a certain region, part of the variation resulting from these measurement problems can be evened out, but probably not all. It is, for example, striking that the lowest skill premiums are found not only in western and central Europe, but also in Valencia and Naples, but I have not been able to find good explanations for the low skill premiums there (see Table 1).
The skill premium of construction workers in Europe, 1300–1800 (averages per 50-year period)

The skill premiums of craftsmen in construction in western, southern and central Europe, 1300–1914

An additional problem is that the time series for different cities are of unequal length. For the fourteenth century no series for central, eastern and northern Europe are available; for southern Europe in the fourteenth century we have only data for Florence and Zaragoza. But from the fifteenth century onwards data become more abundant, and we are on firmer ground, although there continue to be gaps in individual series. (Table 1 gives an overview of the availability of the series for the different cities per period of 50 years.)
Figure 2 shows that during the first half of fourteenth century the skill premium in parts of Europe was relatively high at between 100 and 150 per cent of the wage of an unskilled labourer. From the evidence available for England it appears there may have been an increase in wage inequality during the first decades of the fourteenth century, and that in the 1330s (after the Great European Famine of 1315–22) a decline had already set in.Footnote 12 The Zaragoza series already peaks in the 1310s, but in Florence and the Low Countries the decline of the skill premium begins after 1348. It then declined until the middle of the fifteenth century, when a level of about 50 to 60 per cent was reached.
This decline between 1348 and 1450 is perhaps the most striking development that should be explained, the more so since in large parts of Europe – in the western and in the central parts – there followed a period of more than 450 years in which the skill premium remained strikingly constant.Footnote 13 In the other parts of Europe – in the south and in Poland – there was a tendency for the skill premium to slowly rise again. To some extent the skill premium in these increasingly ‘peripheral areas’ seems to move with the rhythm of population growth, increasing during the sixteenth century, stabilising in the seventeenth century, and increasing again in the eighteenth and nineteenth centuries, a phenomenon to which I will return below. The ‘little divergence’ between northwestern Europe and the rest of the subcontinent that occurs in particular after 1650 can still be found in twentieth-century data: in 1936/7, according to the ILO data, the difference between the wages of carpenters and unskilled labourers was on average 56 per cent in six eastern European countries (range: 28 and 95 per cent), 45 per cent in three southern European countries (25 to 64 per cent) and only 22 per cent in four western European countries (12 to 28 per cent).Footnote 14
Central Europe (for which no data for the period before 1400 are available) more or less follows the same pattern as western Europe: the skill premium stabilises there at low levels between 40 to 60 per cent. A radically different pattern can, finally, be found in the north, in Scotland and Sweden. There the first data are for the middle of the sixteenth century; they show a skill premium that is much higher than in the rest of the Continent and fluctuates wildly around 100 to 125 per cent in both Edinburgh and Stockholm. This pattern basically remains unchanged until the second half of the eighteenth century; in 1750s the skill premium in Edinburgh was about 100 per cent, after which it declines to 33 per cent in the 1770s and 1780s;Footnote 15 similarly, in Stockholm it was still 100 per cent in the 1700s, but less than 40 per cent after 1725.
It remains puzzling that during dramatic periods of economic development, such as the Dutch Golden Age or the British Industrial Revolution, the skill premium in the construction industry remained stable. There is some evidence that other skill premiums may have gone up. De Vries and van der Woude, van Zanden (for salaried employees) and Williamson (but contested by Feinstein) found evidence of increases in the skill premium in other parts of the labour market, in particular related to relatively highly skilled employees.Footnote 16 These reflected bottlenecks in the supply of skilled labour, the result of accelerations in economic growth and the transformation of economic structures.
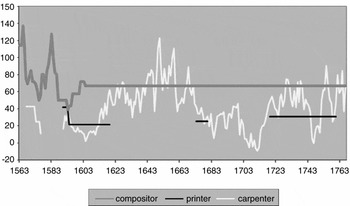
Should we conclude then that the stability of the skill premium of carpenters and masons was exceptional? To test the idea that the low skill premium of construction workers reflected a much broader phenomenon of a relatively flexible supply of skilled labour, I also collected wage data on another group of highly skilled craftsmen, the compositors and printers working in the printing industry that arose after the invention of movable type printing by Gutenberg in the 1450s. In a way these printers were the ICT workers of the late medieval and early modern period, operating and developing the new techniques of mass production of information. Book production grew dramatically in Europe from the 1470s onwards and the demand for their skills must have been growing very rapidly. But this did not lead to ‘excessive’ wage levels. The very detailed wage data available for the large firm Plantijn in Antwerp for the period 1560–1800 show that in this booming centre of the printing industry wages of these highly skilled and literate workers were at best at the same level as those of skilled construction workers, and often substantially lower than that (Figure 3). Because many printers were recruited from abroad – in particular from Germany – this must have been indicative of wage trends elsewhere.Footnote 17 This again points to the relative flexibility of the supply of skilled labourers in early modern Europe and suggests that the low skill premium found in the construction industry may be indicative of the efficiency of the training system in general.
Skill premium of printers, compositors and carpenters in Antwerp (Plantijn), 1563–1766

4. Outside Europe
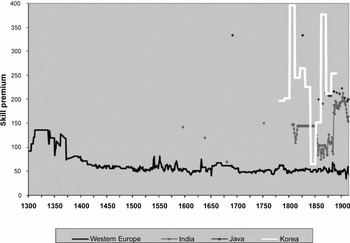
For other parts of Eurasia – for India, Japan, Korea, China and Indonesia – it is also possible to find similar data on the structure of wages in construction activities, which are brought together in Figure 4. For India the data go back to the famous report on the state of the Moghul Empire in 1595, Abul Fazl's Ain-i-Akbari, which gives a detailed list of the wages paid to different groups of workers showing a skill premium that was much higher there than in Europe (which is confirmed by other data for seventeenth- and eighteenth- century India). The eighteenth- and nineteenth-century observations for Indonesia and Korea suggest similar high levels.Footnote 18 Russia fits into the same picture; the data published by Hellie for the seventeenth century point to a 100 per cent (carpenter/unskilled labourer) to 167 per cent (mason/unskilled labourer) skill premium.Footnote 19 For the Middle East (Egypt and Iraq) a few wage data have been published by Ashtor, which go back to the eighth to thirteenth centuries, all indicating a skill premium of about 100 per cent; the oldest is from Baghdad in 762–6, where a day labourer earned 2 to 3 habbas and a master mason 5.Footnote 20
The skill premium of craftsmen in the construction industry in western Europe, India, Java and Korea, 1300–1914

The general picture appears to be that outside western Europe the skill premium measured in this way was much higher than around the shores of the North Sea, but there are a few important exceptions. Japan is a difficult case. From Saito's study of wages and economic development a few observations can be derived that point to a rather high level: a typical observation is that in 1802/4 a day labourer in Kyoto earned 0.92 monme per day, while the wage of a carpenter in the countryside (in Kami-Kawarabayashi) was 2.6 monme and that of an Osaka carpenter 4.3 monme per day.Footnote 21 But the records of the ships of the Dutch East India Company that visited Nagasaki during the seventeenth and eighteenth centuries show a much smaller skill premium of slightly less than 100 per cent.Footnote 22 Moreover, in the 1870s and 1880s, when national statistics become available, the skill premium was relatively low, and comparable to levels in western Europe.Footnote 23
The most significant exception was southern China, however. Government regulations concerning wages of unskilled and skilled labourers in the north, in Beijing, during the seventeenth and eighteenth centuries point to a skill premium of 100 per cent, similar to what was found in other parts of Asia.Footnote 24 But a detailed source from 1769, the Wuliao jiazhi zeli, shows however that there existed large regional variations in the skill premium: in the south, the skill premium was comparable to western Europe (25–67 per cent). The countrywide average of less than 40 per cent was heavily dominated by the much more densely populated south.Footnote 25 Although this source is not without its problems, the skill premium that can be derived is probably quite accurate; it is confirmed by other data based on actual wage payments, such as those of the Dutch East Indies Company (VOC) ships entering the port of Canton.Footnote 26
5. Explanations: the link with interest rates
The data presented in the previous sections raise a number of questions about the remuneration of human capital in different parts of the world. The first and perhaps most striking development is the sudden and spectacular decline in the skill premium in the century after the Black Death. The result was that during the Renaissance – between 1400 and 1550 – the skill premium was exceptionally low. The stability of the skill premium in western Europe between c. 1450 and 1914 is the second striking phenomenon; how is it possible that in those four-and-a-half centuries the relative pay of craftsmen was ‘frozen’ at such a low level? The divergence of the south and the east in the centuries after 1650 (or perhaps 1450?) is perhaps the third remarkable development – is there a link with the ‘little divergence’ in terms of real wages analysed by Allen?Footnote 27 Finally, why was the skill premium in western Europe so much lower than elsewhere on the globe – with the significant exception of China?
The first possibility to consider is that the low skill premium in post-1450 western Europe points to high levels of human capital formation reflecting the favourable factor endowments of the region (the Lindert et al. hypothesis). An elastic supply of capital leading to low interest rates will lead to high levels of investment in human capital and low skill premiums.Footnote 28 Because the outlines of the apprenticeship system in Europe are relatively well known, and seem not to have changed fundamentally in the period under study, it is possible to ‘model’ this relationship between interest rates and skill premium.Footnote 29 The following assumptions are used in this simulation:
- a seven-year apprenticeship period – the standard in English contracts – between ages 14 and 21;Footnote 30
- the unearned income of the apprentice is estimated at 20 per cent of the annual wages of an unskilled labourer at age 14, increasing via 40 per cent (15 years), 60 per cent (16 years), 70 per cent (17), 80 per cent (18), 90 per cent (19) to 100 per cent at age 20;Footnote 31
- after finishing apprenticeship, skilled craftsmen will earn the higher wage for a period of 45 years, at ages 21 to 65.Footnote 32
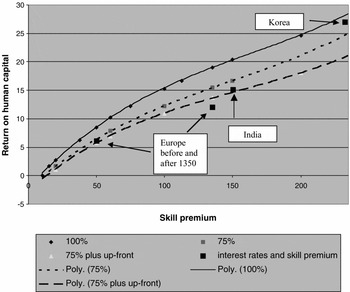
Three variants have been calculated: the first one is based on the assumption that an apprentice has a 100 per cent chance of becoming a craftsman after finishing his seven years of training; the second variant assumes this chance to be 75 per cent and that there is a 25 per cent chance that he will earn the income of an unskilled labourer only; the third variant additionally assumes that the apprentice has to pay a premium of 50 per cent of the annual wage of an unskilled labourer up-front. Figure 5 gives the relationships between skill premium and return on capital invested in training that can be derived from these assumptions. It shows, for example, that a decline of the skill premium from 135 per cent (in 1325) to 60 per cent (in 1450) would be consistent with a decline of the return on human capital from 19 per cent to 10 per cent in the first variant, from about 15.5 per cent to 8 per cent in the second variant, and from almost 14 per cent to 7 per cent in the third. Also added to Figure 5 are the very rough estimates of interest rates and skill premiums for a number of countries for the early modern period (explained in more detail below).
Modelled relationship between skill premium and return on human capital; three variations

Given the fact that becoming a carpenter or a mason meant acquiring the same skills before and after the Black Death, the most straightforward explanation for the post-1350 decline of the skill premium in construction is that interest rates in Europe declined sharply in this period. This induced households to increase their investment in human capital, which led to the observed change in the skill premium. The fall in the skill premium occurred in different parts of the Continent, which is consistent with the fact that all over Europe interest rates seem to have halved in the century or so after the Black Death. The evidence relates to actual interest rates on loans and on the public debt (collected by Homer and Sylla), on the yield on investment in land (put together by Clark and Epstein), and can also be derived from what we know about the seasonal fluctuations in grain prices, on the basis of which McCloskey and Nash and Poynder have made estimates of medieval interest rates.Footnote 33 The exact degree of the decline of interest rates in Europe is not precisely known, however; for England Clark suggests a fall by perhaps as much as 50 to 60 per cent, from 10 to 11 per cent before 1350 to 4 to 5 per cent in 1450–1500. Zuijderduijn has documented a similar decline (from about 12 per cent to 6 per cent) in Holland in the same years.Footnote 34
The returns on investment in human capital estimated in this way are somewhat higher than these interest rates on capital market; the latter are related to the more formal parts of the capital market, in which land was (or could be) used as collateral. Obviously, investment in human capital was more risky than investment in land, but this risk premium was – if we are to believe these calculations – not very large. Significantly, McCloskey and Nash also found a more radical decline in interest rates on rural capital markets in their study of the seasonal variation in grain prices.Footnote 35 The evidence presented here and in their study perhaps indicates that the spread of interest rates between ‘formal’ and ‘informal’ capital markets was also declining during the 1350–1450 period.
The standard explanation for falling interest rates after 1350 is that the Black Death caused an exogenous fall in population levels, which – given the fact that the capital stock and the cultivated land remained the same – resulted in a more favourable capital/labour and land/labour ratio, which induced the fall in interest rates (and led to increased levels of consumption, given the rise in wealth per capita). Income effects may also have played a role: real wages and incomes went up sharply in the same period, which will also have increased the supply of savings and enhanced the willingness to invest in human capital.Footnote 36 But this demographic change also seems to have resulted in a new equilibrium on capital markets (because interest rates remained at the much lower level attained around 1450) and on labour markets (because the same happened with the skill premium). This points to structural changes in savings behaviour and/or in capital and labour market institutions, which have been analysed elsewhere (de Moor and van Zanden Reference Moor and Zanden2005; see also Pamuk Reference Pamuk2007).
Can interest rate differentials also explain the gap in wage inequality between Europe and the rest of Eurasia? Evidence that interest rates in Europe were lower than elsewhere on the Eurasian continent is fragmentary, but the general tendency seems to be that from the late Middle Ages onwards capital markets in Europe were more efficient and developed – broader and deeper – than elsewhere.Footnote 37 Adam Smith was already convinced of the fact that interest rates in Europe – in particular in Great Britain and Holland – were much lower than in China: ‘twelve per cent accordingly is said to be the common interest of money in China’, he stated, whereas he considered 3 to 4.5 per cent to be normal in Great Britain.Footnote 38
The extreme of the spectrum of interest rates was probably Southeast Asia; recently a discussion started about the causes of the ‘high interest rates/thin capital markets’ equilibrium trap, in which the region was caught as early as the seventeenth century.Footnote 39 The ‘normal’ interest rate found by Boomgaard, for example, in an in-depth study of the capital market in Buitenzorg (near present-day Jakarta) in 1805 was between 40 to 50 per cent.Footnote 40 In another paper on interest rates on credit transactions carried out by the East India Company in seventeenth-century South and Southeast Asia, he shows that such high rates were not unusual in Southeast Asia, but that in general they were somewhat lower: 24–36 per cent in Jambi (on Sumatra), 18–24 per cent in Banten (on Java) and about 24 per cent in Thailand. In India, the VOC paid or received (the Company was both a debtor and a creditor) 12–18 per cent in Coromandel and Bengal, somewhat less in Surat.Footnote 41 At the same time, in the Netherlands the Company was able to borrow at 3.5 to 5 per cent. Other sources confirm that relatively high interest rates were normal in South Asia; Diverkar, for example, in his study of ‘Prices and wages in Pune region’ quotes sources stating that 24 per cent was considered the usual rate of interest, but that small sums were often borrowed at higher rates (up to 75 per cent for small loans in kind).Footnote 42
The available data for Korea also point to a link between high interest rates and high skill premiums; according to Jun and Lewis the interest rate in eighteenth- and nineteenth-century Korea fluctuated between 25 and 50 per cent, with an average of 37 per cent.Footnote 43 Information on China is more fragmentary; James Shih observed that during the early Ming in the lower Yangtze delta (at the time when European interest rates were as low as 5–6 per cent) ‘customarily, if one borrowed one shi of rice, one had to pay back two shi after the autumn harvest; if one borrowed money (i.e., silver or copper cash), one had to pay 50 percent yearly interest’.Footnote 44 In the same period, the fifteenth century, the normal return on loans among merchants in Suzhou was 2 per cent per month.Footnote 45 In the seventeenth and eighteenth centuries interest rates had clearly come down from these very high levels. It is an interesting reversal of European patterns (where big merchants were always the source of royal credit) that the great salt merchants of Yanghou borrowed large sums of money from the Imperial Household Department in Beijing at a rock-bottom interest rate of 10 per cent.Footnote 46 The best source of information on eighteenth-century interest rates is the study by Paul van Dyke of the Canton Trade, showing the many credit transactions between European and Chinese merchants in this period. Europeans borrowed money from other Europeans (and sometimes from Chinese merchants) at about 10–12 per cent per annum, whereas interest rates on loans to Chinese merchants were much higher at 18–36 per cent (or 1.5–3 per cent per month for short-term loans).Footnote 47 Summing up, interest rates in China seem to have been almost as high as elsewhere in Asia, and can therefore not help to explain the low skill premium there.
For Japan, finally, the story is more complex. In eighteenth-century Japan interest rates were still relatively high (about 12 per cent), but on certain segments of the capital market, in particular the credit transactions between the major Osaka merchant firms, interest rates declined in the long run, to about 7 per cent during the first half of the nineteenth century. According to Saito and Settsu (Reference Saito and Settsu2005), this decline was due to the decrease of the profitability of these large firms and to the fact that ‘recurrent transactions within this Osaka-based relational contracting system increased predictability within the system, thus allowing interest rates in the Osaka market to fall’.Footnote 48 After some time, this decline spread to other capital markets; between 1830 and 1870 the interest rates of pawnshops showed a similar tendency (Saito and Settsu Reference Saito and Settsu2005). One interpretation of the development of the skill premium in Japan would be that it followed interest rates, with perhaps some delay. It would explain both the Saito estimates for the beginning of the nineteenth century, pointing at a high skill premium, and the low skill premiums that can be found in official statistics from the late 1870s onwards.Footnote 49
These examples show that there existed a big gap in interest rates between western Europe on the one hand, and Asia on the other hand – a gap that was to some extent being bridged by Japan. Figure 4 shows that, assuming that the costs of training young apprentices are similar everywhere, the large differences in skill premiums between the rest of Eurasia and post-1348 western Europe can be explained by this gap in interest rates. With the notable exception of China, where interest rates were rather high but the skill premium was lower than in the rest of East and South Asia, the efficiency of capital market institutions seems to explain the price of human capital; the specific development of Japan, where both the interest rate and the skill premium probably declined, also fits nicely into such an interpretation.
6. Explanations: the efficiency of training institutions
Interest rates are only part of the story, however. The efficiency of institutions regulating the training of apprentices and access to the profession in general also play a role on the supply side of the equation. In two different manners the way in which the transfer of skills from one generation to another is organised may affect the skill premium. Firstly, the question is which institutions regulate the contract between apprentice and master, which is highly complex, involving different remunerations for services spread out over a lengthy time period.Footnote 50 Apprentices may fear, when they pay for their training up-front, that they will not get the quantity and quality of training necessary for becoming a skilled worker or an independent craftsman. Masters may fear that after the apprentice has been a net liability for his household during the first years of the contract, he will quit, before becoming a net source of income during the second half of his term.Footnote 51 When the master himself controls access to the ranks of skilled craftsmen, trainees may also fear that he may renege on his promises.Footnote 52 These by definition ‘incomplete’ contracts may therefore result in underinvestment in human capital; efficient levels of human capital formation require a certain level of reciprocity and trust between both parties and/or third-party involvement, i.e. institutions that guarantee the fair execution of the apprentice contract. In western Europe formal institutions had emerged, the guilds, which took care of these problems – at least, according to the recent reassessment of their role in economic development by a number of authors who studied their functioning in detail.Footnote 53 These institutions have, however, been criticised in the past for monopolising these skills and, by restricting entry into their trade, for trying to keep their relative pay above market clearing levels. The beneficial effects of the guilds on the intergenerational transfer of skills may therefore be counterbalanced by their attempts to form local cartels. The study of the skill premium also tells us something of the relative success of guilds in western Europe in achieving this aim.
The alternative to these formal institutions was that the family or the clan (or the caste) played a central role and skills were transferred from fathers to sons or other members of the (extended) family. In fact, in parts of Asia, being a craftsman was largely hereditary. In India, the essence of the caste system was to transfer the skills of certain professions via family lines.Footnote 54 In Song and Yuan (and Ming) China the state had defined craftsmen as a separate social class, which was taxed separately, often in the form of regulated labour services; this tax burden was hereditary, and based on the assumption that the father would be succeeded by another family member after his death. This changed under the Qing; they abolished the hereditary corvée duties for artisans, who were from 1661 onwards included as normal households in the land tax registers. This ‘meant that their occupation was no longer hereditary by legal obligation’.Footnote 55 The long tradition of coerced labour of craftsmen under the Song, Yuan and Ming makes one wonder, however, how to interpret the low skill premium found in parts of China during the Qing.
Guilds or guild-like institutions occurred in other parts of Eurasia as well, in particular the Middle East, but also in Qing China after the state withdrew from regulating the supply of skilled labour in the late seventeenth century. However, only in the nineteenth century did guilds begin to play a role comparable to that of some European guilds (Moll-Murata Reference Moll-Murata2006). Similarly, guild-like structures appeared in Tokugawa Japan, but their involvement with the training of apprentices was probably rather limited (Nagata 2006). Still, it is striking that in the three regions that had (probably) the lowest skill premium, institutions such as guilds also existed, which seems to suggest that the efficiency gains of guilds (in this respect) outweighed the losses.Footnote 56 They, for example, operated as the ‘third’ party that saw to the fair treatment of apprentices and the enactment of their contract. If the guilds had been less efficient, if they had functioned as cartels of skilled labour effectively restricting the entry to the ranks of craftsmen, one would expect to find a positive correlation between the presence of guilds and the skill premium; the fact that we find, on a global scale, a negative relationship suggests that the recent reassessment of the guilds is on the right track.
7. Explanations: demographic developments and the demand for skills
In all the European regions we have data for, the 1350–1450 period is characterised by sharply declining skill premiums; this is followed, in the North Sea area, by a century-long stagnation at the new level, but in southern and central Europe long swings in the skill premium occur after 1450. The existence of guilds could not guarantee the long-term stability of the skill premium at the 50–60 per cent level that was typical of fifteenth-century Europe. The example of Italy, where guilds were relatively strong, demonstrates this clearly (see Figure 2).Footnote 57 More generally, in southern and eastern Europe, where guilds often did regulate labour markets, the skill premium appears to be more flexible than in the northwestern part of the subcontinent. The long-term trends in the skill premium in the south and east point to a relationship with population growth: the skill premium increases in the sixteenth century, which is followed by convergence to the western European level during the seventeenth-century ‘crisis’, which is again followed by an increase of skill premiums in the south and the east in the eighteenth and nineteenth centuries (Figure 2).
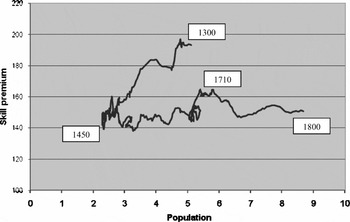
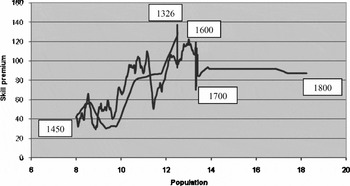
The two patterns found can best be observed in the two regions for which we have the longest time series: England and northern Italy (Florence before 1618, Milan afterwards). As Figure 6 shows, in England the relationship between population and skill premium changed fundamentally in the fifteenth century; whereas the fall in population and the decline of the skill premium moved more or less in tandem before 1450, a clear ‘delinking’ occurred thereafter. In (northern) Italy no such delinking occurs (Figure 7); in 1600 one is back to almost the same spot as in 1350: the Florentine skill premium has returned to more than 100 per cent, and the population has also increased to the pre-Black Death level of about 12.5 million. After 1620 a stagnation in population growth (which stabilises at slightly more than 13 million) is accompanied by a small decline in the skill premium (to about 80 per cent); the real ‘delinking’ seems to occur in the eighteenth century, when rapid population growth does not lead to a further increase in the skill premium (of Milanese workers) anymore.
Skill premium (nine-year moving average) and estimates of English population (in millions), 1300–1800

Skill premium (nine-year moving average) in Florence/Milan and estimates of the population of Italy (in millions), 1326–1800

The links between the skill premium and population growth are evidence that demand-related factors also played a role: the growth in the construction industry, and the related demand for the skills of these craftsmen, was intimately related to demographic growth, explaining why the skill premium tends to increase in periods of population growth. Perhaps the ‘delinking’ between demographic growth and the skill premium occurring in the North Sea area in the fifteenth century is more striking than the continuation of this link in the rest of Europe. It points to the fact that labour markets and training institutions were sufficiently efficient to adapt quickly to changes in the demand for skills (confirming what we found for the printers and compositors in Antwerp). There may however been ‘deeper’ causes for this as well. As Sevket Pamuk (Reference Pamuk2007) has demonstrated recently, the fifteenth century saw the beginning of the ‘little divergence’ within Europe in terms of real wages, with real wages in northwestern Europe stabilising in the long run, whereas in the rest of the Continent they gradually moved back to the pre-Black Death level. Pamuk (Reference Pamuk2007) argues that the two regions reacted differently to the situation of labour scarcity that arose in the fifteenth century, and that differences in demographic behaviour may have played a role as well (see also de Moor and van Zanden, Reference Moor and Zanden2005).
Another part of the explanation might be that the wage of unskilled labourers was linked to the labour productivity in agriculture, which tended to be correlated with the size of the population. Such a link between rural and urban labour markets for unskilled labourers is a well-known theme in the literature on pre-industrial labour markets. In Japan, India and Indonesia unskilled labourers are basically agricultural labourers – coolies is the term used in Southeast Asia – who were active part-time in construction and other urban activities. Saito in his study of the Japan labour market stressed the links between the urban market for unskilled labourers and the situation in agriculture; unskilled labourers in cities earn about the same wage as ‘male springtime farm workers’; the urban–rural wage gap was relatively small, at least for unskilled labourers.Footnote 58
The connection that can be found between population growth and the skill premium can to some extent be explained in this way: the wages of unskilled workers reflected labour productivity in agriculture, which in the long run was linked to population growth. The rapid demographic expansion of the sixteenth century led to a sharp decline in rural real wages, but the urban sector could to some extent protect itself against these trends. In the North Sea area real wages in agriculture did not decline as much as in the south and east because of productivity growth in agriculture (as a result of which the ‘little divergence’ occurred); moreover, labour markets were better integrated, and wages in agriculture moved parallel with wages of craftsmen in construction industry. The delinking of population growth and the skill premium therefore points to fundamental changes in the economies of northwestern Europe, and shows that labour markets there were better integrated and less segmented than in the southern and eastern parts of the subcontinent, and that they were better able to respond to increased demand for these skills in times of population growth.
These links can be illustrated with an extreme example of a labour market with a low level of integration, eighteenth- and nineteenth-century Ireland. The country had not, like much of the rest of the Celtic fringe, fully participated in the big boom of the high Middle Ages and missed the thorough restructuring of the institutional framework of its economy and society that occurred elsewhere (and as far as these institutions were introduced, they were largely restricted to the English minority that dominated its towns). In the eighteenth century we find an extremely high skill premium here, ranging from 100 per cent in Dublin to 200 per cent in the countryside; by all standards Ireland is a clear outlier, with a much lower level of human capital formation than in the rest of western Europe, which is confirmed by Mokyr's work on age heaping showing similar low levels of numeracy and literacy.Footnote 59 One of the factors behind the enormous spread in wage levels was the wage gap between town and countryside (another feature of a poorly integrated economy): in eighteenth-century Dublin, for example, craftsmen earned a wage that was often double the wage of similar workers in rural Kilkenny, and the urban–rural wage gap for unskilled and semi-skilled labourers was even bigger.Footnote 60 What is even more striking is that the skill premium went up between 1700 and 1850, whereas at the same time in Scotland it declined sharply to converge to the English level. In Dublin it increased from 100 per cent between 1700 and 1760 to 140 per cent between 1836 and 1850; in rural Armagh from 155 per cent in the 1740s to 200 per cent in the 1840s. These are levels that are comparable to those in East and Southeast Asia but quite unlike the rest of western Europe.Footnote 61 The analysis presented here suggests that this sharp increase in the skill premium, which was unique for eighteenth- and early nineteenth-century Ireland, was linked to a stagnant or perhaps even declining labour productivity in agriculture, induced by strong population growth.Footnote 62
8. Effects on economic growth?
New growth theory postulates that human capital formation is one of the determinants of long-term economic growth. If this is correct, one would expect that the different conditions for human capital formation, reflected in the differences in the skill premium analysed in this article, have affected long-term economic growth. This has been clearly pointed out by Davin Chor (Reference Chor2005), who demonstrates that such a link existed in early modern Europe: cities with efficient institutions resulting in low skill premiums had higher levels of real wages, a clear indicator of their relative success. So the skill premium and its determinants help to explain the ‘little divergence’ occurring within Europe between 1400 and 1800.
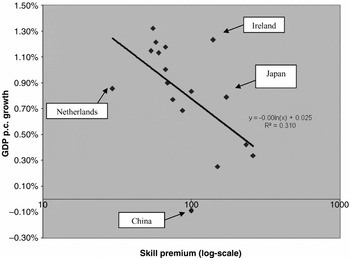
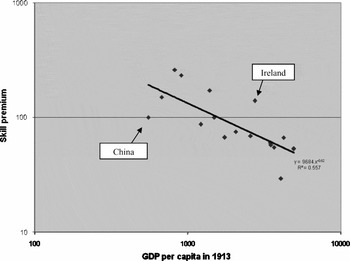
Can these differences in the price of human capital also help explain the ‘Great Divergence’? This idea is tested in two ways. Figure 8 shows the relationship between the average skill premium in the period 1750–1820 and the growth of GDP per capita during the nineteenth century (the period 1820–1913) according to the Maddison's estimates.Footnote 63 Because the 1820 estimates of levels of GDP are relatively weak and subject to much debate – the revisionists claiming that the gap between Europe and China was much smaller than estimated by Maddison – I also compared the absolute level of GDP per capita in 1913 with the skill premium in the period 1750–1820 (Figure 9).
The average skill premium of construction workers, 1750–1820, and GDP per capita growth, 1820–1913

The skill premium in 1750–1820 and GDP per capita in 1913 (log-scale)

In both cases we find a clear relationship between growth/level of GDP and the skill premium; the link with the 1913 level of GDP per capita appears to be stronger than with growth during the nineteenth century. There are a number of outliers in Figure 8: China, the Netherlands and Ireland; the latter country made a U-turn after the Famine of the 1840s, ‘explaining’ why its performance cannot be predicted on the efficiency of its institutions in about 1800. Japan also has a somewhat higher rate of growth than might be expected on the basis of its skill premium in about 1800, but I adopted the rather high 1804 estimate of the skill premium by Saito here, which may not be representative of the national average.Footnote 64 China is the ‘underperformer’ of the nineteenth century by these standards; it is the only country with a declining GDP per capita (according to Maddison) and continues to be the enigma of this study. I used the estimates for Beijing (of a 100 per cent skill premium) instead of the countrywide estimates because for other countries we also have data related to their capital cities; using the much lower countrywide estimates would make the underperformance of China even more dramatic. Growth in the Netherlands was relatively slow because it started from a rather high level (see van Zanden and van Riel Reference Zanden and Riel2004 for an interpretation of its slow performance during the nineteenth century). The Dutch anomaly disappears in Figure 9; China remains the most significant outlier in the latter figure.Footnote 65
9. Conclusion
This article develops the argument that the skill premium measured in this relatively simple way – as the difference between the wages of carpenters and masons and those of unskilled labourers in construction – can be considered a good proxy of the factor endowments and the quality of the institutional framework of an economy. There is an obvious link to factor endowments: interest rates reflecting relative abundance of capital (and the efficiency of capital markets) appear to be an important factor determining the skill premium. Moreover, a low skill premium also generally appears to reflect a high level of human capital formation rather than a low demand for skilled labour as low-income countries typically have much higher skill premiums than rich ones. The link with institutional efficiency was also stressed: skill premiums are related to the efficiency of institutions for the formation of human capital, and the absence or presence of formal or informal barriers to entry in these professions. The data suggest that skill premiums in western Europe were not ‘inflated’ by conservative guilds; on the contrary, it appears that in regions with guilds the skill premium was on average lower than elsewhere (it is perhaps no coincidence that also in China and Japan guilds became increasingly important during the eighteenth and nineteenth centuries). Finally, by analysing the links between the skill premium and long-term demographic change, the impact of demand factors and of the flexibility of the supply of skills could also be studied.
In other words, a low skill premium reflects the fact that households have access to relatively efficient labour markets and capital markets, and that institutions for the formation of human capital are working well. A low skill premium also seems to point to relatively high levels of investment in human capital, which, following endogenous growth theory, will result in long-term economic growth. One of the links that can be suggested is that the skill premium of carpenters and masons, because they are the designers and makers of capital goods, affects the relative price of these capital goods; also via this link, a low skill premium will contribute to economic performance. The differential growth of the economies of early modern Europe appears to confirm this hypothesis; growth after 1450 was particularly strong in the North Sea area, where the skill premium was permanently low. But even more striking are the high correlations between international differences in the skill premium in about 1800 and growth during the nineteenth century. Therefore, the skill premium is not only a measure of the quality of the institutional framework of an economy, but also appears to be a predictor of growth in the long run.
Acknowledgements
A first draft of this paper was presented at the conference ‘Towards a Global History of Prices and Wages’ Utrecht, October 2004; I would like to thank the participants at this conference, in particular Bob Allen, Peter Lindert, Sevket Pamuk, Osamu Saito, and the two referees of this journal for their comments.
Appendix 1. The 1950 ILO data
Figure 1 is based on the following analysis of the data published in the ILO Yearbooks of 1948–55. The skill premium is the difference between the wage of the following two groups: ‘carpenter and joiner’ and ‘labourer’ for the year 1950, expressed as a percentage of the wage of the ‘labourer’. I preferred to use the data on wage rates, which were available for 54 countries; for seven countries data on wage earnings of these workers were used (to test if this made a difference, a dummy for ‘rates’ was included in the regression presented below). For some countries no data for 1950 were available, and I sometimes had to use data from proximate years (the search for data was extended to the period 1946–54), but in most countries annual changes in the skill premium were relatively small; again a variable was introduced in the regression (which was given the value of −4 for 1946, −3 for 1947, etc.) to find out if this mattered for the results (or, more precisely, if a trend in these observations could be detected, implying that taking any year other than 1950 would matter). Finally, an attempt was made to test econometrically the relationship between the skill premium in the construction industry and GDP per capita for the 1950 dataset, to substantiate the analysis in Figure 1. The independent variables were GDP per capita (log), a dummy for rates of pay (instead of actual earning), a dummy for years other than 1950 (to test if some kind of trend in the skill premium may have distorted the picture), and a dummy for European countries (to test the point that the skill premium in Europe was lower than elsewhere). The results were (using OLS):
Modelling Lskillpremium