Implications
We also observed the interaction between vitamin A supplementation level in finishing rations of Black Angus crossbred steers and ADH1C c.-64T>C genotype with intramuscular fat (IMF) where again the TT genotype marbled best. These steers were fed a backgrounding diet typical of the beef industry, consequently feedlots could use this association to manage cattle. The optimum inclusion level of vitamin A still needs to be determined as does the number of days on feed and whether or not this association is still present with hormone implants. Feedlots may be able to use the interaction to better access markets that pay premiums for IMF.
Introduction
Marbling, that is intramuscular fat (IMF), is linked to consumer satisfaction through increased juiciness and flavor, as well as perceived tenderness of the meat (Killinger et al., Reference Killinger, Calkins, Umbergert, Feuz and Eskridge2004). In grid marketing programs in Canada and the United States, a premium is paid for producing carcasses with consistently high marbling grades (DiCostanzo and Dahlen, Reference DiCostanzo and Dahlen2000). Marker-assisted management involves the management of cattle to improve production and carcass traits based on the genotype of the animal.
Nutritional studies have shown that vitamin A restriction in the diet of beef cattle increases marbling, without affecting average daily gain (ADG) or feed-to-gain ratio (Oka et al., Reference Oka, Maruo, Miki, Yamasaki and Saito1998; Wang et al., Reference Wang, Wang, Gong, Wang and Tan2007; Gibb et al., Reference Gibb, Van Herk, Mir, Loerch and McAllister2011). Retinol (ROL; vitamin A) is oxidized to retinaldehyde (RAL) by alcohol dehydrogenase, and then further oxidized to retinoic acid (RA) by aldehyde dehydrogenase (Duester, Reference Duckett, Wagner, Owens, Dolezal and Gill2000). Both RAL and RA are ligands that regulate a number of genes involved in adipogenesis (Ziouzenkova et al., Reference Ziouzenkova, Orasanu, Sharlach, Akiyama, Berger, Viereck, Hamilton, Tang, Dolnikowski, Vogel, Duester and Plutzky2007): RA stimulates fat deposition (Heyman et al., Reference Heyman, Mangelsdorf, Dyck, Stein, Eichele, Evans and Thaller1992), whereas RAL has an inhibitory effect (Ziouzenkova et al., Reference Ziouzenkova, Orasanu, Sharlach, Akiyama, Berger, Viereck, Hamilton, Tang, Dolnikowski, Vogel, Duester and Plutzky2007).
Ward et al. (Reference Ward, McKinnon, Hendrick and Buchanan2012) reported a single nucleotide polymorphism (SNP) in the promoter region of alcohol dehydrogenase 1C (ADH1C c.-64T>C) that results in reduced gene expression. They reported that TT genotype steers had higher IMF than CC steers when supplemental vitamin A was removed from the ration. However, complete restriction of vitamin A is impractical due to potential production and health ramifications of clinical vitamin A deficiency (National Research Council (NRC), 1996).
The interaction between ADH1C c.-64T>C and vitamin A in beef rations indicates there is potential use of this SNP in marker-assisted management programs. The objective of the current research was to determine the optimum level of vitamin A, in combination with ADH1C c.-64T>C genotype, for beef cattle diets to improve carcass quality grade.
Material and methods
All animals were cared for according to the guidelines outlined by the Guide to the Care and Use of Experimental Animals (Canadian Council on Animal Care, 1993).
Animal selection and housing
Initially, 450 Black Angus crossbred steers were purchased from a commercial auction market. At the time of processing, a hair sample from the tail of each animal was obtained and used for DNA extraction and genotyping. The steers were genotyped at ADH1C c.-64T>C using a PCR-RFLP modified from Ward et al. (Reference Ward, McKinnon, Hendrick and Buchanan2012). Briefly, 25 μl PCR cocktail containing 0.2 pmol forward and reverse primers (Ward et al., Reference Ward, McKinnon, Hendrick and Buchanan2012; Integrated DNA Technologies, Coralville, IA, USA), 0.2 mM dNTP (Fermentas, Burlington, ON, Canada), 0.5 mg/ml BSA (New England Biolabs, Pickering, ON, Canada), Taq polymerase (Thermo Fisher Scientific, Waltham, MA, USA), 10× Taq buffer with (NH4)2SO4 (Thermo Fisher Scientific, Waltham, MA, USA) and 2 mM MgCl2 (Thermo Fisher Scientific, Waltham, MA, USA) were combined with 1.5 μl DNA. The PCR amplification was performed on a MyCycler Thermal Cycler (Bio-Rad, Mississauga, ON, Canada). Initial denaturation was conducted at 94°C for 2 min. In total, 30 cycles for 30 s at 94°C, 30 s at 61°C and 45 s at 72°C were performed followed by a prolonged extension for 10 min at 72°C. The PCR product was digested for 5 h with BslI (New England Biolabs, Pickering, ON, Canada) and the resulting fragments were separated using electrophoresis on a 3% agarose gel. In total, 45 TT, 45 CT and 27 CC animals were selected for a total of 117 steers and included in the feeding trial. The steers were housed in four pens with an even distribution of genotype and treatment across pens. No hormonal implants were used in order to eliminate any negative effects on marbling potential (Duckett et al., Reference Duester1999; López-Campos et al., Reference Lopez-Campos, Aalhus, Okine, Baron and Basarab2013).
Diets and treatments
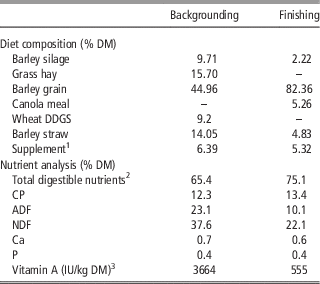
The trial was conducted at the University of Saskatchewan’s Beef Cattle Research Facility. The 117 steers (327±52 kg) were backgrounded for 66 days on a commercial backgrounding ration (Table 1). Samples of barley grain and hay were collected and analyzed for β-carotene content (DSM Nutritional Products, Inc., Ayr, ON, Canada) before inclusion in the ration. The basal diet provided 3664 IU vitamin A/kg dry matter (DM), which is greater than the 2200 IU/kg DM recommended by NRC (1996), the diet was formulated to be representative of industry practises, therefore no vitamin A was supplemented during the backgrounding period.
Composition and nutrient analysis of backgrounding and finishing rations fed to beef steers on a dry matter (DM) basis

1 Supplement supplied by Federated Co-operative Ltd, Saskatoon, SK. Contained the following: 540 ppm Zn, 499 ppm Mn, 182 ppm Cu, 16 ppm I, 4.60 ppm Co, 1.34 ppm Se, 5000 IU/kg Vitamin D3, 500 IU/kg Vitamin E, 620 mg/kg Rumensin® Premix 200 (Elanco, Guelph, ON).
2 Total digestible nutrients (TDN) (%)=tdCP+(tdFA×2.25)+tdNDF−7, td=total digestible, FA=fatty acid; DDGS=distiller’s dried grain with solubles.
3 Calculated as 400 IU/mg β-carotene (NRC, 1970).
Following completion of the backgrounding period, the animals were adapted to an 82% barley grain finishing ration (DM basis) that contained no supplemental vitamin A (Table 1) and were fed for a period of 5 months. The basal ration contained 555 IU/kg DM of vitamin A that equals 25% of the NRC (1996) recommended level. Three vitamin A treatments were targeted to meet 25% (zero supplementation), 50% and 75% of the animals’ daily requirement (2200 IU Vitamin A/kg DM) as outlined by NRC (1996). We did not include a 100% NRC treatment as Ward et al. (Reference Ward, McKinnon, Hendrick and Buchanan2012) found no effect on IMF. Silage samples were collected every 21 days throughout the finishing period for analysis of β-carotene (DSM Nutritional Products, Inc., Ayr, ON, Canada). Vitamin A supplementation was based upon vitamin A level in the basal diet, animal weight and expected DM intake. Gelatin capsules (Torpac, Fairfield, NJ, USA) were used to administer the vitamin A treatments via oral bolus every 4 weeks. The 25% treatment capsules were filled with sugar (zero supplementation), whereas the 50% and 75% treatment capsules were filled with sugar plus microencapsulated retinyl palmitate (1 000 000 IU/g; Adisseo, Antony, France).
Chemical analysis
Total mixed ration samples were collected weekly and composited bi-weekly. The composite samples were dried and ground through a 1 mm screen using a hammer mill (Christie-Norris Laboratory Mill, Christie-Norris Ltd, Chelmsford, UK) and sent to Cumberland Valley Analytical Services (CVAS, Hagerstown, MD, USA) for analysis according to the methods outlined by the Association of Official Analytical Chemists (AOAC) (2000). Briefly, the samples were analyzed for DM (AOAC, 2000 method 930.15), CP using a Leco Fp-528 Nitrogen Combustion Analyzer (Leco, St Joseph, MI, USA; AOAC, 2000 method 984.13) and ADF (AOAC, 1990 method 973.18). NDF was analyzed using the method outlined by Van Soest et al. (Reference Van Soest, Robertson and Lewis1991).
Animal performance data
The cattle were provided feed for ad libitum intake once daily and the amount of feed provided per pen was recorded daily. Feed bunks were cleaned every 2 weeks and the orts weighed and discarded. DM intake per pen was calculated every 2 weeks based on the DM delivered to each pen and adjusted for orts.
Animal weights were recorded every 2 weeks before morning feeding for the duration of the finishing period. At the start and end of finishing, ultrasound measurements of the longissimus thoracis (LT) muscle and subcutaneous backfat were recorded using the techniques outlined by Bergen et al. (Reference Bergen, McKinnon, Christensen and Kohle1996).
Carcass characteristics
Following completion of the finishing period, with an endpoint of pens averaging 610 kg, the animals were slaughtered at a commercial abattoir in three groups over a period of 2 weeks. Hot carcass weight (HCW) was obtained along with a 19 mm thick steak collected from the LT muscle between the 12th and 13th rib from each carcass. Marbling, average fat and grade fat were measured by a Canadian Beef Grading Agency trained grader. Average fat and grade fat are measurements of backfat depth, the former is a mean value of three measurements, whereas the latter is taken at the narrowest point in the fourth quadrant. Following grading, the subcutaneous fat was trimmed off of each steak and the samples vacuum packaged and stored at −20°C until analysis.
Quantification of IMF was measured via a petroleum ether extraction (AOAC, 1990 method 960.39). Each steak was ground to produce a homogenous mixture. Duplicate samples of 3 g were weighed, mixed with sand (Alfa Aesar, Ward Hill, MA, USA) to prevent clumping and placed in a cellulose extraction thimble (Whatman International Ltd, Maidstone, England). The thimble and sample were then placed in an extraction beaker and dried overnight in a forced air oven at 105°C. The following morning, the samples were extracted for 6 h with petroleum ether (Fisher Scientific, Ottawa, ON, Canada). Following extraction the ether was allowed to evaporate overnight, after which the samples were dried in a forced air oven for 1 h at 105°C and weighed. IMF was reported as a percentage of extracted fat of the LT using the following equation:
 $$\,\%\,\,{\rm Fat=}\left[ {\left( {{\rm fat}\,{\rm weight/weight}\,{\rm of}\,{\rm sample,}\,{\rm DM}\,{\rm basis}} \right)} \right]{\times}{\rm 1}00$$
Intensive subpopulation sampling
A subpopulation of 45 animals (15 TT, 15 CT and 15 CC) was randomly selected from the test population for more intensive sampling during the finishing phase. Within each genotype five animals per vitamin A treatment were selected. At the start and end of the trial, a liver biopsy and blood sample were taken from each of the 45 animals for analysis of vitamin A concentration. The blood sample was collected via jugular venipuncture in 10 ml untreated vacutainer tubes (BD Diagnostics, Plymouth, UK) that were immediately protected from light and sent to Prairie Diagnostic Services (Saskatoon, SK, Canada) for analysis of serum retinol concentration. A custom-made biopsy instrument, with an internal diameter of 5 mm, was used to collect the liver biopsies. The animals were sedated with 0.1 mg/kg BW xylazine (Bayer, Toronto, ON, Canada) and given prophylactic analgesia via an intramuscular injection of 1.5 ml/50 kg BW Anafen (ketoprofen; Merial, Baie D’Urfe, QC, Canada). The biopsy site, located between the 12th and 13th ribs, was shaved and disinfected three times with Dovidine (Laboratoire Atlas, Inc., Montreal, QC, Canada) and 70% isopropanol (Rougier Pharma, Mirabel, QC, Canada). Subcutaneous injection of 6 ml 2% lidocaine with epinephrine (Bimeda MTC, Cambridge, ON, Canada) was then given as a local anesthetic. A small incision was made between the 12th and 13th rib with a #15 blade scalpel and the biopsy instrument inserted into the abdominal cavity for collection of the liver sample. Approximately 1 g of liver was preserved on ice and protected from light before being taken to Prairie Diagnostic Services (Saskatoon, SK, Canada) for analysis of vitamin A content using a HPLC method. The remainder of the liver biopsy was placed on ice and then frozen at −80°C until analysis for ADH1C protein quantification.
Protein quantification
Liver protein was extracted using a Total Protein Extraction Buffer kit (VWR International, Edmonton, AB, Canada) and total protein concentration in each sample determined using a MicroLowry Kit (Sigma-Aldrich, Oakville, ON, Canada). The samples were diluted for western blot analysis to 25 µg total protein.
Western blot analysis was performed to evaluate ADH1C protein expression in hepatic tissue. β-actin expression was used as an endogenous control. SDS-PAGE was performed with 10% acrylamide/bis-acrylamide resolving gels at 1 mm thick for ADH and 1.5 mm for β-actin. Electrophoresis was performed for 1 h at a constant 180 V. Protein was transferred to a Whattman Protran BA 85 nitrocellulose membrane (GE Healthcare, Little Chalfont, Buckinghamshire, UK) at 25 V for 20 min using a Trans-Blot Turbo transfer system (Bio-Rad Laboratories, Hercules, CA, USA). The membranes were blocked for 1 h with phosphate-buffered saline (PBS)+5% skim milk powder. Following this, the membranes were incubated overnight at 4°C with the primary antibody (mouse alcohol dehydrogenase antibody sc-137078; Santa Cruz Biotechnology, Inc., Dallas, TX, USA) and mouse β-actin antibody (sc-47778; Santa Cruz Biotechnology, Inc., Dallas, TX, USA) at a concentration of 0.5 µg/ml in PBS+5% skim milk+0.1% Tween. Membranes were washed three times in PBS+0.1% Tween, after which the IR 680 nm dye-tagged secondary antibody (Odyssey Goat anti-Mouse IR Dye 680, Mandel Scientific, Guelph, ON, Canada) was added at a concentration of 1 : 5000 in PBS+5% skim milk+0.1% Tween. The membranes were incubated at room temperature for 1 h and washed three times in PBS and+0.1% Tween. Membranes were visualized using a LI-COR Odyssey IR Imager (Lincoln, NE, USA) and protein expression was quantified using Odyssey version 2.0 software.
Statistical analysis
Data were analyzed using the mixed model procedure of SAS 9.3 (SAS Version 9.3; SAS Institute, Inc., Cary, NC, USA) for a three genotype×three treatment factorial design. The individual animal was used as the experimental unit. There was no significant effect of pen or date of slaughter, consequently these factors were not included in the model. A Kenward Roger adjustment was used to adjust standard errors and means were separated using Tukey’s LSD. Significance was set at P<0.05 and trends at P<0.10.
Results and discussion
Serum and liver retinol concentrations
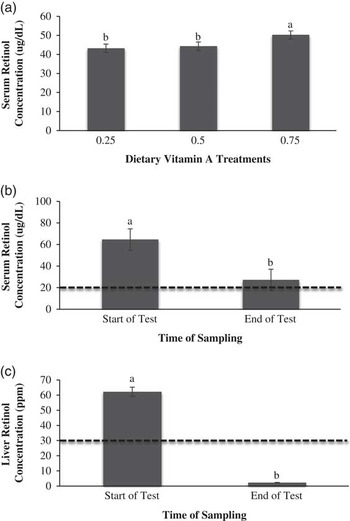
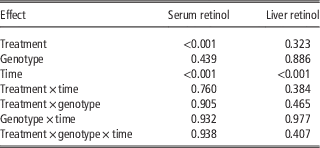
There were significant effects of vitamin A treatment level (P<0.001) and time (P<0.001) of sampling on serum retinol concentration (Table 2). Steers supplemented at 75% of NRC (1996) guidelines had higher (P<0.001) serum retinol compared with steers supplemented at 25% and 50% (Figure 1a). Several studies have reported similar findings, where steers receiving no supplemental vitamin A had lower serum retinol than steers fed the NRC recommendation level or higher (Pickworth et al., Reference Pickworth, Loerch and Fluharty2012; Ward et al., Reference Ward, McKinnon, Hendrick and Buchanan2012). Serum retinol was significantly greater (P<0.001) at the start of the trial than at the end of the trial (Figure 1b). These results are consistent with previous research on vitamin A restriction in diets fed to Angus crossbred steers (Gorocica-Buenfil et al., Reference Gorocica-Buenfil, Fluharty and Loerch2007a; Gorocica-Buenfil et al., Reference Gorocica-Buenfil, Fluharty, Bohn, Schwartz and Loerch2008). Although the levels were lower at the end of test (Figure 1b), they were maintained at levels normal for feedlot cattle (>20 μg/dl; Puls, Reference Puls1994).
Serum retinol concentrations obtained from steers in the subpopulation (a) on each of the supplemental vitamin A treatments, (b) at the start and end of the finishing, and (c) liver retinol at the start and end of the finishing. The dashed line in (b) indicates high marginal serum retinol concentrations for cattle, with values below being deficient and values above being adequate (Puls, Reference Puls1994). The dashed line in (c) indicates low marginal liver retinol levels in cattle (Puls, Reference Puls1994). Bars with differing superscripts are significantly different (P<0.05). Error bars indicate the SEM.

Effect of vitamin A treatment, ADH1C c.-64T<C genotype and time on serum and liver retinol concentrations intensive subpopulation steers during the finishing period

Regardless of treatment or genotype, liver retinol concentrations were higher (P<0.001) at the start of the finishing period relative to the end of finishing (Table 2; Figure 1c). This observation was expected as all steers were fed restricted levels of vitamin A over the 5-month feeding period and were utilizing stored vitamin A. These values are below the threshold for low marginal liver retinol stores (<30 ppm; Puls, Reference Puls1994). This is reflected in the lower serum retinol levels observed at the end of the trial as the liver is responsible for attenuating serum retinol status when the dietary level of vitamin A is restricted (Blaner and Olson, Reference Blaner and Olson1994). Pickworth et al. (Reference Pickworth, Loerch and Fluharty2012) reported liver vitamin A levels as low as 2 ppm for Angus crossbred steers following 184 days of vitamin A restriction. Although liver retinol was deficient by the end of finishing, serum concentrations were sufficient to maintain homeostasis and prevent observation of clinical vitamin A deficiency. No evidence of clinical vitamin A deficiency was detected throughout the trial.
Feedlot performance
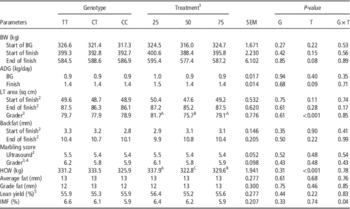
Steers that received the 25% vitamin A treatment displayed a trend for increased final finishing weight (P=0.08) and ADG (P=0.09; Table 3). The first signs of vitamin A deficiency include decreased ADG (NRC, 1996), consequently our results indicate that the cattle were not negatively affected by restricting vitamin A supplementation in the finishing ration.
Effect of ADH1C c.-64T>C genotype and vitamin A treatment on production and carcass parameters in the beef steers

BG=backgrounding; ADG=average daily gain; LT=longissimus thoracis; HCW=hot carcass weight; IMF=intramuscular fat.
A,B,CMeans within the same row with differing superscripts are significantly different (P<0.01).
1 Vitamin A supplemented as a percent of 2200 IU/kg dry matter (NRC, 1996).
2 Measured by ultrasonography.
3 Measured by a Canadian Beef Grading Agency certified grader.
4 Measured using the USDA ten-point scale where 1.0 is devoid of marbling and 10.0 is abundant.
5 Calculated according to the Canadian Beef Grading Agency certified grader equation: 57.96−0.027 HCW (kg)+0.202 rib-eye area (cm2) −0.703 average fat (cm).
Carcass characteristics
Area of the LT muscle, as determined by a Canadian Beef Grading Agency certified grader was significantly greater (P<0.001) for steers receiving the 25% and 75% compared with the 50% vitamin A treatment (Table 3). However, the ultrasound measurement of LT area was not significantly different between treatments (P=0.28). The HCW was also significantly affected by vitamin A treatment (P<0.001) again with the steers on the 25% level having the heaviest carcass. Previous research has not found an association between restricted vitamin A levels in beef cattle diets with performance parameters such as ADG or final finishing weight (Gorocica-Buenfil et al., Reference Gorocica-Buenfil, Fluharty, Bohn, Schwartz and Loerch2008; Pickworth et al., Reference Pickworth, Loerch and Fluharty2009; Bryant et al., Reference Bryant, Wagner, Tatum, Galyean, Anthony and Engle2010).
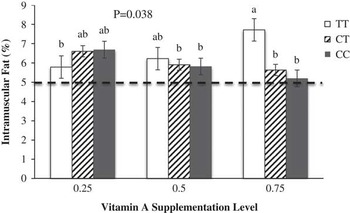
There was no main effect of vitamin A treatment on marbling score of the LT muscle. These results are not consistent with previous research where increased marbling score was reported when vitamin A was restricted in the diet of finishing beef steers (Gorocica-Buenfil et al., Reference Gorocica-Buenfil, Fluharty, Reynolds and Loerch2007b; Gibb et al., Reference Gibb, Van Herk, Mir, Loerch and McAllister2011; Ward et al., Reference Ward, McKinnon, Hendrick and Buchanan2012). In our study, 84% of the animals graded Canada AAA (USDA Choice) suggesting cattle were fed past the point of being able to detect treatment differences in IMF. There was, however, a significant genotype×treatment interaction (P=0.04) observed for ether extractable lipid from the LT muscle (Table 3; Figure 2). Within the 75% vitamin A supplementation treatment, TT steers had higher IMF relative to CT and CC animals. This pattern was not observed for the two lower vitamin A supplementation levels where there was no effect of genotype.
Intramuscular fat of the longissimus thoracis muscle of TT, CT and CC steers on each of three vitamin A treatments (25%, 50% and 75% of National Research Council recommendation of 2200 IU vitamin A/kg dry matter). The dashed line indicates the cut-off for carcass grades of AA and AAA, with bars above the line grading AAA. Bars with differing subscripts are significantly different (P<0.05). Error bars indicate SEM.

Ward et al. (Reference Ward, McKinnon, Hendrick and Buchanan2012) reported that unsupplemented TT steers had 24.4% higher IMF than TT steers supplemented with NRC (1996) recommended levels of vitamin A, and 22.9% greater than CC unsupplemented steers. In our study, there was sufficient variation in IMF within the steers allocated to the 75% vitamin A treatment that we were able to observe the previously reported interaction (Figure 2). This supplementation level of vitamin A is closest to the NRC (1996) recommendation that is associated with lower marbling (Pickworth et al., Reference Pickworth, Loerch and Fluharty2012; Ward et al., Reference Ward, McKinnon, Hendrick and Buchanan2012). This may explain why we still have variation and can observe the expected interaction at the 75% supplementation level of vitamin A. A possible explanation why TT animals have higher IMF is that they have increased messenger RNA (mRNA) expression of ADH1C relative to CC animals. This observation is important as the C allele removes a binding site for CCAAT/enhancer-binding protein α (Ward et al., Reference Ward, McKinnon, Hendrick and Buchanan2012) leading to reduced ADH1C production. Increased production of ADH1C leads to a higher conversion rate of ROL (vitamin A) to RAL, and under vitamin A deficient conditions the activity of aldehyde dehydrogenase (the enzyme that oxidizes RAL to RA) is increased threefold (Napoli, Reference Napoli1996). Hence TT steers will generate more RA from the higher amount of RAL produced compared with CT and CC animals resulting in increased IMF deposition as discussed below.
It is unclear why in the current trial TT animals at the two lower levels of vitamin A supplementation did not exhibit increased IMF relative to the CC and CT cattle. It should be noted again that 84% of the animals graded Canada AAA (USDA Choice), indicating a lack of variation in IMF and points to the possibility that most of the animals were finished beyond the point where a genotypic effect would have been observed. The steers where shipped when the pen averaged 610 kg and perhaps a fixed number of days on feed would have been a more suitable endpoint to observe the interaction between ADH1C genotype and vitamin A supplementation level on IMF, especially at the lower levels. Another important difference in the Ward et al. (Reference Ward, McKinnon, Hendrick and Buchanan2012) study was a priming of the steers with a vitamin A deficient backgrounding diet before the finishing period, which was performed to reduce liver retinol stores and ensure that variation between treatment and genotype would be observed. In the current trial, steers were fed a commercial backgrounding ration for 66 days containing 1.7-fold the NRC recommendation of 2200 IU/kg diet DM (NRC, 1996).
Protein quantification
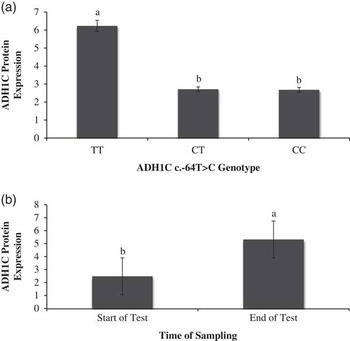
Genotype (P=0.02) and time (P=0.03) had an effect on hepatic ADH1C protein expression (Figure 3). The ADH1C protein levels were significantly higher (P=0.02) in TT animals compared with CT and CC animals. The C allele removes a binding site motif for the transcription factor CCAAT/enhancer-binding protein α (Chekmenev et al., Reference Chekmenev, Haid and Kel2005), resulting in reduced mRNA abundance in CC steers (Ward et al., Reference Ward, McKinnon, Hendrick and Buchanan2012). Previously, Ward et al. (Reference Ward, McKinnon, Hendrick and Buchanan2012) reported an additive effect of ADH1C mRNA expression in hepatic tissue with TT steers displaying significantly greater expression than CC steers. They hypothesized that increased expression of ADH1C would translate into higher ADH1C enzyme production. The results of our study support this mechanism.
Relative expression of ADH1C from hepatic tissue (a) obtained from steers with differing ADH1C c.-64T>C genotypes and (b) measured at the start and end of the finishing period. Bars with differing subscripts are significantly different (P<0.05). Error bars indicate the SEM.

Increased hepatic ADH1C in the current trial suggests an increased conversion of ROL to RAL (Duester, Reference Duckett, Wagner, Owens, Dolezal and Gill2000) for TT animals. As indicated earlier, under a vitamin A restricted condition, the activity of aldehyde dehydrogenase is increased (Napoli, Reference Napoli1996), resulting in the further oxidation of RAL to RA. Retinaldehyde inhibits adipogenesis, whereas RA promotes adipogenesis (Ziouzenkova et al., Reference Ziouzenkova, Orasanu, Sharlach, Akiyama, Berger, Viereck, Hamilton, Tang, Dolnikowski, Vogel, Duester and Plutzky2007). Therefore, the higher ADH1C levels in hepatic tissue for TT steers should result in a higher conversion rate of ROL to RAL, and further still to RA, resulting in increased stimulation of adipogenesis (Ward et al., Reference Ward, McKinnon, Hendrick and Buchanan2012). This was observed in steers on the 75% vitamin A treatment level.
Alcohol dehydrogenase 1 C levels in hepatic tissue were significantly higher (P=0.03) at the end of test (Figure 3). It is possible that the significant reduction in liver retinol observed at the end of test resulted in increased ADH1C activity, and subsequently increased enzyme synthesis. Measurement of RAL and RA levels in adipose tissue should be examined to further evaluate the proposed mechanism.
Conclusions
Data obtained on IMF deposition and protein quantification in this study indicate that animals TT at ADH1C c.-64T>C should have enhanced IMF deposition in the LT muscle under vitamin A restriction. However, as the majority of steers in the current trial graded Canada AAA, variation between treatments and genotypes was not observed at the 25% and 50% inclusion levels. Therefore, the determination of an optimal vitamin A supplementation level was not possible. Before this research can be applied to the beef industry, further investigation should look at the impact of finishing length and thus, growth stage, on the interaction between ADH1C genotype and vitamin A supplementation level. The potential impact of hormonal implants on the effect of this interaction on carcass traits should also be evaluated. Measurement of RAL and RA levels in adipose tissue should be examined to further understand the nutrigenetic mechanism of vitamin A restriction on IMF deposition in beef cattle.
Acknowledgments
This research was funded by the Saskatchewan Ministry of Agriculture and the Canada-Saskatchewan Growing Forward bi-lateral agreement with in-kind support by Poundmaker Ag Ventures. Special thanks to Jillian Duncombe and the University of Saskatchewan’s Beef Cattle Research Facility staff for animal care and data collection.