Metabolic syndrome (MetS) is a cluster of metabolic abnormalities that are interlinked and significantly increase the risk of developing cardiovascular disease, type 2 diabetes mellitus, chronic kidney disease and other chronic non-communicable diseases. Moreover, it is increasing worldwide and imposing a substantial burden on global health systems(1–Reference Marott, Nordestgaard and Tybjærg-Hansen4). Epidemiological research indicates that the prevalence of MetS varies across different regions, with rates in Africa(Reference Okafor5), Central America(Reference Wong-McClure, Gregg and Barceló6), Europe(Reference van Vliet-Ostaptchouk, Nuotio and Slagter7), the Middle East(Reference Sliem, Ahmed and Nemr8), South America(Reference Márquez-Sandoval, Macedo-Ojeda and Viramontes-Hörner9), South Asia(Reference Aryal and Sharada10) and Asia Pacific(Reference Ranasinghe, Mathangasinghe and Jayawardena11) ranging from 12·5–62 %, 23·0–35 %, 11·6–26 %, 13·6–36 %, 18·8–43 %, 26·1 % and 11·9–37 %, respectively. These figures underscore the significant threat that MetS poses to both economically developed and developing regions. Furthermore, the prevalence of MetS is influenced by age and sex(Reference Pucci, Alcidi and Tap12). In China, the increasing trend of MetS incidence, estimated at approximately 31·1 %, identifies women, individuals above 45 years and urban dwellers as high-risk cohorts(Reference Yao, Bo and Zhao13). Consequently, prioritising the prevention and management of MetS is imperative.
The pathogenesis of MetS is intricate and remains incompletely understood. Historically, insulin resistance and visceral obesity have been posited as central mechanisms in the development of MetS(Reference Jakubiak, Osadnik and Lejawa14,Reference Fahed, Aoun and Bou Zerdan15) . Nevertheless, when juxtaposed with the current diagnostic criteria for MetS, it appears that insulin resistance does not sufficiently account for other metabolic derangements associated with MetS, in addition to hyperglycaemia. Recent evidence underscores visceral obesity as a pivotal trigger for the activation of numerous pathways implicated in MetS, excessive free fatty acids in visceral adipose tissue accumulate in the liver, enhancing the liver’s gluconeogenesis and adipogenesis activities, increasing the content of triacylglycerol in the liver, reducing the extraction of insulin by the liver, leading to an increase in insulin resistance and subsequently triggering a series of metabolic disorders(Reference Matsuzawa, Funahashi and Nakamura16,Reference Pekgor, Duran and Berberoglu17) . Given its paramount role in the aetiology of MetS, precise and objective assessment of visceral obesity is instrumental in gauging an individual’s susceptibility to MetS. While waist circumference (WC) and body mass index (BMI) are commonly used to measure obesity due to their ease of measurement, these metrics have limitations. WC fails to distinctly differentiate between subcutaneous and visceral fat, whereas BMI does not discriminate between lean body mass and adiposity(Reference Weber, Leonard and Shults18). Therefore, we need to explore new indicators to assess visceral obesity and predict MetS.
Visceral fat area (VFA) has emerged as a reliable indicator for assessing visceral fat accumulation in the human body. Currently, the commonly used methods for detecting VFA include computed tomography (CT), dual-energy X-ray absorptiometry and bioelectrical impedance analysis (BIA). CT and dual-energy X-ray absorptiometry are considered the gold standards for detecting VFA; however, they have limitations such as radiation exposure, high cost and cumbersome equipment portability, which restrict their widespread application. BIA, which infers body composition on the basis of the principle that different tissue components exhibit different resistances when an electric current passes through them, is gaining popularity owing to its simplicity, economy, convenience, safety, strong subject acceptance and good measurement repeatability. Previous studies have shown that the VFA measured by CT and BIA have strong reliability and correlation(Reference Nagai, Komiya and Mori19,Reference Gao, Liu and Ding20) . Although some scholars believe that BIA tends to underestimate the VFA compared with CT(Reference Lee, Hsu and Hsieh21,Reference Park, Lee and Lee22) , BIA has been widely popularised in recent years because of its advantages.
In recent years, many countries have utilised epidemiological research methods to investigate the optimal threshold value of VFA for predicting MetS. However, due to differences in sex, ethnicity, race and age groups, there is currently no unified threshold applicable to the entire population(Reference Bennett, Prado and Heymsfield23), and most of the studies are focused on adults, with a lack of research on middle-aged and elderly people. Owing to its simplicity, cost-effectiveness, non-invasiveness and absence of radiation exposure, BIA is extensively employed in clinical settings. Nonetheless, there is a paucity of evidence in China regarding the use of BIA to predict MetS in middle-aged and elderly populations. This study, which is part of the ‘Natural Population Cohort of West China Hospital of Sichuan University’, employed BIA to evaluate VFA in middle-aged and older adults. This study aimed to compare the predictive accuracies of the VFA, WC and BMI for identifying MetS (excluding WC) and sought to establish the optimal threshold for the VFA in predicting MetS. This research contributes to identifying high-risk groups for middle-aged and elderly individuals with MetS through BIA, thereby promoting healthy ageing.
Methods
Subjects
This study screened individuals aged 45 years and above from the three locations of Mianzhu, Longquanyi and Pidu in Sichuan Province from 2019 to 2021 as research subjects. A body composition analyser based on the BIA principle was used to determine the VFA. The inclusion criteria for the study were as follows: (1) participants from three locations involved in the ‘Natural Population Cohort of West China Hospital of Sichuan University’ project; (2) aged 45 years or older; (3) provided complete data from questionnaire surveys, physical measurements and laboratory examinations; and (4) signed an informed consent form. The exclusion criteria were as follows: individuals who could not stand independently, those with a pacemaker or heart stent and participants who could not undergo a body composition test. This study was conducted according to the guidelines laid down in the Declaration of Helsinki, and all procedures involving human subjects were approved by the Biomedical Ethics Review Committee of West China Hospital of Sichuan University (NO. 2021–752). At the same time, the study was permitted to exempt subjects from informed consent and registered with Chinese Clinical Trials Registry (URL: https://www.chictr.org.cn/index.html. Registration number: ChiCTR2300075451).
Questionnaire surveys
Data were derived from the baseline questionnaire of the natural population cohort, which was refined and developed following three rounds of expert consultation. The questionnaire was administered individually by trained and qualified investigators to gather information. The content of the questionnaire mainly included age, sex, education level, marital status, occupation type, smoking, drinking, exercise, sleep, personal disease history, family history of diseases and psychological status. Behavioural and lifestyle factors were evaluated via methods described in our previous study(Reference Pu, Lin and Wei24). Weekly exercise activity was calculated by corresponding metabolic equivalent (MET) coefficients according to the following formula: MET coefficient of exercise pattern × duration (hours) × frequency (days/week). MET of exercise patterns were sourced from reference values for the energy expenditures of physical activities of healthy Chinese adults(Reference Qiu, Yang and Lu25). Total exercise levels were assessed by combining separate scores for different activities.
Physical examination
The physical examination included assessments of height, weight, WC and blood pressure. Height and weight were measured with an electronic height scale. Height was recorded in centimetres with an accuracy of 0·1 cm, whereas weight was recorded in kilograms, which was also precise to 0·1 kg. WC, defined as the horizontal perimeter at the smallest waist segment located between the lower ribcage (costal margin) and the top of the hip bone (iliac crest), was measured via a flexible tape measure positioned snugly without compressing the skin, ensuring an accuracy of 0·1 cm. Blood pressure readings were acquired via an automated sphygmomanometer applied to both the left and right arms. Each arm underwent triplicate measurements with a 30-s interval, from which the mean value was calculated for subsequent analysis.
Laboratory test
Fasting venous whole blood was drawn from the participants and allowed to stand for 2 h. The mixture was then centrifuged at 2000 × g at 4°C for 15 min, after which the serum was isolated. Fasting blood glucose (FBG), high density lipoprotein cholesterol (HDL-C), triacylglycerol, low density lipoprotein cholesterol (LDL-C) and total cholesterol (TC) levels were analysed via a Beckman Coulter AU5800 automatic biochemical analyser (Beckman).
Visceral fat area measurement
An InBody770 Biospace body composition analyser (InBody Co., Ltd), which operates on the BIA principle, was used to measure VFA. Prior to testing, the participants were instructed to remove footwear, socks, jackets, mobile phones and any metal objects. They were required to stand barefoot on the instrument’s electrode footprint, record their weight and then grasp the hand electrode rod with both hands while extending their arms straight out. The arms should be positioned at a 15-degree angle relative to the torso on each side of the body. The participants were advised to remain motionless and relaxed until the measurement outcomes appeared on the screen, at which point the VFA value could be obtained.
Definition of metabolic syndrome
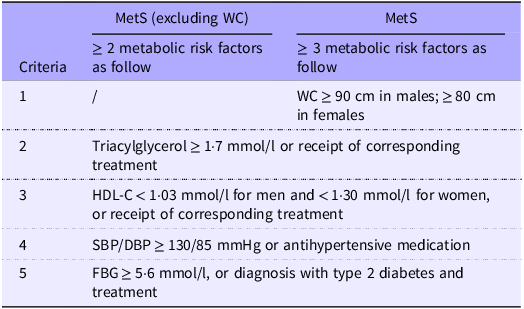
To maximise the inclusion of participants with MetS, we adopted the 2005 National Cholesterol Education Program-Adult Treatment Panel III (NCEP-ATP III) criteria(Reference Grundy, Cleeman and Daniels26) for disease diagnosis and used the WC cut-off value specific to the Asian population as specified in these criteria. For individuals without considering WC, a diagnosis of MetS requires meeting at least two of the specified criteria. Conversely, when WC is included, the diagnosis must fulfil three or more criteria. To eliminate interference and ensure a clear comparison between VFA, WC and BMI in predicting MetS, we established a diagnostic criterion for MetS (excluding WC). The specific evaluation criteria are presented in Table 1.
Evaluation criteria for MetS (including or excluding WC)

MetS, metabolic syndrome; WC, waist circumference; HDL-C, high density lipoprotein cholesterol; SBP, systolic blood pressure; DBP, diastolic blood pressure; FBG, fasting blood glucose; /, exclusion of this standard.
Quality control
Investigators underwent uniform training and assessment by researchers prior to the investigation to ensure survey accuracy and consistency. Prior to formal data collection, the body composition analyser underwent thorough quality control and calibration, and fixed operators were assigned to conduct VFA measurements using the analyser throughout the study. The collected body composition data were examined manually and computerised. When variables associated with the assessment of MetS were entered incorrectly or were missing, the subjects were contacted for retesting. When retesting was not possible, the subjects were excluded from the study.
Statistical analysis
The data were analysed via SPSS version 26.0 for Windows (SPSS Inc.). Continuous variables are presented as the means (standard deviations) or medians (interquartile ranges) according to the normality test results. Categorical variables are presented as frequencies and percentages (%). Intergroup differences for continuous variables were analysed via the Mann–Whitney U test or the Kruskal-Wallis test, whereas those for categorical variables were assessed via the χ2 test. Spearman’s correlation coefficient was used to examine the relationships between VFA and metabolic risk factors such as BMI, WC and FBG. Receiver operating characteristic curve analysis was used to compare the predictive value of VFA, WC and BMI for MetS in middle-aged and elderly people. The Youden index was used to determine the optimal predictive cut-off point. A value of P < 0·05 was considered statistically significant.
Results
Baseline characteristics of the participants
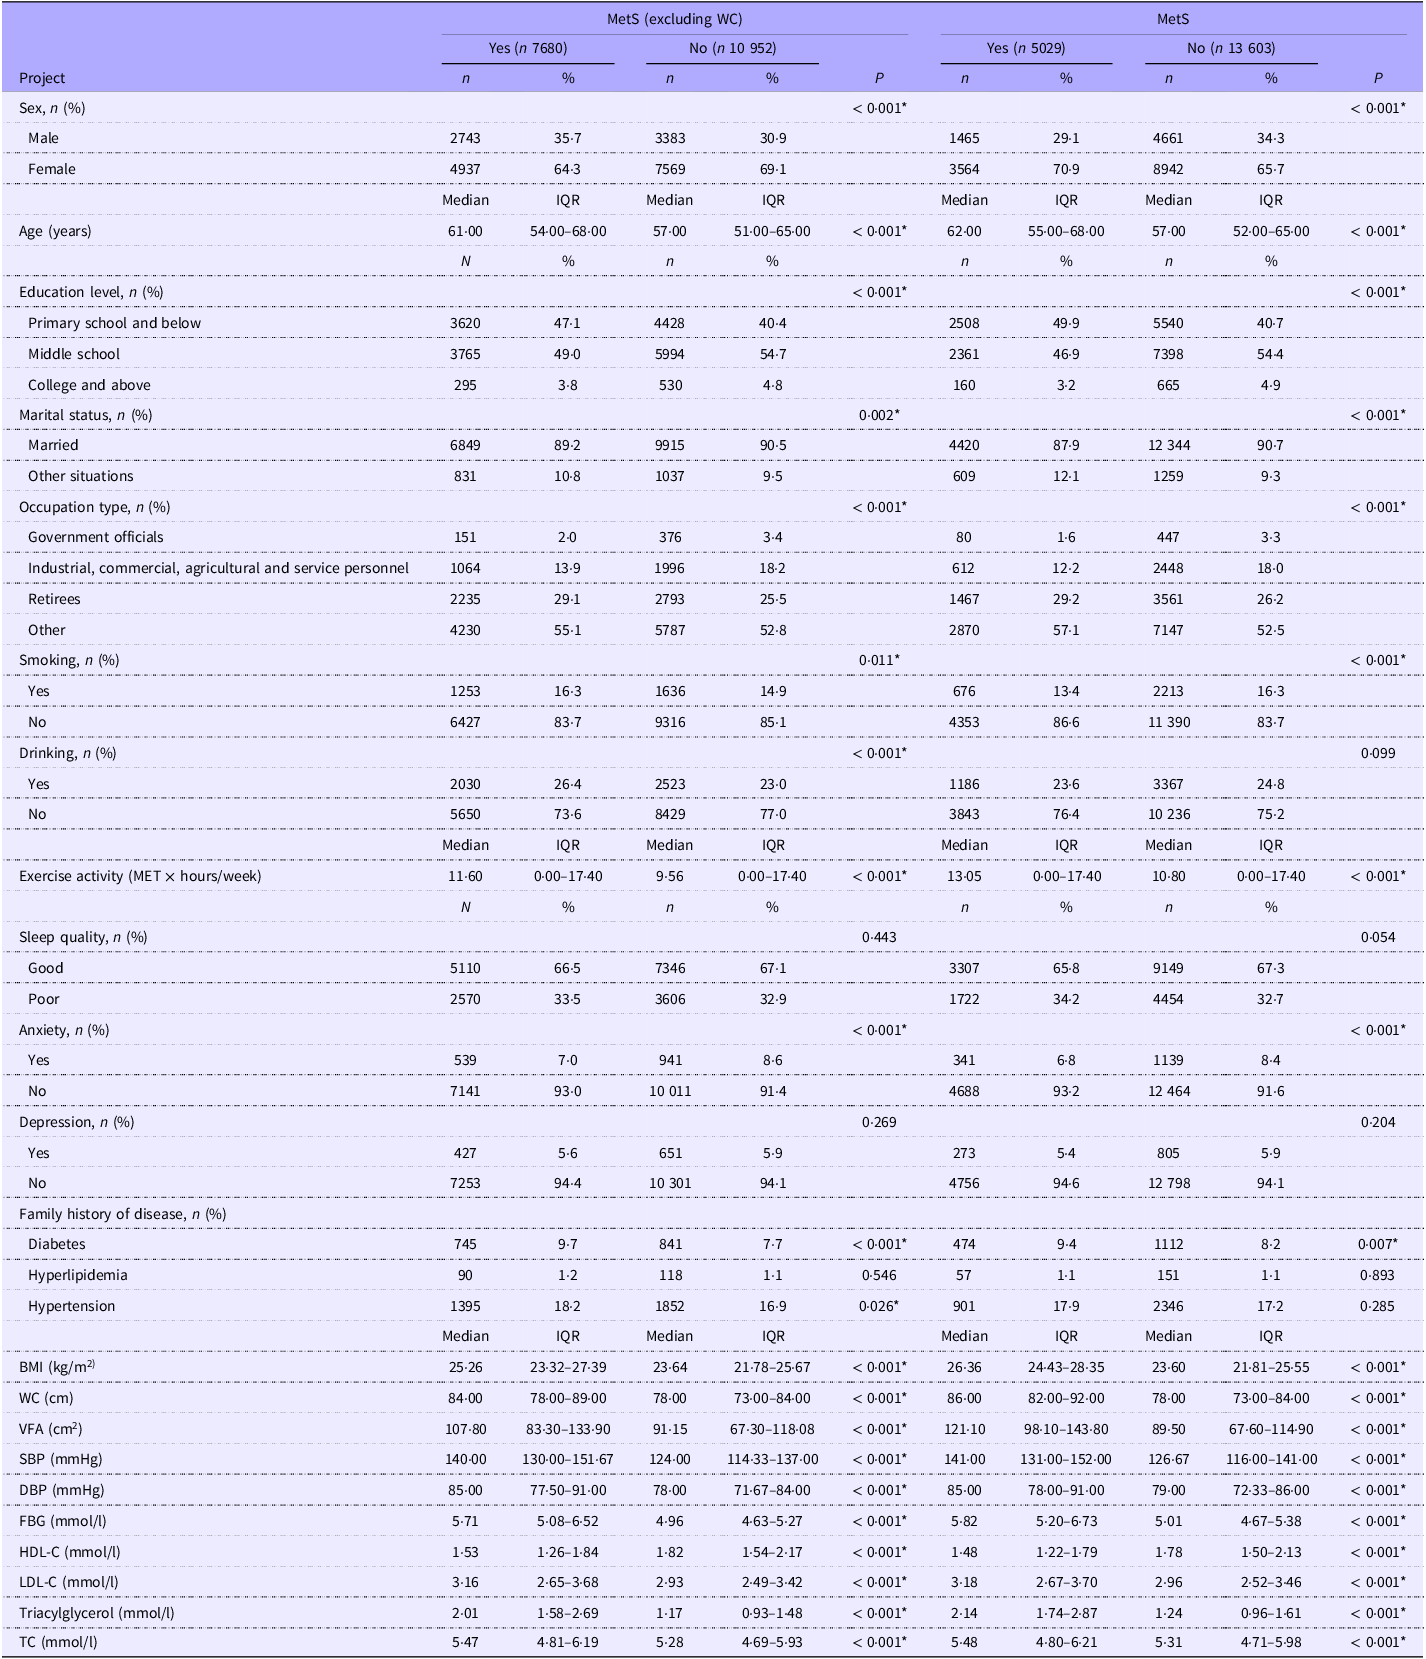
This study included 18 632 participants, of which 6126 (32·9 %) were men and 12 506 (67·1 %) were women. Under the two diagnostic criteria, the prevalence of MetS (excluding WC) in the total population was 41·2 % (n 7680). In contrast, the prevalence under the full criteria (including WC) was 27·0 % (n 5029), resulting in a difference of 14·2 percentage points. These results indicate that when all standard MetS diagnostic components (including WC) are applied, the overall disease prevalence is significantly lower (McNemar’s test: P < 0·001). A comparative analysis between those with and without MetS (excluding WC) revealed significant disparities in several sociodemographic and clinical characteristics: sex, age, educational attainment, marital status, occupation, BMI, WC, VFA, SBP, DBP, FBG, HDL-C, LDL-C, triacylglycerol, TC, smoking habits, alcohol consumption, physical activity levels, anxiety and family histories of diabetes and hypertension. The comparison between the MetS and non-MetS groups revealed significant differences in all the aforementioned variables except alcohol consumption and family history of hypertension (Table 2).
Baseline characteristics of people with MetS (excluding or including WC)

MetS, metabolic syndrome; WC, waist circumference; MET, metabolic equivalent; BMI, body mass index; VFA, visceral fat area; SBP, systolic blood pressure; DBP, diastolic blood pressure; FBG, fasting blood glucose; HDL-C, high density lipoprotein cholesterol; LDL-C, low density lipoprotein cholesterol; TC, total cholesterol.
*P < 0·05.
Correlations between visceral fat area and metabolic risk factors
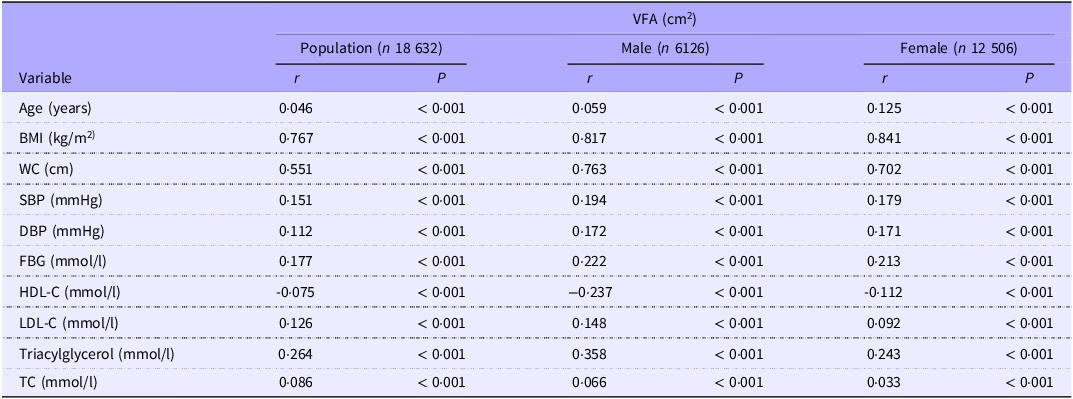
VFA was positively associated with age, BMI, WC, SBP, DBP, FBG, LDL-C, triacylglycerol and TC across both the general population and individuals stratified by sex (P < 0·001). Conversely, VFA was negatively correlated with HDL-C (P < 0·001). Notably, VFA had the strongest correlations with BMI and WC among all the risk factors. For the general population, the correlation coefficients for BMI and WC with VFA were 0·767 and 0·551, respectively. In males, these coefficients were 0·817 for BMI and 0·763 for WC, whereas in females, they were 0·841 for BMI and 0·702 for WC. Although the remaining metabolic risk factors were associated with VFA, the correlation was weak, and the correlation coefficient was less than 0·4 (Table 3).
Correlations between VFA and metabolic markers

VFA, visceral fat area; r, correlation coefficient; BMI, body mass index; WC, waist circumference; SBP, systolic blood pressure; DBP, diastolic blood pressure; FBG, fasting blood glucose; HDL-C, high density lipoprotein cholesterol; LDL-C, low density lipoprotein cholesterol; TC, total cholesterol.
Association between visceral fat area and metabolic syndrome (with and without waist circumference criteria)
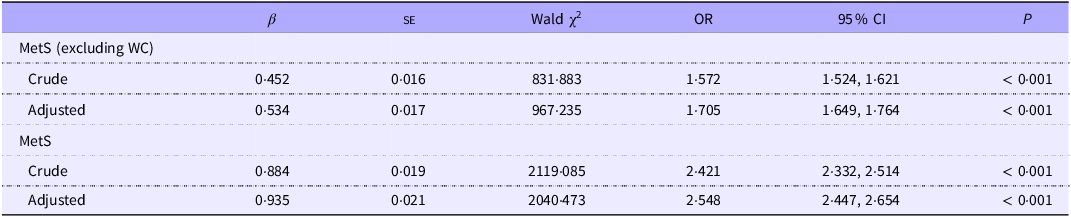
In the general population, VFA was significantly positively associated with MetS development. For MetS (excluding WC), each 1 sd increase in VFA was associated with a 1·572-fold higher risk in the unadjusted model and a 1·705-fold higher risk in the confounder-adjusted model. Similarly, for MetS (including WC), these associations were even stronger: a 1 sd increase in VFA predicted a 2·421-fold increased risk in the unadjusted model and a 2·548-fold increased risk in the confounder-adjusted model (Table 4).
Association between VFA and MetS (with and without WC criteria)

VFA, visceral fat area; MetS, metabolic syndrome; WC, waist circumference.
Crude: unadjusted; Adjusted: adjusted for sex, age, marital status, educational level, occupation type, smoking and drinking status, activity level, sleep quality, anxiety and depression status, family history.
Predictive effect of visceral fat area, waist circumference and BMI for metabolic syndrome (excluding waist circumference)
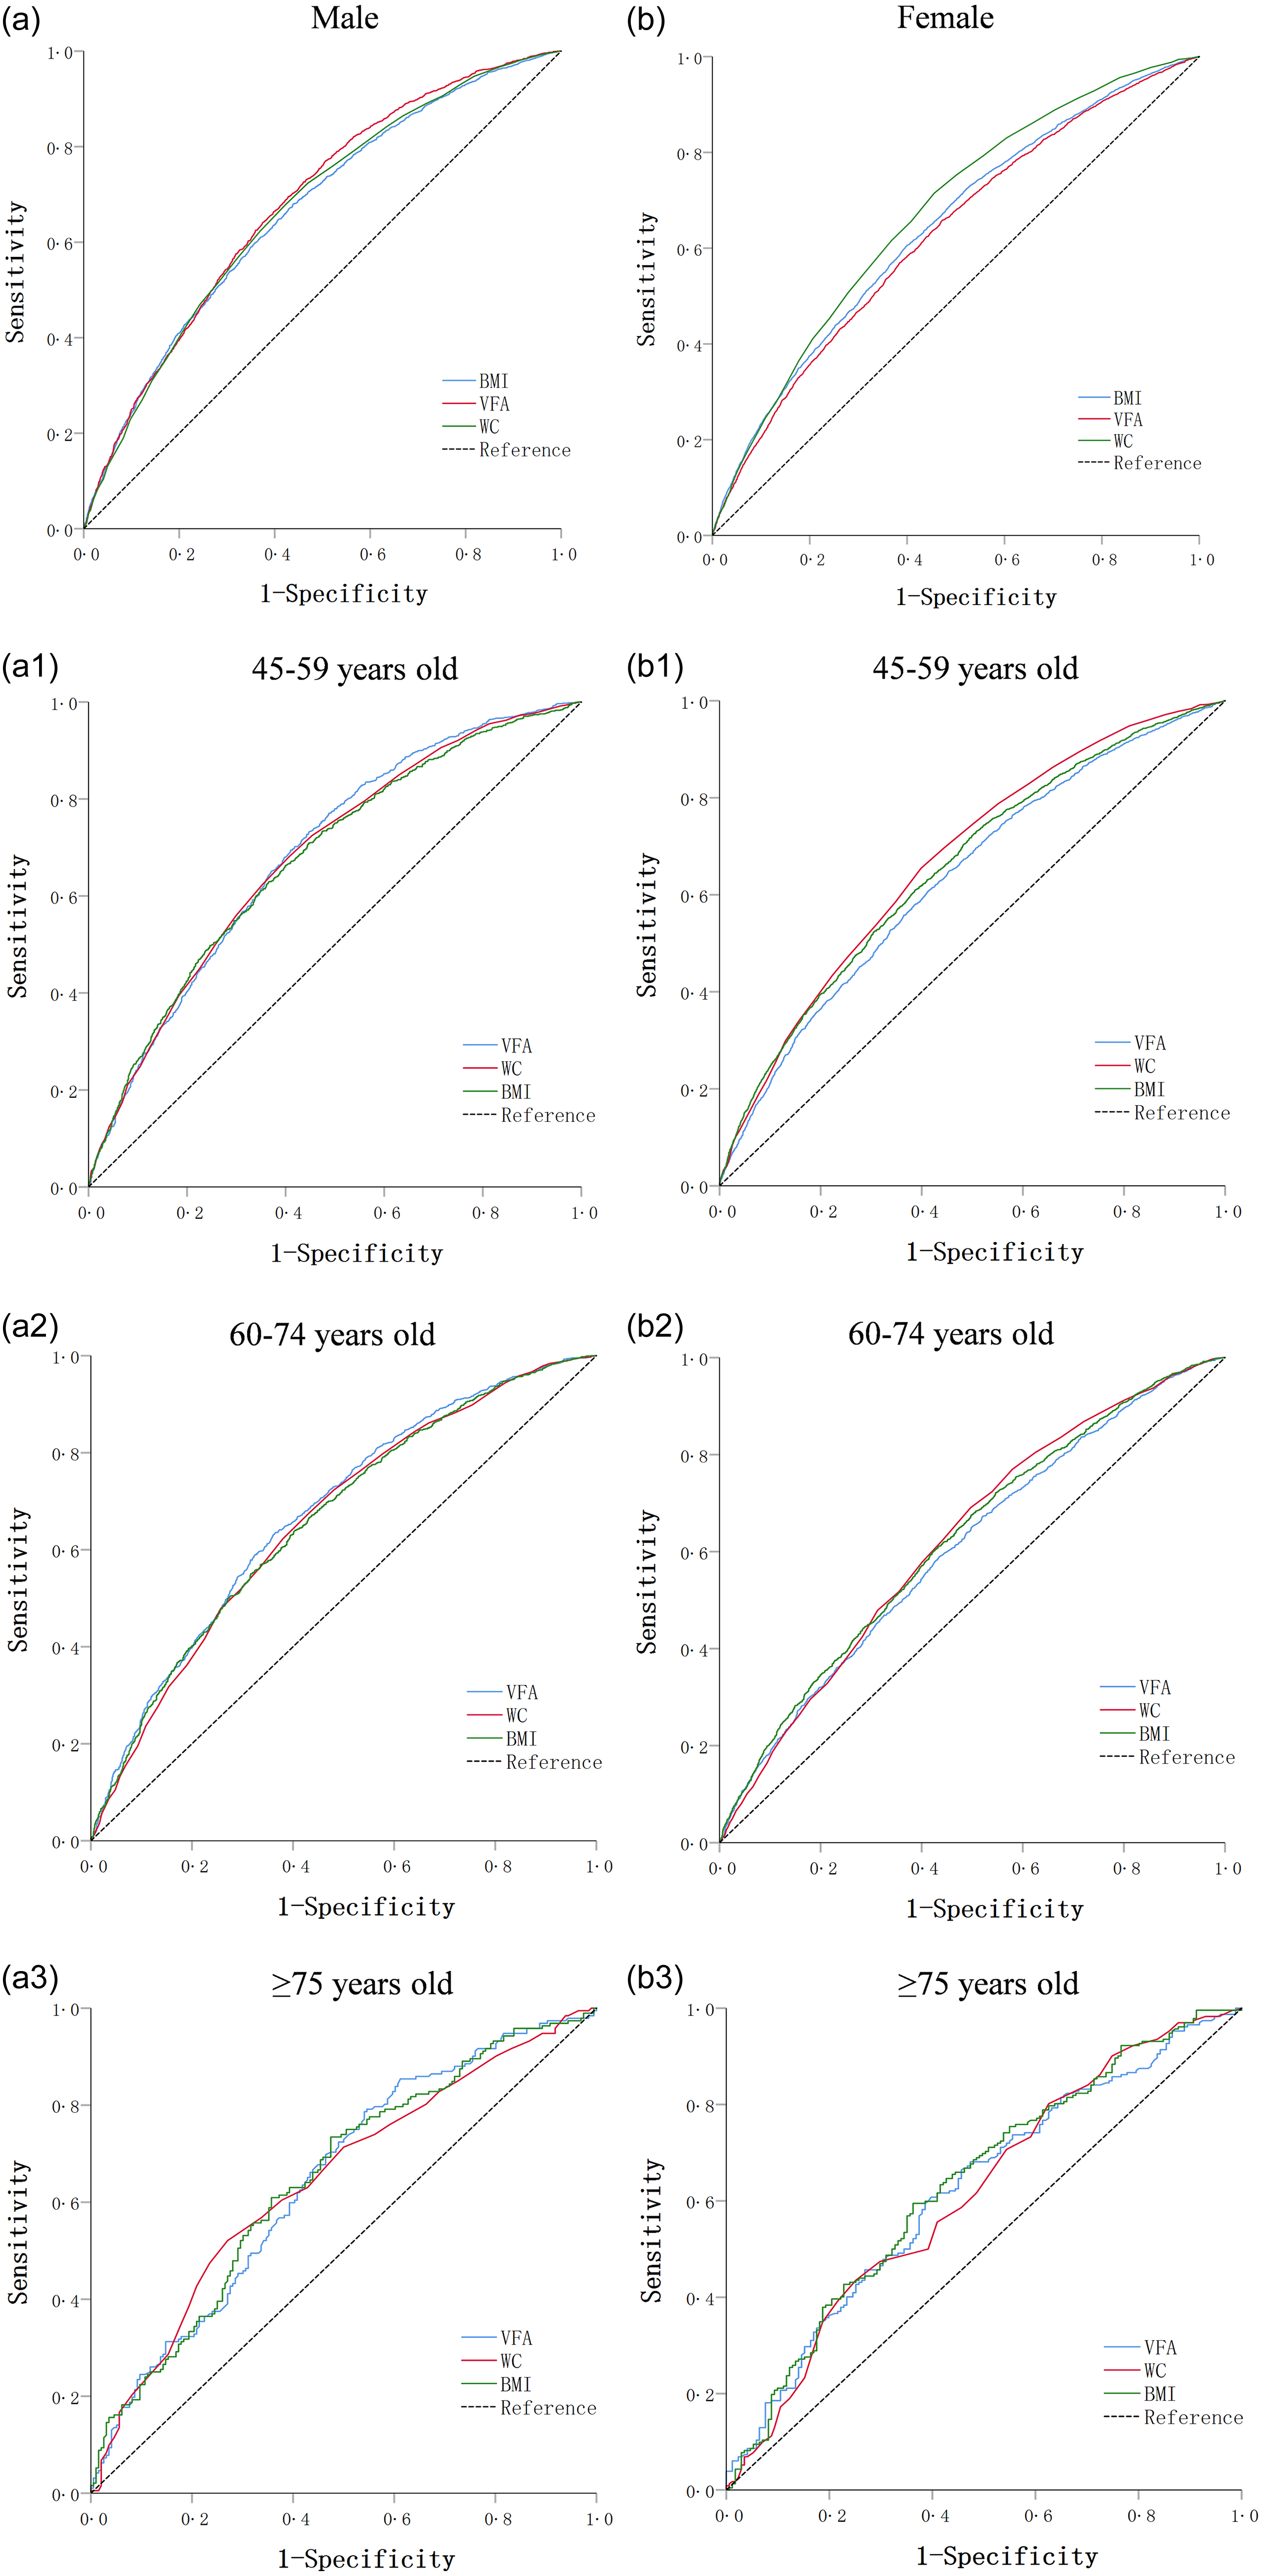
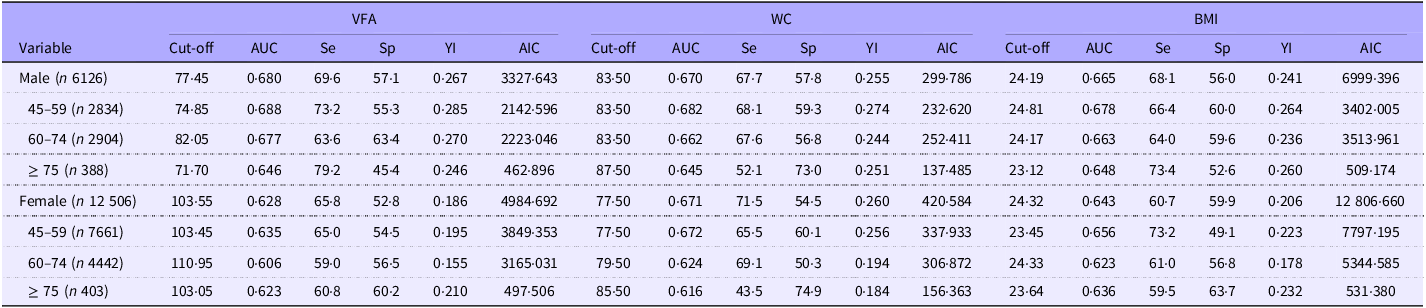
Figure 1 illustrate the receiver operating characteristic curves for the VFA, WC and BMI by sex and age in predicting the presence of MetS (excluding WC). The area under curve (AUC) of VFA in males was greater than that of WC and BMI (0·680 (95 % CI 0·667, 0·693), 0·670 (95 % CI 0·657, 0·684) and 0·665 (95 % CI 0·652, 0·679), respectively), whereas the AUC of VFA in females was lower than that of WC and BMI (0·628 (95 % CI 0·618, 0·638), 0·671 (95 % CI 0·661, 0·680) and 0·643 (95 % CI 0·633, 0·653), respectively). Stratified analysis by sex across different age groups revealed that the results for males and females aged 45–75 years were consistent with those of the total population. Notably, discrepancies were observed in individuals aged 75 years and older, where the AUC for VFA were greater than that of WC but lower than that of BMI in both sexes. The details of the optimal cut-off values, sensitivity, specificity, Youden index and Akaike information criterion (AIC) of VFA, WC and BMI are shown in Table 5.
ROC curves of BMI/VFA/WC for the prediction of MetS (excluding WC). Compared with WC and BMI, VFA had the highest AUC value in males (a). In 45–59 years old males (a1) and 60–74 years old males (a2), the VFA exhibited the highest AUC value. Among males aged ≥ 75 years (a3), the VFA value was greater than that of WC but lower than that of BMI. In females (b), the AUC value of VFA was lower than those of WC or BMI. In 45–59 years old females (b1) and 60–74 years old females (b2), VFA presented the lowest AUC value. Among females aged ≥ 75 years (b3), the VFA value was greater than that of WC but lower than that of BMI. ROC, receiver operating characteristic; VFA, visceral fat area; WC, waist circumference; MetS, metabolic syndrome.

Predictive value of VFA, WC and BMI by sex and age for MetS (excluding WC)

VFA, visceral fat area; WC, waist circumference; BMI, body mass index; MetS, metabolic syndrome; AUC, area under curve; Se, sensitivity; Sp, specificity; YI, Youden index; AIC, Akaike information criterion.
The unit of Se and Sp is %.
Optimal cut-off value of visceral fat area for metabolic syndrome
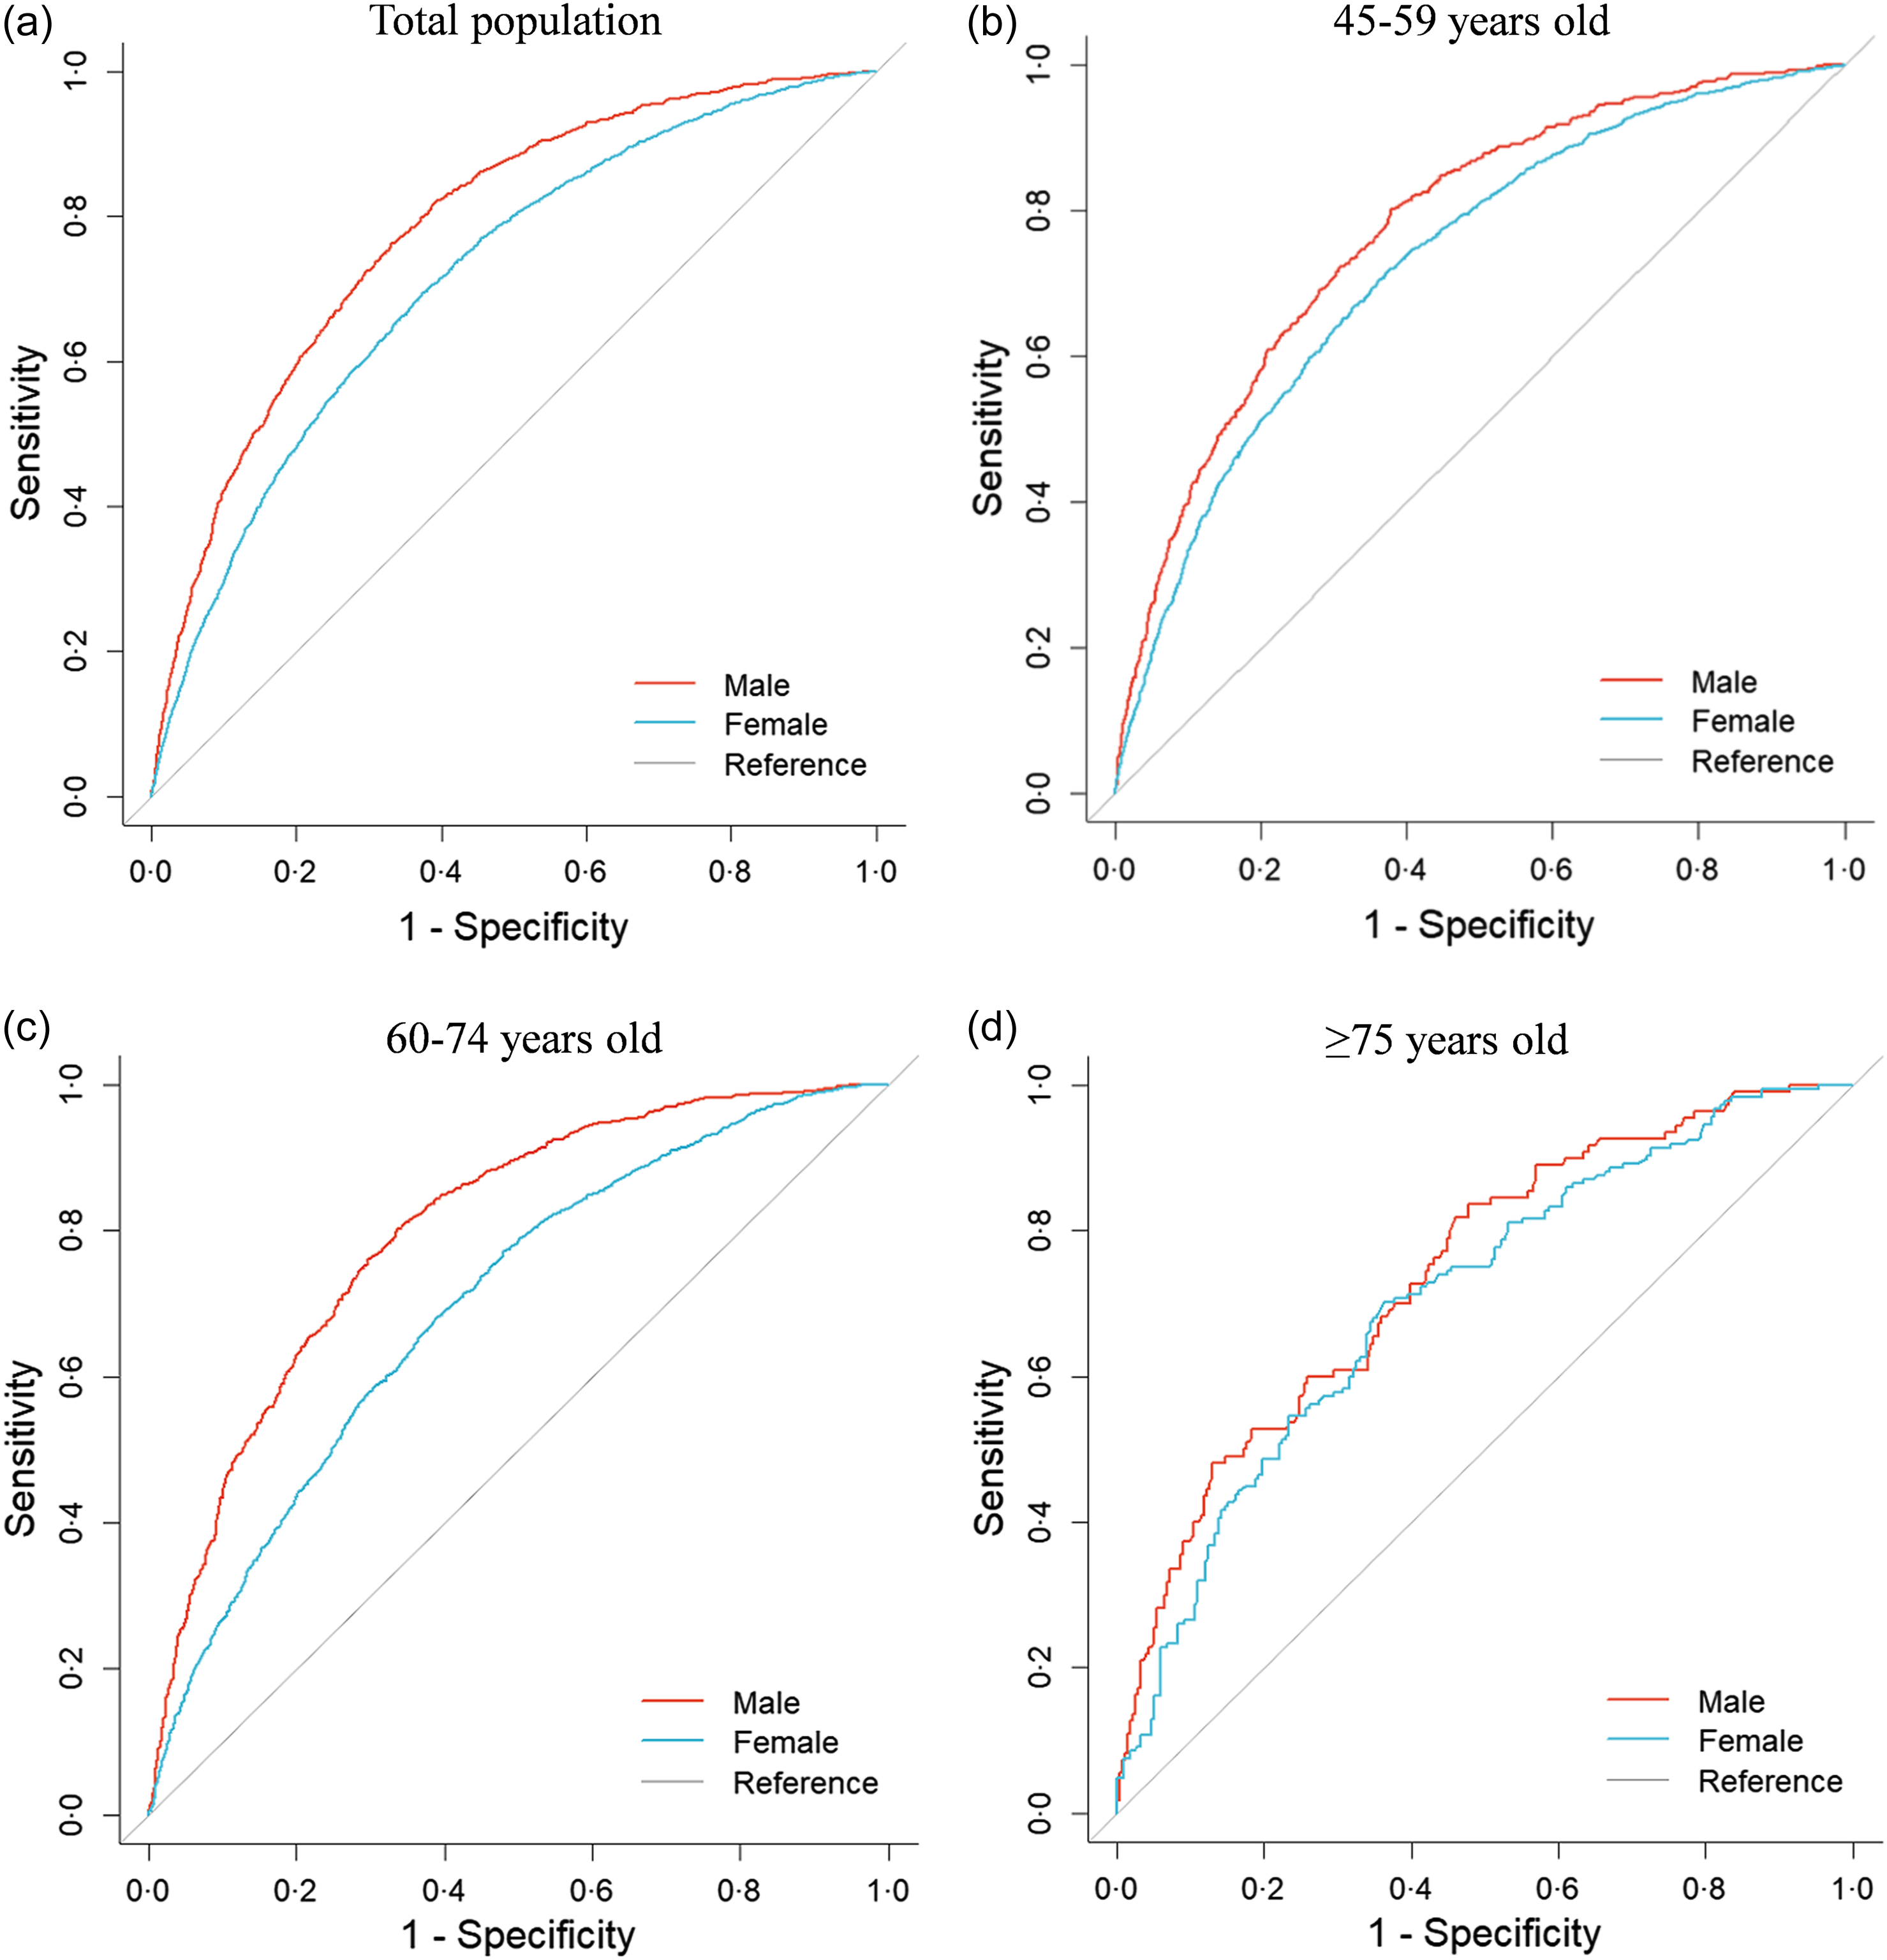
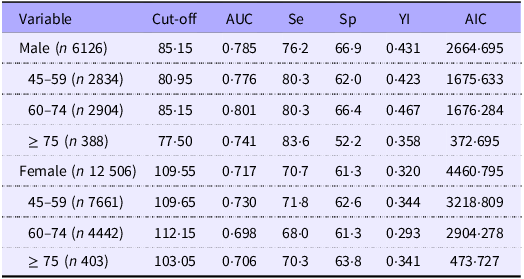
Figure 2 show the receiver operating characteristic curves for the VFA by sex and age in predicting the presence of MetS. The AUC was significantly greater for men (0·785 (95 % CI 0·772, 0·798)) than for women (0·717 (95 % CI 0·707, 0·727)). Furthermore, when analysed across different age groups, the AUC consistently exhibited a greater magnitude in men than in women. The optimal VFA cut-off points were generally lower in males (85·15 cm2) than in females (109·55 cm2). Both the male and female optimal VFA cut-off values initially tended to increase with age before declining, peaking in the 60–74-year-old cohort. Specifically, for males, the cut-off values were 80·95 cm2 for the 45–59-year-old group, 85·15 cm2 for the 60–74-year-old group and 77·50 cm2 for those aged ≥ 75 years. For females, the respective values were 109·65 cm2, 112·15 cm2 and 103·05 cm2. The details of the sensitivity, specificity, Youden index and AIC of VFA are shown in Table 6.
ROC curves of the ability of the VFA to predict MetS. Among the total population (a), those aged 45–59 years (b), those aged 60–74 years (c) and those aged ≥ 75 years (d), the AUC values of VFA were significantly greater in males than in females. ROC, receiver operating characteristic; VFA, visceral fat area; MetS, metabolic syndrome.

Value of VFA for MetS predicting in middle-aged and elderly individuals by sex and age

VFA, visceral fat area; MetS, metabolic syndrome; AUC, area under curve; Se, sensitivity; Sp, specificity; YI, Youden index; AIC, Akaike information criterion.
The unit of Se and Sp is %.
Discussion
Currently, the prediction of MetS in middle-aged and elderly populations via BIA-based VFA remains scarce both domestically and internationally. Additionally, the threshold values for predicting MetS proposed by existing studies are contentious, necessitating further empirical evidence for reference. Therefore, this study investigated the predictive effectiveness of VFA via BIA technology for middle-aged and elderly patients with MetS and determined the optimal cut-off value of VFA for predicting MetS in this population. The optimal cutoff values of VFA for predicting MetS were 85·15 cm2 for males and 109·55 cm2 for females. Subsequent analysis, stratified by age, revealed that these thresholds exhibit a non-linear relationship with age, initially increasing and subsequently decreasing among both sexes. Our study contributes to the screening of MetS in the physical examination population and promotes healthy ageing.
Numerous studies have demonstrated a robust association between abdominal obesity and metabolic risk factors, including hypertension(Reference Nurdiantami, Watanabe and Tanaka27,Reference Zhao, Qin and Sun28) , hyperglycaemia(Reference Wang, Zhang and Ma29) and dyslipidemia(Reference Zhu, Zhang and Wu30). This relationship underscores the potential for abdominal obesity to synergistically modulate both the onset and progression of MetS. Consequently, assessing abdominal obesity can predict the occurrence of MetS. BMI and WC are classical indicators for assessing obesity, primarily due to their ease of measurement. Additionally, WC serves as a key anthropometric marker for abdominal obesity. In our study, correlation analysis revealed that VFA exhibited a strong correlation with BMI and WC. Logistic regression results further demonstrated that elevated VFA was an independent risk factor for MetS. To compare the predictive value of VFA, BMI and WC for MetS (excluding WC), we assessed both AUC (accuracy) and AIC (parsimony). For AUC, VFA outperformed WC and BMI in males but had the lowest AUC in females. Notably, all three indicators showed AUC of 0·6–0·7 across sexes, with consistent sensitivity and specificity-indicating moderate predictive capacity for MetS. AIC analysis further clarified practical utility: WC had the lowest AIC across all sexes, representing an optimal balance of accuracy and economy (lower complexity and measurement cost). However, VFA retains distinct value: despite its approximately 11-fold higher AIC than WC in males, its superior AUC in this group makes it a more precise option for refined assessments. BMI performed poorest, with both the lowest AUC and highest AIC. These results confirm WC is ideal for large-scale MetS screening, while VFA, with overall predictive power comparable to WC and BMI and superior accuracy in males, offers unique value in male-specific, precision-focused clinical or research settings.
For VFA’s predictive efficacy for MetS in middle-aged and elderly populations, our results showed it was greater in males than in females, consistent with findings from Kim et al. (Reference Kim, Kwak and Cho31), Pasdar et al. (Reference Pasdar, Hamzeh and Najafi32) and Zhang et al. (Reference Zhang, Lv and Jiang33); however, this conflicts with reports by Pickhardt et al. (Reference Pickhardt, Jee and O’Connor34), Qin et al. (Reference Qin, Chen and Yan35) and Wang et al. (Reference Wang, Hu and Huang36). This discrepancy may be explained by men having a higher prevalence of MetS and its components, more complex and severe abnormal component combinations, higher rates of lifestyle risk factors (e.g. physical inactivity ans excessive alcohol intake) and faster MetS progression(Reference Xu, Gao and Xing37). Notably, the AUC of VFA in both males and females in our study was lower than that reported in Korean and Japanese studies(Reference Lee, Kim and Oh38–Reference Matsushita, Nakagawa and Yamamoto41), potentially attributable to differences in MetS diagnostic criteria, geographic disparities and VFA measurement methodologies. In our study, the optimal VFA cut-offs for MetS were 85·15 cm2 for males and 109·55 cm2 for females – contrary to most prior research, which typically reports higher cut-offs for males. For example, Pickhardt et al. (Reference Pickhardt, Jee and O’Connor34) reported cut-offs of 125·0 cm2 (males) and 70·0 cm2 (females), Qin et al. (Reference Qin, Chen and Yan35) 100·4 cm2 (males) and 92·3 cm2 (females), Wang et al. (Reference Wang, Hu and Huang36) 100·4 cm2 (males) and 112·6 cm2 (females), Kim et al. (Reference Kim, Kwak and Cho31) 138·0 cm2 (males) and 95·1 cm2 (females), and Pasdar et al. (Reference Pasdar, Hamzeh and Najafi32) 91·6 cm2 (males) and 139·1 cm2 (females). We hypothesise that our reversed cut-off trend – lower for males than females – may stem from the study’s middle-aged and elderly female participants, most of whom are postmenopausal. Postmenopause is associated with marked physiological and metabolic changes, particularly oestrogen deficiency, which has been shown to disrupt lipid metabolism, energy expenditure, and insulin sensitivity and promote abdominal and visceral fat accumulation(Reference Fenton42–Reference Opoku, Abushama and Konje45). This accelerated visceral adiposity in postmenopausal women may explain the higher optimal VFA cut-off we observed in females.
Apart from variations in study population characteristics, differences in VFA detection methodologies also contribute to disparities among studies. Lee’s(Reference Lee, Park and Ahn46) research indicated a high correlation between VFA values measured by BIA and CT, although the absolute values differed. Generally, the VFA values obtained through CT were greater than those obtained via BIA, with the discrepancy widening as BMI increased. Hamasaki’s(Reference Hamasaki, Furuta and Yanai47) work suggested that BIA might underestimate the VFA in obese individuals. Consequently, employing different VFA measurement techniques results in varied cut-off values. Additionally, in different age groups, the VFA cut-off values for men and women in this study initially tended to increase but then decreased with age. The VFA cut-off value was the highest at 60–74 years of age, suggesting that 60- and 75-year-old individuals were the two watersheds with VFA cut-off values. The discrepancy compared with Pasdar’s(Reference Pasdar, Hamzeh and Najafi32) study could stem from differences in the ethnicity and age ranges of the participants. Pasdar’s research focused on Western Iranians, predominantly Iranian Kurds, whose lifestyles significantly differ from those of our country’s population. Additionally, their study involved participants aged 35–65 years, with an average age of 48·08 (sd 8·26) years, which was notably younger than that of our cohort. With increasing age, the increase in VFA is due to the accumulation of visceral fat during the ageing process, and after the age of 75 years, the decrease in the VFA cut-off value may be due to the loss of appetite, difficulties eating, weakened digestive function and lesions associated with high consumption.
The study offered certain advantages in terms of subject characteristics and sample size, providing a valuable reference for the clinical application of BIA technology. However, there were several limitations in this study. First, this study was cross-sectional and could not explore causality between VFA and MetS. Second, the participant pool was restricted to individuals over 45 years of age from the Sichuan region of China, limiting the generalisability of the findings to other populations or ethnicities. Third, there was an underrepresentation of subjects aged 75 years and above; future research should focus on superaged individuals. Lastly, our study still suffers from a lack of local data to conduct effective external validation. Moving forward, we will prioritise the collection of follow-up data from our own cohort, and these data will be utilised for formal external validation in our subsequent studies.
Conclusion
In conclusion, VFA emerges as a valuable MetS screening marker for middle-aged and elderly Chinese individuals, with overall predictive power comparable to WC and BMI and superior accuracy in males. While WC remains ideal for large-scale screening, VFA’s precision in males justifies its use in targeted clinical or research settings. We propose optimal cut-off values for predicting MetS at approximately 85 cm2 for males and 110 cm2 for females. Given the high prevalence of MetS, implementing these VFA cut-off points for early detection may contribute to reducing disease complications and associated healthcare costs. Notably, the threshold value of VFA fluctuates with age, necessitating age-adjusted selection in clinical practice. Further validation of these tangential VFA values through cohort studies and larger datasets is warranted.
Acknowledgements
The authors are very thankful for the support from the General Office, Cohort Study Center, Sichuan University West China Hospital.
This study was primarily supported by 1·3·5 project for disciplines of excellence – Clinical Research Fund, West China Hospital, Sichuan University (grant number 2024HXFH017).
All the authors listed have contributed to the work. F. P. participated in designing the study protocol, collecting the data and performing the statistical analysis. R. H. and Y. W. collected the data and performed the statistical analysis. J. L. and X. L. recruited the participants and collected the data. The manuscript was mainly drafted by R. H. and Y. W. and revised and improved by F. P. L. S. supervised the study. W. H. contributed to the study conception and the whole project administrative. All authors have read the final manuscript, approved the submitted version and agreed both to be personally accountable for their contributions.
The authors declare no conflicts.