Introduction
Natural and anthropogenic atmospheric trace elements are useful indicators of past atmospheric circulation patterns and source regions of atmospheric impurities (Hong et al. Reference Hong, Barbante, Boutron, Gabrielli, Gaspari, Cescon, Thompson, Ferrari, Francou and Maurice-Bourgoin2004, Hur et al. Reference Hur, Cunde, Hong, Barbante, Gabrielli, Lee, Boutron and Ming2007, Soyol-Erdene et al. Reference Soyol-Erdene, Huh, Hong and Do Hur2011). Dominant natural sources include continental dust, sea salt spray and volcanic emissions. Major anthropogenic sources include metal smelting, fossil fuel combustion and the use of leaded petroleum (Nriagu Reference Nriagu1989, Hong et al. Reference Hong, Barbante, Boutron, Gabrielli, Gaspari, Cescon, Thompson, Ferrari, Francou and Maurice-Bourgoin2004). The Antarctic ice cap preserves a high resolution record of past hemisphere environmental conditions, and as such is an ideal archive for studying historical trace metal deposition (Hong et al. Reference Hong, Barbante, Boutron, Gabrielli, Gaspari, Cescon, Thompson, Ferrari, Francou and Maurice-Bourgoin2004, Hur et al. Reference Hur, Cunde, Hong, Barbante, Gabrielli, Lee, Boutron and Ming2007, Soyol-Erdene et al. Reference Soyol-Erdene, Huh, Hong and Do Hur2011).
Arsenic, one of the most toxic elements, is of great danger to human health, with exposure causing acute symptoms such as delirium, coma and seizure, as well as increased cancer rates. In the past several decades, studies have mainly focused on arsenic in water systems (Matschullat Reference Matschullat2000, Nordstrom Reference Nordstrom2002) with little work on polar snow and ice due to the extremely low concentrations found there (pg g-1 or sub pg g-1 levels). Existing polar snow and ice studies have discussed arsenic records from Dome Fuji (80°22'S, 77°21'E), Lambert Glacier Basin (LGB) (70°50'S, 77°04'E), Dome C (75°06'S, 123°20'E), Antarctica Ice Core-6 (IC-6) (81°03'S, 79°50'E) and along the US International Trans-Antarctic Scientific Expedition (ITASE) traverses (Gabrielli et al. Reference Gabrielli, Planchon, Hong, Lee, Do Hur, Barbante, Ferrari, Petit, Lipenkov, Cescon and Boutron2005, Hur et al. Reference Hur, Cunde, Hong, Barbante, Gabrielli, Lee, Boutron and Ming2007, Carlos Reference Carlos2012, Hong et al. Reference Hong, Soyol-Erdene, Hwang, Hong, Do Hur and Motoyama2012). With the exception of Hong et al. (2012), these studies only present arsenic concentration data without linking the concentration to possible sources, distribution patterns and transport pathways (Gabrielli et al. Reference Gabrielli, Planchon, Hong, Lee, Do Hur, Barbante, Ferrari, Petit, Lipenkov, Cescon and Boutron2005, Hur et al. Reference Hur, Cunde, Hong, Barbante, Gabrielli, Lee, Boutron and Ming2007, Carlos Reference Carlos2012). Hong et al. (Reference Hong, Soyol-Erdene, Hwang, Hong, Do Hur and Motoyama2012) link arsenic concentrations to sources and transport pathways but do not investigate the regional distribution patterns of arsenic in Antarctica. Consequently, more data are needed on arsenic deposition in Antarctica to determine temporal and spatial variations, possible source regions and transport mechanisms. For this reason, 30 samples were collected during the 26th Chinese Antarctica Expedition from a snow pit at Dome Argus, the highest and the most inland plateau in central East Antarctica (Hou et al. Reference Hou, Li, Xiao and Ren2007). A time series of arsenic concentrations from 1964–2009 preserved in these samples is presented here. By combining our findings with existing data we analysed both temporal and spatial distribution, and possible sources and transport mechanisms of arsenic in Antarctica.
Methodologies
Sampling
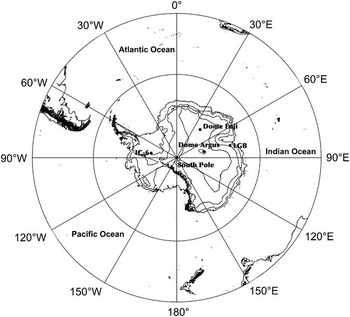
In January 2010, a 3 m snow pit was excavated at Dome Argus (80°22'S, 77°21'E, 4093 m a.s.l.,~1228 km inland from the nearest coast), East Antarctica (Fig. 1). First,~20 cm of snow was scraped off the snow pit wall with clean scrapers. Thirty samples were collected at 0.1 m intervals by pushing LDPE bottles into the wall of the snow pit. To avoid potential contamination, the scrapers and LDPE bottles were thoroughly acid-cleaned prior to sampling, following strict cleaning procedures (Liu et al. Reference Liu, Hou, Hong, Do Hur, Lee and Wang2011). Personnel involved wore polyethylene gloves, clean suits and masks during sampling (Hur et al. Reference Hur, Cunde, Hong, Barbante, Gabrielli, Lee, Boutron and Ming2007). All the samples were double-sealed within acid-cleaned LDPE bags and kept frozen until analysis. The bottom 1 m of the snow pit was also sampled at 0.05 m intervals for β activity measurements in order to date the snow pit.
Map of Antarctica. The black contour lines give terrain elevation in 1000 m intervals starting at 2000 m. IC-6=Ice Core-6, LGB=Lambert Glacier Basin.

Laboratory work
Trace element and dissolved ion measurements were performed at the Climate Change Institute (CCI) at the University of Maine in the dedicated ultraclean labs to avoid contamination. All samples were melted in the ultraclean room (Class 1000) at room temperature (~ 20°C). Trace element samples were acidified with 1% ultrapure nitric acid (Fisher ‘Optima’ Grade), stored at room temperature for 24–48 hours, and then analysed for arsenic concentration, using a high resolution Thermo ELEMENT2 high resolution Inductively Coupled Plasma Sector Field Mass Spectrometer (ICP-SFMS) with an APEX micronebulization desolvation system (APEX, ESI, US) which increases instrument sensitivity and reduces oxide formation in the plasma (Osterberg et al. Reference Osterberg, Handley, Sneed, Mayewski and Kreutz2006). Sampling was achieved using a CETAC ASX 260 Autosampler, which was housed under a Class 100 bench to reduce possible contamination. A high resolution setting and a sensitivity of 115In=800 000 cps per 100 ng l-1 was used.
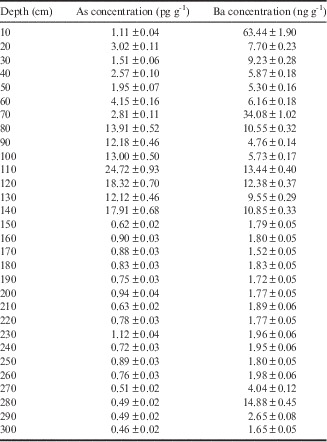
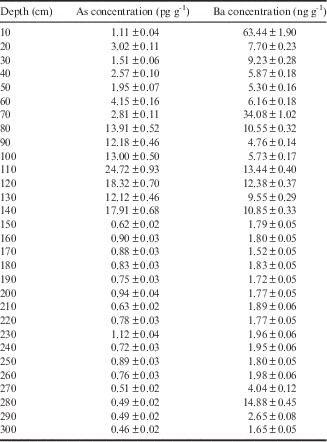
The ICP-SFMS measurements were validated using SLRS-4 frozen river water reference material for trace metals (National Research Council Canada), and the results (700±20 pg g-1) exhibited good recovery compared with certified values (680±60 pg g-1). This demonstrates that the ICP-SFMS was well calibrated to certified materials, and should produce reliable results. Check standards were also analysed throughout the run to monitor long-term drift. Method blanks were prepared the same way as the samples except that the vials contained deionized water. The average procedure blank value is 0.08 pg g-1. These results were lower than published values at other sites (Table I), suggesting good confidence in the data. The detection limit in this work, defined as three times the standard deviation of measurements of the blank, was 0.1 pg g-1 for arsenic. Arsenic (and barium) concentrations in the 30 snow pit samples in this study are presented in Table II. The major ion species (Na+, SO4 2- and Cl-) were used to date the snow pit, with measurements conducted at CCI using ion chromatography (IC) equipped with DX-500 chromatographs fitted with suppressed conductivity detectors and Gilson autosamplers.
Arsenic records at different sites in Antarctica.

* The fourth version of natural river water certified reference material.
Arsenic and barium concentrations in the Dome Argus snow pit.
Beta activity was measured in the ultraclean room of the State Key Laboratory of Cryospheric Science in 2011. Samples were melted in acid-cleaned LDPE bags at room temperature (~ 20°C), acidified with analytical grade, concentrated hydrochloric acid (38%, ‘Huafu’, Yangzhou) at a level of 0.00033 ml kg-1 to activate radioactive materials, and filtered through a MN616 LSA-50 cation exchange filter three times to concentrate the radionuclide (Hou et al. Reference Hou, Li, Xiao and Ren2007). Filters were then dried on aluminium foil and the β activity was measured using MINI 20 low background α/β counting equipment (Canberra, US).
Dating
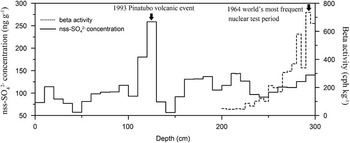
Chronology of the snow pit was established based on identified non-sea salt sulfur (nss-SO4 2-) and β radioactivity peaks (Fig. 2) associated with nuclear testing and subsequent atmospheric transport of radioactive impurities to Antarctica (Hou et al. Reference Hou, Li, Xiao and Ren2007). The highest β radioactivity peaks are assigned to 1964 and 1965, when nuclear tests were most frequent, with maximum release and subsequent preservation of radioactive material (Mosley-Thompson et al. Reference Mosley-Thompson, Paskievitch, Gow and Thompson1999). The nss-SO4 2- and ss-SO4 2- concentrations were calculated using the following equations:
 $$\left[ {{\rm ss{\hbox -}SO}_{{\rm 4}} ^{{\,\,\,{\rm 2{\hbox -}}}} } \right]=0.25\left[ {{\rm Na}^{{\plus}} } \right],$$
 $$\left[ {{\rm nss{\hbox -}SO}_{{\rm 4}} ^{{{\,\,\,\rm 2{\hbox -}}}} } \right]=\left[ {{\rm SO}_{{\rm 4}} ^{{{\,\,\,\rm 2{\hbox -}}}} } \right]{\minus}0.25\left[ {{\rm Na}^{{\rm {\plus}}} } \right],$$
with one peak in the record assigned to the Pinatubo volcanic events in 1993 (Cole-Dai et al. Reference Cole-Dai, Mosley-Thompson and Thompson1997). Average snow accumulation rates calculated based on this chronology are comparable with published observations at Dome Argus (Hou et al. Reference Hou, Li, Xiao and Ren2007, Ma et al. Reference Ma, Bian, Xiao, Allison and Zhou2010, Ding et al. Reference Ding, Xiao, Li, Ren, Hou, Jin and Sun2011).
Profiles of the non-sea salt sulfur (nss-SO4 2-) concentration and β activity along the Dome Argus snow pit. Peaks correspond to the 1993 Pinatubo volcanic event and nuclear testing in 1964.

Results
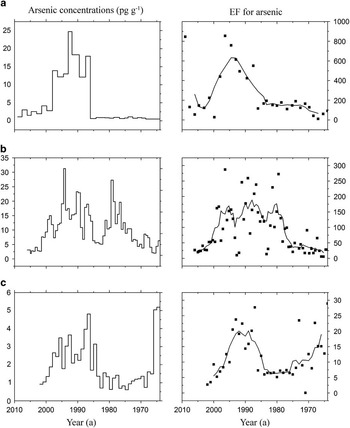
Figure 3 shows arsenic concentration profiles at Dome Argus from 1964–2009. Values range from~0.5 pg g-1 to~25 pg g-1 with a mean concentration of 4.7 pg g-1 after blank correction. Arsenic concentrations display two periods of changing concentrations. Before the mid-1980s, concentrations of arsenic were low with an average value of 0.74 pg g-1. Concentrations then increased substantially in the mid-1980s, reaching 24.7 pg g-1. Concentrations remained high from the mid-1980s to late-1990s, averaging 16 pg g-1, after which arsenic concentrations began to decrease, stabilizing at a very low level with a mean value of 2.5 pg g-1 from the late-1990s to 2009.
Arsenic concentrations and enrichment factors (EF) (solid lines represent five-year running averages of EF) in the snow pit samples at a. Dome Argus (this work), b. Dome Fuji (Hong et al. Reference Hong, Soyol-Erdene, Hwang, Hong, Do Hur and Motoyama2012) and c. IC-6 (Carlos Reference Carlos2012).

Discussion
Natural contributions
Natural contributions of arsenic to the atmosphere are predominantly from crustal, sea salt and volcanic sources. Here the crustal enrichment factor (EF) has been used as a proxy to assess upper crust contribution, and is calculated using the following equation (Wedepohl Reference Wedepohl1995).
 $${\rm EF=}\,\left[ {{ X/R}} \right]_{{snow}} {\rm /}\left[ {{ X/R}} \right]_{{crust}} ,$$
where X refers to the target element (As) and R refers to the reference element. The closer the value of EF is to 1, the greater the dominance of crustal dust as the source of arsenic. Here, barium (Ba) has been used as a reference element to evaluate the crustal contribution (Hong et al. Reference Hong, Soyol-Erdene, Hwang, Hong, Do Hur and Motoyama2012), as it is considered to be a better indicator than aluminium (Thamban & Thakur Reference Thamban and Thakur2013). The EFs of arsenic, as given in Fig. 3, range from~11 to~854 with a mean of 257. This implies that As/Ba ratios in the snow are much higher than that in the upper crust, indicating that continental crust was not a dominant source for arsenic at Dome Argus during the studied time period. The EF values for arsenic increased significantly in the mid-1980s and decreased rapidly in the late-1990s, implying possible changes in source region and atmospheric circulation intensity.
Sea salt sodium, sodium in the snow and element ratios in seawater (Li Reference Li1991) have been used in this study to assess the contribution from sea salt to arsenic concentrations:
 $$Con=([As\left] {/(} \right]Na\left] {\minus} \right]Na]_{{sea\,salt}} ))_{{snow}} /([As\left] / \right]Na])_{{seawater}}. $$
Calculated sea salt contributions for arsenic were found to be negligible, with average contributions<1% of measured arsenic concentrations. Finally, volcanic contributions to arsenic concentrations in this study have been assessed by nss-SO4 2-. It has been suggested that the high value of arsenic seen in 1993 is related to the Pinatubo volcanic event; an additional arsenic peak in 1992 is also probably related to volcanic events. Given the minimal number of arsenic concentration peaks considered to be related to volcanic events, as well as the minimal impact of volcanic events on average arsenic concentrations during the period, volcanic contributions in this study have been deemed to be negligible. Consequently, the analyses presented here imply that major natural sources of continental crust material, sea salt spray and volcanic emissions were not primary contributors of arsenic at Dome Argus, and therefore, arsenic preserved in Dome Argus snow and ice is most probably sourced to atmospheric depositions carrying anthropogenic emissions.
Anthropogenic contributions
In the past several decades a number of studies have been carried out on anthropogenic atmospheric arsenic. Matschullat (Reference Matschullat2000) suggested that copper smelting and coal production combustion could account for 60% of anthropogenic arsenic emissions, with the remaining 40% sourced to herbicides, lead and zinc smelting, glass production, waste incineration and steel production. Similarly, Pacyna & Pacyna (Reference Pacyna and Pacyna2001) assessed global arsenic emissions in the mid-1990s and suggested that non-ferrous metal production (mainly copper production) and stationary fossil fuel combustion (mainly coal combustion) accounted for ~ 69% and~16%, respectively, of total atmospheric arsenic emissions, with the remaining 15% from waste disposal, iron and steel production, and cement production. Therefore, copper smelting and coal production are the two most important sources for atmospheric arsenic.
Copper smelting
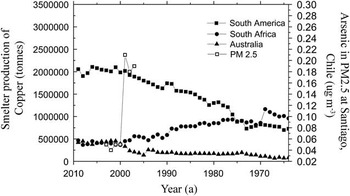
To establish potential sources for anthropogenic arsenic at Dome Argus, copper smelting in Australia, South Africa and South America from 1964–2009 was examined (Fig. 4; BGS 1964–2012). From the mid-1980s to the late-1990s copper production stabilized at very low levels in Australia, decreased in South Africa, but increased continuously in South America. This increasing trend in copper production in South America matches the increasing trend in arsenic concentration measured at Dome Argus, suggesting that it could be a major source region for arsenic at that site. A correlation analysis between copper production in South America and the arsenic concentration at Dome Argus further confirms this relationship (R 2 =0.42, or 0.40 when arsenic concentrations of 1992 and 1993 are excluded). The relatively weak correlation suggests that other factors, such as atmospheric circulation, may also play a role in the transport and deposition process. This result is consistent with previous isotope studies (e.g. Delmonte et al. Reference Delmonte, Basile-Doelsch, Petit, Michard, Revel-Rolland, Maggi and Gemmiti2003) which suggested ratios of Nd and Sr isotopes in ice cores from East Antarctica were similar to those for South America. Results from general circulation models (Li et al. Reference Li, Ginoux and Ramaswamy2008, Albani et al. Reference Albani, Mahowald, Delmonte, Maggi and Winckler2012) have also identified this preferential pathway for dust transportation from South America to Antarctica. The increase of arsenic at Dome Argus was more rapid than that of copper smelting in South America, which could be related to the enhanced southward movement of westerlies in the early-1980s, leading to strengthened wind transport to Antarctica (Toggweiler et al. Reference Toggweiler, Russell and Carson2006). This is supported by previous studies showing increases of arsenic, platinum and rare earth elements in Antarctica in the mid-1980s (Soyol-Erdene et al. Reference Soyol-Erdene, Huh, Hong and Do Hur2011, Hong et al. Reference Hong, Soyol-Erdene, Hwang, Hong, Do Hur and Motoyama2012).
Copper production in South America (black squares), South Africa (black dots) and Australia (black triangles) (BGS 1964–2012). Arsenic concentrations in atmospheric PM 2.5 (particulate<2.5 μm) from 1997–2003 at Santiago, Chile (open squares) are also included (Richter et al. Reference Richter, Grino, Ahumada and Giordano2007).

From the late-1990s to 2009, despite the continued increase in copper production in South America, arsenic concentrations at Dome Argus display a decreasing trend. This discrepancy may be related to general environmental improvement in the South American countries as a result of implementation of stricter environmental regulations. This was particularly evident in Chile as discussed below.
Chile is a major copper producing country accounting for>70% of total copper production in South America, with the remainder coming from Brazil, Peru, Argentina and Venezuela (BGS 1964–2012). With the realization that copper smelting had caused serious air pollution issues in Chile, major regulations on arsenic emission from copper smelters were put in place in 1999 (Caldentey & Mondschein Reference Caldentey and Mondschein2003) and were subsequently found to be successful. According to a study by Richter et al. (Reference Richter, Grino, Ahumada and Giordano2007), the atmospheric arsenic concentration in Santiago decreased by a factor of 4.5 from~ 0.18 μg m-3 in 1998 to~0.04 μg m-3 in 2002 (Fig. 4). This is comparable to the magnitude of the decrease in arsenic concentration at Dome Argus during the same time period (by a factor of 3.5 from~14 pg pg-1 in 1998 to~4 pg g-1 in 2002). These regulations could account for the decrease in arsenic concentration in the late-1990s and subsequent low levels in the 2000s at Dome Argus. This is consistent with the implementation time (1999, 2000 and 2003) of ‘decontamination plans’ and the expected arsenic abatement for major smelters in Chile (O’Ryan & Diaz Reference O’Ryan and Diaz2000).
Coal production
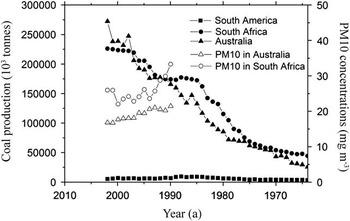
Coal production in South Africa and Australia displays a continuous increase since the early 1980s (Fig. 5) but no significant decrease is evident in the late-1990s. Similarly, PM10 (particulate size<10 μm), which mainly consists of emitted particulates from fossil fuel combustion (Lenschow et al. Reference Lenschow, Abraham, Kutzner, Lutz, Preuss and Reichenbacher2001, Callen et al. Reference Callen, Iturmendi, Lopez and Mastral2014), does not display any significant decrease in the late-1990s. The increasing coal production trend in Australia and South Africa do not match the decreasing arsenic concentration trend at Dome Argus in the late-1990s, suggesting that coal production in South Africa and Australia are not dominant sources for arsenic at Dome Argus. Furthermore, coal production in South America, potentially the dominant source region for Dome Argus, remained low and stable. Consequently, the impact of coal production on arsenic deposited at Dome Argus is not considered dominant. Therefore, it is concluded that copper production in South America was the major source of arsenic to Dome Argus over the time period of this study.
Coal production (Mitchell Reference Mitchell2007a, Reference Mitchell2007b) and PM10 (from 1990–2002, data from The World Bank, http://data.worldbank.org/indicator/EN.ATM.PM10.MC.M3/countries?page=6, accessed 15 July 2015) in Australia and South America.

Regional pattern of arsenic concentrations in Antarctica
Arsenic concentrations at Dome Argus in this study have been compared with two other sites from previous studies: Dome Fuji and IC-6 (Table I and Fig. 3) in order to evaluate arsenic distributions and source regions in Antarctica. Arsenic concentrations found at Dome Fuji are higher than those at Dome Argus, and both locations have higher concentrations than IC-6. The increase of arsenic concentration at Dome Fuji in the 1970s does not appear at the other two sites. The differences in temporal trends among these sites might be explained by atmospheric circulation patterns and regional differences in snow accumulation rates and mechanisms.
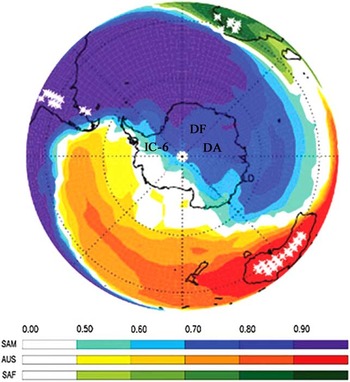
Krinner et al. (Reference Krinner, Petit and Delmonte2010) proposed two major mechanisms for dust transport towards the interior of Antarctica: fast low-level advection enhanced by cyclonic systems off the Antarctic coast, and advection enhanced by mass convergence in the middle troposphere above Antarctica. A simulation by Sudarchikova et al. (Reference Sudarchikova, Mikolajewicz, Timmreck, O’Donnell, Schurgers, Sein and Zhang2015) calculated ten-day forward trajectories that reach Antarctica and suggested that low level transport was more frequent from Australia than from South America, and reached the part of Antarctica facing the Pacific Ocean. However, at 500 hPa, forward trajectories from South America were much more frequent than those originating over Australia, reaching the part of Antarctica facing the Atlantic and Indian oceans. These results are also consistent with general climate model results presented by Albani et al. (Reference Albani, Mahowald, Delmonte, Maggi and Winckler2012) and Li et al. (Reference Li, Ginoux and Ramaswamy2008). A synthesis of these results suggests that Dome Fuji and Dome Argus are mainly affected by dust from South America, while IC-6 might be affected by a combination of dust from South America and Australia (Fig. 6). Therefore, low arsenic emissions from Australia (Fig. 4) could partly explain the much lower arsenic concentrations at IC-6 (Fig. 3).
Map of dust deposition apportionment in Antarctica for current climate. DA=Dome Argus, DF=Dome Fuji, IC-6=Ice Core-6. (From Albani et al. Reference Albani, Mahowald, Delmonte, Maggi and Winckler2012.)

Two additional factors could account for the different arsenic levels found at the coastal IC-6 site and interior Antarctica sites of Dome Argus and Dome Fuji. First, the accumulation rate at IC-6 (0.3 m H2O a-1, Carlos Reference Carlos2012) is approximately ten times higher than those at Dome Argus (0.023 m H2O a-1, Hou et al. Reference Hou, Li, Xiao and Ren2007) and Dome Fuji (0.032 m H2O a-1, Kamiyama et al. Reference Kamiyama, Ageta and Fujii1989), resulting in more diluted arsenic concentrations at IC-6. Second, the unique clear sky precipitation in interior Antarctica (Dome Argus and Dome Fuji) causes a needle crystal layer to develop on the surface. This layer has higher specific surface areas to better capture dust particulates, hence increasing arsenic concentrations at these sites (Li et al. Reference Li, Kang, Shi, Huang, Ding, Zhang, Zhang, Guo, Xiao, Hou, Sun, Qin and Ren2014).
Arsenic concentrations at Dome Fuji are twice as high as those at Dome Argus, which could be related to the difference in dust deposition between the two sites. A study of wet deposition simulation showed that Dome Fuji received accumulation from a moisture source that is farther north (Wang et al. Reference Wang, Sodemann, Hou, Masson-Delmotte, Jouzel and Pang2013), which could in turn bring in more pollutants and lead to higher arsenic concentrations. In addition, differences in surface boundary layer and surface roughness height might cause the different velocities of dry deposition (Gronlund et al. Reference Gronlund, Nilsson, Koponen, Virkkula and Hansson2002), which could also result in different arsenic levels between the two sites.
The dramatic increase of arsenic during the mid-1980s and 1990s is observed at all three sites (Fig. 3), which suggests that arsenic pollution from the mid-1980s to the late-1990s was regional in Antarctica. However, it is noted that a peak of arsenic concentrations observed at Dome Fuji in the mid-1970s does not appear at Dome Argus and IC-6. This could also be partly related to atmospheric circulation patterns. Based on the source apportionment map (Fig. 6; Albani et al. Reference Albani, Mahowald, Delmonte, Maggi and Winckler2012), Dome Fuji lies in the most upstream location in the dust deposition pathway, whereas Dome Argus and IC-6 are located more downstream. The signal decay in transportation along the pathway might lead to the missing peaks of arsenic concentrations in Dome Argus and IC-6 in the early 1970s. However, during the 1980s, the Southern Annular Mode (SAM) switched to a positive phase, causing southward shift of the polar jet. According to Laluraj et al. (Reference Laluraj, Thamban and Satheesan2013), this positive SAM after the 1980s could have strengthened the winds, hence increased the amount of dust transported to the Antarctic. This increase in transported dust could overcome the transport losses associated with downstream to upstream deposition, hence preserving arsenic peaks at all three locations. Although it is noted that signal decay is still preserved with increased average concentration at Dome Fuji and decreased concentration at Dome Argus and IC-6.
Conclusions
This study presents an arsenic concentration profile from 1964–2009 obtained from a 3 m snow pit at Dome Argus, the most inland area on the Antarctic Plateau. Increasing arsenic concentrations are observed from the mid-1980s to the late-1990s, which are related to increasing copper smelting activities in South America. Arsenic concentrations then decreased in late-1990s and remained at low levels until 2009, most probably as a result of environmental regulations imposed on copper smelting in Chile. Investigations of regional patterns have been conducted comparing arsenic concentrations at three Antarctic locations. Over the time of our study, regional arsenic distribution followed dust transport pathways associated with general climate models, which identify South America as a major source region for the half of Antarctica facing the Atlantic and Indian oceans. Elevated arsenic concentrations from the mid-1980s to late-1990s are observed at all three locations, implying that arsenic pollution for that time period was a regional phenomenon in Antarctica. To protect the fragile ecology of Antarctica, further understanding of the effects of atmospheric circulation on the distribution of arsenic deposition in Antarctica is required. This could be achieved by obtaining more in situ data from different locations and transects across the continent.
Acknowledgements
Thanks for the generous support from the Chinese Antarctic Expedition, Dr Shuang-Ye Wu for her helpful input, and Dr Laurie Burn-Nunes for valuable comments. The research was supported by the State Oceanic Administration (CHINARE2012-02-02) and the Natural Science Foundation of China (41330526, 41171052, 41321062). The constructive comments of the reviewers and the editor are gratefully acknowledged.
Author contributions
S.H. conceived the study and performed the sampling. R.H., S.S. and M.H. performed the measurements. R.H. and S.H. wrote the draft of the paper. All authors contributed to discussion of the results and writing of the paper.