Despite universal childhood vaccination in more than 180 countries, 1 antenatal screening programs, and vaccination programs directed at high-risk groups, hepatitis B remains a worldwide public health problem.Reference Gerlich 2 Globally 240 million people are chronically infected with hepatitis B virus (HBV).Reference Ott, Stevens, Groeger and Wiersma 3 Major HBV transmission modes are childbirth, blood-blood contact, and unprotected sex. 1 A mode of transmission that drew attention in the industrialized world over the past decades is the transmission of HBV from infected healthcare workers (HCWs) to patients, first described in 1970.Reference Garibaldi, Rasmussen, Holmes and Gregg 4 Since then, at least 52 HBV-infected HCWs have been implicated in the transmission of HBV to more than 500 patients in Europe and North America.Reference Carlson and Perl 5 , Reference Gunson, Shouval and Roggendorf 6 Most of these cases are associated with exposure-prone procedures (EPPs), where there is an increased risk of the HCW experiencing a percutaneous injury, thus exposing the patient to the HCW’s blood.Reference Deuffic-Burban, Delarocque-Astagneau, Abiteboul, Bouvet and Yazdanpanah 7 To reduce the risk of HBV transmission in the healthcare setting, occupational and hygienic guidelines have been developed on the basis of 3 strategies: prevention of infection of HCWs, identification of infected HCWs, and restricting infectious HCWs from performing EPPs.Reference Gunson, Shouval and Roggendorf 6
In 2003 a European consensus group recommended that HBV-infected HCWs should not perform EPPs if their HBV DNA level exceeds 1×10⁴ copies/mL.6 Despite these recommendations, guidelines with various HBV DNA cut-off levels have been established. Dutch guidelines ban HBV-infected HCWs from performing EPPs if their HBV DNA level exceeds 1×10⁵ copies/mL (ie, 2×10⁴ international units [IU]/mL). 8 In the United Kingdom a cut-off level of 1×10³ copies/mL is recommended. 9 In the United States 2 guidelines coexist, with the Centers for Disease Control and Prevention 10 and the Society for Healthcare Epidemiology of AmericaReference Henderson, Dembry and Fishman 11 advising safety HBV DNA thresholds of 5×10³ genome equivalents/mL and 1×10⁴ genome equivalents/mL, respectively. A viral load expressed in copies/mL approximates to a load expressed in genome equivalents/mL. The choice for a certain threshold level results from a trade-off between the risk of transmission of HBV to patients and the loss of highly educated professionals.Reference Buster, van der Eijk and Schalm 12 The Dutch rationale for the relatively high threshold of 1×10⁵ copies/mL is that only 1 report describes HBV transmission to a patient by an HCW with a viral load below 1×10⁵ copies/mL, which in addition was measured several months after the actual transmission occurred.Reference Corden, Ballard and Ijaz 13 , 14 Realizing its distinct position, the Dutch Committee for Prevention of Iatrogenic Hepatitis B (hereinafter referred to as the Committee) undertook to analyze viral load dynamics of HBV in notified Dutch infected HCWs. It is important to understand fluctuations of HBV viral load in symptom-free HCWs because these fluctuations may jeopardize the safety of patients. Several studies report fluctuations in hepatitis B patients;Reference Tedder, Ijaz and Gilbert 15 – Reference Martinot-Peignoux, Boyer and Colombat 17 however, data from healthy HCWs are scarce.Reference Cacciola, Spatari and Pollicino 18 Uncertainty remains about the magnitude of viral load fluctuation in HBV-infected medical personnel. Here we report on the dynamics of HBV viremia among notified HCWs with chronic HBV infection in the Netherlands and on the consequences for preventive policies, considering various HBV DNA safety thresholds above which an infected HCW is not allowed to perform EPPs.
METHODS
In the Netherlands every HBV-infected HCW performing EPPs must be reported to the Committee for evaluation and advice. The establishment, aims, and authority of the Committee have previously been described.Reference Daha, Bilkert-Mooiman and Ballemans 19 From June 1, 1996, through January 31, 2013, in total 126 HCWs were reported to the Committee. From its files the Committee extracted strictly anonymized data for this analysis, including gender, age, profession, EPP status, serial HBV DNA levels, and antiviral treatment (if applicable). Missing data were obtained by contacting the attending physician and laboratory. According to Dutch legislation this study did not need an ethics approval. For 45 of the 126 notified HCWs with chronic HBV infection, 2 or more valid measurements of HBV DNA without interference of antiviral therapy were available for analysis of natural HBV load fluctuation.
The serial HBV DNA levels of the HCWs were determined in various laboratories using different assays, over 17 years. However, all participating laboratories are required to be officially certified for medical microbiology testing. All laboratories have to participate once yearly in a masked quality control program, showing good results for quantitation of HBV DNA.
The reported HBV DNA levels were expressed in copies/mL or in IU/mL. Viral loads expressed in IU/mL were converted to copies/mL assuming that 1 IU equals 5 copies of HBV DNA.Reference Nardone, Anastassopoulou and Theeten 20 , Reference Lok and McMahon 21
The lower limit of detection of the HBV DNA assays that were applied varied over time and per laboratory. To enable comparison of negative test results and positive test results below the lower limit of quantitation, standardization was performed as follows. Results being reported as “negative” were arbitrarily given a value of 10 copies/mL. For test results below the lower limit of detection of an assay, a value was arbitrarily assigned to the rounded log10 value directly below the lower limit of detection (eg, a test result of <300 copies/mL was converted to 100 copies/mL). HBV DNA levels above the upper limit of quantitation arbitrarily were assigned the value of the rounded log10 directly above that limit. The first available HBV DNA level for each HCW was chosen to be the baseline value of that person.
HBV DNA viral load fluctuations were analyzed, taking into consideration different threshold levels above which EPPs are prohibited. A time-to-event analysis was conducted to evaluate the time it took to surpass the Dutch cut-off level of 1×10⁵ copies/mL after the baseline viral load was established. We used a Cox proportional hazards model to describe the risk of an event at any given measurement time, given the covariates age, sex, and viral load level. Persons with HBV levels below 4,800 copies/mL never surpassed the Dutch threshold of 1×10⁵ copies/mL at the next measurement. These observations were excluded from the Cox proportional hazards model (because this model requires at least some measurements to surpass the threshold value). The 100 remaining HBV DNA levels were categorized in 4 categories of roughly equal numbers (n≈25): 4.8×10³ to 1.5×10⁴; 1.5×10⁴ to 4.0×10⁴; 4.0×10⁴ to 1.0×10⁵; and 1.0×10⁵ to 1.0×10⁹ copies/mL.
Every measurement performed in an individual was defined as a new origin point in this analysis. Because this introduces clustering in the data, the analysis was performed using Survival (R Foundation for Statistical Computing), which allows for adjustment of standard errors for clustering in observations.
RESULTS
Considering the Dutch threshold level for performing EPPs of 1×10⁵ copies/mL, 35 of 45 HCWs had a baseline viral burden below this limit. During a mean follow-up of 5.2 years, 6 of 35 HCWs surpassed this level. Regarding the proposed European consensus level of 1×10⁴ copies/mL, 27 HCWs with baseline levels below 1×10⁴ copies/mL at baseline were available for analysis; 11 of 27 HCWs surpassed the threshold of 1×10⁴ copies/mL, of which 4 HCWs surpassed 100,000 copies/mL in a mean follow-up of 5.3 years. In the United Kingdom, the threshold above which staff is banned from EPPs is 1×10³ copies/mL. Nineteen HCWs showed baseline levels equal to or less than 1×10³ copies/mL and could be followed up: 14 of 19 HCWs surpassed the 1×10³ copies/mL limit in a mean follow-up of 5.5 years. Six of these HCWs surpassed the threshold of 10,000 copies/mL and none exceeded the 100,000 copies/mL cut-off.
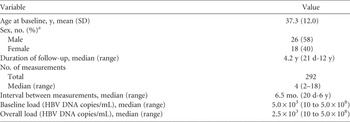
Demographic characteristics, follow-up duration, and HBV DNA levels are summarized in Table 1. The median (range) HBV viral load was 2.5×10³ (10 to 5.0×10⁸) copies/mL. A high correlation was seen for each HBV DNA level with the 3 previous loads, with correlation coefficients of 0.98, 0.97, and 0.96, respectively. Regarding a threshold level of 1×10⁵ copies/mL, 2 HCWs surpassed this upper limit after 3 previous DNA values below this level. Applying a threshold value of 1×10⁴ and 1×10³ copies/mL, respectively, 5 and 4 HCWs surpassed this threshold value after 3 previous lower loads. However, none of these 9 HCWs surpassed an upper limit of 1×10⁵ copies/mL during follow-up.
Characteristics of 45 Healthcare Workers (HCWs) With Chronic Hepatitis B Virus (HBV) Infection

a Data were not available for 1 person.
Longitudinal Changes of Serum HBV DNA Levels
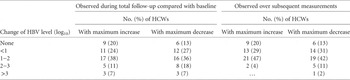
Maximum HBV DNA fluctuations during total follow-up compared with baseline load within individual HCWs were computed (Table 2). Three HCWs showed increases greater than 3 log10 copies/mL during total follow-up (eg, 3.05, 3.18, and 3.4 log10 copies/mL) compared with a baseline load over a period respectively of 10, 14, and 21 months. Three HCWs showed a decrease of greater than 3 log10 copies/mL.
Comparison of 45 Healthcare Workers (HCWs) Infected With Hepatitis B Virus (HBV), Categorized According to the Maximum Increase or Decrease of Their HBV DNA Level, Observed During Total Follow-Up Compared With Baseline and Observed Over Subsequent Measurements

Maximum increase or decrease in a subsequent HBV DNA load measurement is shown in Table 2. The maximum increase in 2 subsequent measurements was 2.2 log10 copies/mL, which occurred in 2 HCWs (4%). In one HCW this concerned a change from 7.1×10³ to 1.2×10⁶ copies/mL over a period of 16 months, and in the other this was a change from 1.0×10² to 1.7×10⁴ copies/mL over a period of 5 months. The largest decline was a 5.4 log10 decrease in 2 subsequent samples with an interval of 6 years and a conversion from hepatitis B e antigen positivity to anti–hepatitis B e antigen status.
Time Span to Surpassing the Threshold Value
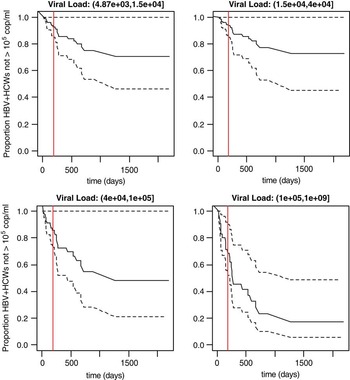
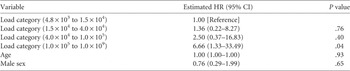
The Cox proportional hazards model showed that, compared with the baseline category (4.8×10³ to 1.5×10⁴), the higher the viral load category the higher the hazard rate change (ie, an increased risk of exceeding the threshold value of 1×10⁵ copies/mL at the next measurement). However, only in the highest category (1.0×10⁵ to 1.0×10⁹) is the hazard ratio significant. Also, in the Dutch policy this category is already banned from EPP from the start at baseline. Age and sex add little explanatory value in this analysis (Table 3). The survival curves per load category are plotted in Figure 1. To show their relationship with the current recommended frequency of measurements (each 6 months), the 6-month time span is depicted in the figure. The category 1.0×10⁵ to 1.0×10⁹ has the lowest survival rate because these baseline loads already start above the cut-off of 1×10⁵ copies/mL. After 6 months the percentages of individuals that exceeded the cut-off were 7.2%, 6.5%, 14.3%, and 31.4%, respectively, for categories 4.8×10³ to 1.5×10⁴; 1.5×10⁴ to 4.0×10⁴; 4.0×10⁴ to 1.0×10⁵; and 1.0×10⁵ to 1.0×10⁹.
Proportions of 45 hepatitis B virus–positive (HBV+) healthcare workers (HCWs), subdivided into 4 groups on the basis of their HBV DNA levels, not surpassing a safety level of 1×10⁵ copies/mL HBV DNA, above which exposure-prone procedures are not allowed. Survival curves were constructed from a Cox proportional hazards model. The solid black lines represent the survival curves. The dotted black lines are the 95% confidence intervals. The vertical line represents the current measurement frequency of 6 months.

Results of Cox Proportional Hazards Model With Hazard Ratios (HRs) for Different Viral Load Categories, Age, and Sex

NOTE. HRs are relative to baseline category (4.8×10³ to 1.5×10⁴), where HR=1 indicates no effect. HR>1 suggests a higher risk of exceeding the threshold value of 1×10⁵ copies/mL at the next measurement.
DISCUSSION
To shed light on the natural fluctuation of HBV DNA levels in HCWs, we analyzed a large group of HBV-infected HCWs. We observed HBV DNA fluctuations in follow-up samples ranging from −5.4 to +2.2 log10 copies/mL. However, focusing on rises during total follow-up, most (37 [82%]) did not show rises greater than 2 log10. This is consistent with other studies that also showed continuous fluctuations in symptomless HBV carriers within limited ranges.Reference Cacciola, Spatari and Pollicino 18 , Reference Croagh, Bell, Chen, Locarnini and Desmond 22 Cacciola et alReference Cacciola, Spatari and Pollicino 18 evaluated a small cohort of 13 inactive HBV carriers for 12 months with HBV DNA fluctuations between 1 and 2 log10 changes, with all levels below an upper value of 2×10⁴ copies/mL. Croagh et alReference Croagh, Bell, Chen, Locarnini and Desmond 22 concluded that minor fluctuations in HBV DNA up to 2×10⁴ IU/mL (ie, 1×10⁵ copies/mL), accompanied by persistently normal alanine transaminase level, occurred frequently in hepatitis B e antigen–negative chronic hepatitis B, with a median follow-up of 2 years.
To compensate for natural fluctuations of HBV viremia, implementing a lower threshold above which EPPs are forbidden reduces the transmission risk by definition. Unfortunately, data are scarce on the risk of provider-to-patient transmission related to the exact level of HBV viremia at time of the transmission incident.Reference Gunson, Shouval and Roggendorf 6 , 10 , Reference FitzSimons, Francois and De Carli 23 Among our personnel it was observed that indeed none of the HCWs with baseline HBV loads less than 1×10³ copies/mL surpassed 1×10⁵ copies/mL at any subsequent measurement, against 4 (15%) of 27 HCWs with baseline loads less than 1×10⁴ copies/mL and 6 (17%) of 35 HCWs with baseline loads less than 1×10⁵ copies/mL.
The Dutch policy for HBV-infected healthcare providers allows the highest threshold value to conduct EPPs compared with other countries and consequently has the smallest safety margin to compensate for natural fluctuation of HBV DNA levels. The Cox proportional hazards model shows that the higher the initial HBV load, the greater the hazard ratio. In other words, the higher the previous HBV load the greater the risk of surpassing the threshold value at the next measurement. This raises the question of what interval between control measurements is sufficient to minimize EPPs with DNA levels above the threshold. Our data suggest a strict follow-up of personnel with HBV DNA above 4.8×10³ copies/mL because in this group approximately 7% will exceed the threshold of 1×10⁵ copies/mL after 6 months. In HBV DNA levels just below the threshold (ie, 4.0×10⁴ to 1.0×10⁵) we consider a shorter retest policy—for example, after 3 months—preferable because of the small Dutch safety margin and increased risk of exceeding the threshold. However, because the confidence intervals of the survival plots in our analysis are wide, one can argue whether this shorter retest policy is justified.
A high correlation was observed for each HBV DNA level with the 3 previous loads. In our opinion, for guidelines that recommend lower safety threshold levels of 1×10⁴ and 1×10³ copies/mL for HBV infected personnel, a less frequent monitoring interval is acceptable if 3 consecutive HBV DNA measurements were all below the threshold. Although 9 HCWs did surpass the lower threshold levels during follow-up, none of them surpassed a threshold of 105 copies/mL during total mean follow-up of more than 5 years. In this situation we consider a lengthening of the monitoring interval to 1 year acceptable.
Strict follow-up of personnel with higher HBV loads serves also an individual interest. High HBV DNA levels (>2,000 IU/mL or >1×10⁴ copies/mL) are a strong risk predictor of hepatocellular carcinoma.Reference Papatheodoridis, Chrysanthos, Hadziyannis, Cholongitas and Manesis 24 , Reference Chen, Yang and Su 25 Therapeutic efficacy of antiviral agents has improved in reducing HBV DNA levels significantly in recent years. Several guidelines recommend referral of highly viremic HCWs for antiviral treatment and close monitoring of HBV DNA levels. 26 – Reference van der Eijk, de Man, Niesters, Schalm and Zaaijer 28 Subsequently, successful antiviral treatment of HBV-infected HCWs has resulted in lifting a ban on performing EPP.Reference Daha, Bilkert-Mooiman and Ballemans 19
A limitation of this study is the assumption that HBV DNA measurements were random. This may not be the case because HCWs who are considered to pose a higher risk might be screened more often. However, our results did not confirm this difference in screening procedures because the mean interval between measurements of the lowest and highest baseline levels below the threshold of 1×10⁵ copies/mL did not differ significantly (results not shown). Another limitation is the assumption that in our Cox proportional hazards model the observed event (ie, surpassing 1×10⁵ copies/mL) occurred at the time of measurement, whereas in fact an event may have occurred earlier and was not witnessed because at that time a measurement was not performed. In this respect our survival curves may reflect an optimistic view. During the natural history of HBV infection, HBV DNA levels differ according to one’s phase of disease (ie, immune tolerant, immune clearance, nonreplicative, and reactivation phase).Reference Alexopoulou and Karayiannis 29 We lacked information on the length of the period following the diagnosis related to the HBV DNA measurements, and therefore we could not adjust for differences in time following diagnosis between individuals in our model. Another limitation is that the model is based on 4 groups of equal size instead of on clinically relevant groups based on cut-off values. This could have influenced our results. A larger data set can overcome this limitation in future research on this topic.
A final point that needs consideration is that different laboratories determined the HBV DNA levels using various assays. Studies have shown intra-assay and interassay variability for real-time polymerase chain reaction and signal amplification techniques, with an estimated assay variation margin of 1 log10.Reference Plentz, Koller, Weinberger and Jilg 16 , Reference Caliendo, Valsamakis and Bremer 30 – Reference Schalm and Buster 32 In the Committee’s guideline no uniform “testing practice” is prescribed, apart from the quality control standards that the Committee demands. The possible confounding by disturbance from testing variability in our study remains unclear.
Because of the viral load fluctuations in HBV-infected HCWs who perform EPPs, the ongoing monitoring of viral burden is essential for maintaining patient safety. HBV viremia fluctuations, combined with the monitoring interval, a limited precision of HBV quantification, and the scarcity of data on the link between HBV DNA levels and HBV transmission, demand a safety margin. We suggest a more tailored retest policy with standard retesting every 6 months, with more frequent retesting just below the high threshold value (1×10⁵ copies/mL), and prolonging this interval to 1 year after 3 consecutive levels below the threshold in policies with lower safety values (1×10³ or 1×10⁴ copies/mL).
Acknowledgments
We thank Thea Daha, for the collection and meticulous registration of the data; and the laboratories, for their cooperation with the Dutch Committee for Prevention of Iatrogenic Hepatitis B.
Financial support. None reported.
Potential conflicts of interest. All authors report no conflicts of interest relevant to this article.