Introduction
If governments pursue a more equitable distribution of income, will it help the economic crisis? Has democracy achieved improvements in the equitable distribution of income? Has the economic liberalization that now prevails in the world brought about a reduction in the gulf between rich and poor? Are Social Democratic governments more concerned than others with inequality? To these and other questions we will try to respond in this work. In fact, we hope to contribute to the understanding of behaviour and the determining factors that influence a greater or lesser inequality in income distribution, focusing our attention on the effect that the economic crisis is having on inequality, and on the policies employed in combating the said inequality.
To this end, a model of panel data for the 27 nations of the European Union has been applied, covering a period of 16 years (from 1996 to 2011, inclusive). The use of such a heterogeneous model – made up of nations of differing levels of economic development and which have undergone different historical processes of integration – the inclusion of the institutional variables and the deployment of the ‘crisis’ dummy variable with spending on social benefits are, to our understanding, aspects both relevant and original in the analysis of income distribution, given that empirical studies that use these types of variables are rare in this field.
The objective of this study is to analyse the determining factors in income distribution, so that we may discern the influence of different types of variable, this being the study’s fundamental aim. To this end, we have introduced a series of variables in addition to the ones generally used, such as the ideology of the governing party, the index of economic freedom, the typicality of Scandinavian countries or the indirect tax pressure. The results obtained show that the model used is robust, and that equality in income distribution has diminished with the decrease in the importance of the remuneration of salaried workers within the GDP and with global economic freedom, at the same time improving in countries who apply the Nordic model and where democratic development has occurred. As for the effect that the crisis has had, the results suggest that it is not this alone per se, but also the social policy put in train by European countries during this period, that has increased the lack of equality in income distribution.
The study is structured as follows: after the introduction, in the second section we give an overview of the various explanatory theories on income distribution and carry out an analysis of the determining factors, distinguishing and evaluating those that are economic, and those that are institutional. Then, in the third section, we apply the panel data previously mentioned to the 27 nations of the European Union in order to determine the relative influence of the different variables. Finally, in the fourth section, we demonstrate our conclusions.
Theoretical Background
Since the classical era, economic theory has concerned itself with the question of distribution and performance in economic activity. This interest starts with Quesnay and his ‘Tableau’, which represents as a double-entry chart the various contributions to production of the various branches and, of course, their distribution. Adam Smith and Karl Marx, authors as paradigmatic as they are different, were preoccupied with the subject of distribution. Some of the marginal thinkers such as Leontief and SraffaReference Pasinetti 1 were also interested in the distribution issue. On top of this, there exist various models of distribution and growth arising out of Ricardian, Marxist, Neoclassical and Keynesian theory.Reference Kaldor 2 Keynes and the Post-Keynesians made important contributions to this subject. As PaukertReference Paukert 3 maintains, Keynes transformed the most convincing idea against equality of income into the most important argument in its favour – namely that the frugality of the most opulent classes, far from encouraging economic growth (as the classical school argued), holds it back, and consumption is the most effective method of expanding production in an economy. DuttReference Dutt 4 and TaylorReference Taylor 5 posit a theory of distribution implicit in the General Theory and in the Treatise on Money,Reference Keynes 6 which claims to identify a relationship between distribution theory and effective demand theory. However, KaldorReference Kaldor 2 had already proposed a Keynesian theory of distribution. Basing his argument on long-term considerations, Kaldor used the theoretical tool of the multiplicator in order to explain aspects of distribution. In the same way, other Post-Keynesian authorsReference Kalecki 7 – Reference Pasinetti 9 tried to explain the relationship between production growth and its distributive consequences. Despite this initial interest, no special attention appears to be paid, in conventional macroeconomic texts, to the theme of distribution as a key element in understanding the functioning and development of economies and, in particular, of the less-developed ones. In this sense, distribution analysis has also taken a secondary place in empirical studies.
If in fact there exists no consensus with regard to an economic theory that includes all the relevant aspects of personal income distribution, as opposed to the analysis of functional distribution, which was abundantly developed from the starting-point of the works of David Ricardo,Reference Ricardo 10 then the empirical studies that have recently been addressed to inequality of income distribution have aligned themselves in two directions: (a) analysing the relationship with and/or the effect on economic growth, and (b) analysing the determinant factors in this.
Among studies of income distribution that have been carried out, the majority of them using simple countries, economic growth has been the factor most examined, most of all since KuznetsReference Kuznets 11 proposed his famous ‘U Hypothesis’. His conjecture – that inequality increases in the early stages of development, only to diminish later as part of the development process – has been the object of innumerable subsequent empirical studies. The literature has labelled this approach the ‘Inverted U Hypothesis’. This hypothesis has been contrasted empirically with various results. Some studies have supported Kuznets’ Hypothesis, whereas others have dismissed it.
What is certain is that, around this same area, an abundant economic literature has grown up concerned with proving or refuting its propositions. Since the 1990s, the relationship between economic growth and income distribution has awoken enormous interest among economists. Although there are many opinions concerning the nexus of the two variables, they do not always follow the same line of thought, and emerge as a subject of considerable controversy, in which a variety of approaches can be found.
-
∙ One the one hand, there are those that point to a negative effect of inequality on growth, as is the case with Alesina and Rodrik,Reference Alesina and Rodrik 12 Bertola,Reference Bertola 13 Galor and Zeira,Reference Galor and Zeira 14 PikettyReference Piketty 15 and Perotti,Reference Perotti 16 among others.
-
∙ On the other hand, there are those that maintain that growth has a sparse or even negative impact on inequality, both supported by different sets of data. Thus, for example, Pscharopoulos et al.Reference Pscharopoulos, Morley, Fiszbein, Lee and Wood 17 observe that inequality diminishes in Latin American countries when per capita income rises, while Ravallion and ChenReference Ravallion and Chen 18 can find no reason whatsoever to support this conclusion in their study, which covers 42 countries.
-
∙ In third place, there is yet another set of studies that argue for a two-way influence of inequality over economic growth, of such a form that, beside the influence of growth on inequality, it is accepted that a certain level of inequality can stimulate growth along particular paths of investment.
Another variable that has been used is inflation, to which controversial effects on inequality have been attributed. In some studies, inflation is associated with an expansion of the poverty bubble, most of all in periods of hyperinflation.Reference Lustig and Deutsch 19 Al-Marhubi,Reference Al-Marhubi 20 by means of regressors applied to data drawn from 53 countries in the 1975–1995 period, reaches the conclusion that high inequality in income is linked to a high rate of inflation.
In the same way, the unemployment rate is analysed in numerous studies and there are those that assess the negative impact of this variable on inequality.Reference Bakker and Creedy 21 In the Spanish case, the work of Ayala et al.Reference Ayala, Martínez and Ruiz-Huerta 22 points out certain effects of unemployment on inequality that have little significance. On the other hand Sahn et al.Reference Sahn, Dorosh and Younger 23 see in exchange rate depreciation one of the factors that could trigger an increase in equality if the incomes of the least-favoured (informal sector), tied to the sectors that are most isolated from the outside world, are seen as less affected than the workers in open, dynamic modern technology sectors.
Another variable used is the participation of agriculture in national output. The relative importance of the agricultural sector has been analysed by many authors since the pioneering studies of OshimaReference Oshima 24 or Kuznets.Reference Kuznets 11 This indicator marks the transition to more advanced states of economic development and is related to other interesting variables – such as the percentage of the population that is urban or rural – which combine certain characteristics influential in determining a greater or lesser inequality of incomes.Reference Cameron 25
With regard to demographic factors, such as birth rate or migration, these can have distributive effects, and, at the same time, inequality can stimulate or discourage certain behaviour linked to these demographic variables. Ngwane et al.Reference Ngwane, Ydavalli and Steffens 26 carried out a study based on a regression model, in which the Gini Index is the dependent variable that is explained by demographic variables relating to weightings of certain population groups, gender of the head of the family, etc. By means of this procedure, it was possible to note the cross-effects between demographic variables and personal income distribution. Initial levels of per capita income, inequality and poverty are also considered.
Concerning this, some studiesReference Pscharopoulos, Morley, Fiszbein, Lee and Wood 17 , Reference Alonso 27 have concentrated on the role of education, and these have noted empirically that improving the levels of education is an effective tool in enabling the reduction of inequality and poverty in income distribution.
The inclusion of institutional variables in empirical works that study income distribution is relatively recent and still rare, and this presents two problems: the poor timespan coverage of many indicators, which impedes the proper use of panel data, and the differences that exist with regard to the coverage of countries, a state of affairs that inclines the contemporary investigator to select a group of countries that he proposes to analyse. Even so, the interest that this type of variable has aroused among scholars is bringing about a situation where the data are each time more complete, both in terms of the period of time to be considered and in the number of countries analysed.
In whatever case, we encounter studies with aspects of the political type such as the independence of the central banks, the stability and democratic nature of the system, the economic reforms undertaken, the level of uncertainty and confidence in governments and the degree of openness in the economy. As an example of analysis of these types of factors, Al-MarhubiReference Al-Marhubi 20 introduces variables that register the frequency of coups d’état and revolutions, the number of political transitions and the repercussions these have on the changes of governors of the central issuing bank. By means of disturbances and socio-political instability, Alesina and PerottiReference Alesina and Perotti 28 and Benhabib and RustichiniReference Benhabib and Rustichini 29 have developed studies in which they show the negative effect of widespread inequality on economic growth owing to a rise in crime, social unease and political instability, which a high level of inequality provokes. Afonso et al.Reference Afonso, Schuknecht and Tanzi 30 demonstrate that, to the extent that the quality of the institutions is better – as measured through the judicial system, bureaucracy and regulation – then the more efficient is social spending and the fairer is the distribution of income.
Finally, there is a small group of investigators who have tried to analyse the relationship between the economic crisis and inequality of income distribution. Thus, Wisman and BakerReference Wisman and Baker 31 conclude that the lack of equality in income distribution is one of the dislocators causing the financial and economic crisis. However, Atkinson and MorelliReference Atkinson and Morelli 32 do not manage to arrive at any firm conclusion that the rise in inequality is one of the causes of the economic crisis. On the contrary, empirical evidence shows that the financial crisis carries with it an increase in inequality.
The Model
The Tobit model and a linear model are used, in the hope of explaining the distribution of income by means of economic, institutional and geopolitical variables, as has already been indicated.
The time period we have considered has been restricted by the availability of data, fundamentally data on institutional variables. We have been able to generate a panel data model for a 16-year period, taking in 1996 to 2011. In this sense, the use of panel data in order to study the economic and institutional determinants of income distribution is ground-breaking in that the majority of empirical studies employ cross-sectional data, for the reason that the institutional indices have been created relatively recently and that it has not been previously possible to deploy them in a series of more than ten years for some of these indicators. In this way, we have been able to analyse 432 observations for each one of the variables used, since we have employed a sample of 27 countries over a 16-year period.
Data
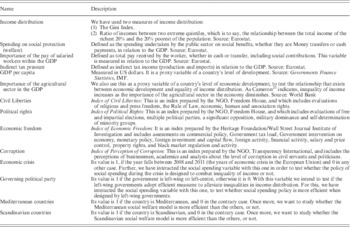
The variables we have used are summarized in Table 1.
Taxonomy of the modelled variables

Source: Compiled by authors.
The Model
The Tobit model used here has been estimated to maximum likelihood, and the linear model has been estimated through the estimators of Feasible Generalized Least Squares (FGLS), Panel Corrected Standard Errors (PCSE) and Robust Generalized Method of Moments (RGMM) for dynamic panel data. In the case of this second model, at the time of choosing these estimators a series of tests was carried out in order to determine the most efficient, in accordance with the variables used.
In first place, we applied the Lagrange Multiplier Test for random effects. The value obtained for chi squared (χ 2) led to rejection of the null hypothesis, making the use of Ordinary Least Squares (OLS) for the random effects model preferable to the pooled model (pooled OLS) – that is to say, the usual OLS estimator.
Secondly, we carried out a similar test in order to determine whether the estimator for fixed effects was also better than the pooled model. The F test for the significance of fixed effects showed that, effectively, it is preferable to use the fixed effects estimator.
In the third place, the Hausman test was used to decide between random and fixed effects. The value of χ 2 obtained allows us to reject the null hypothesis, which is to say, the difference between the coefficients of random and fixed effects is clearly systemic, making it convenient to use fixed effects.
In the fourth place, the Wooldridge test was carried out. This test demonstrated that the model did not have any autocorrelation problems. Finally, the modified Wald test proved that the model is heteroscedastic. In order to solve this, the two best estimators are Feasible Generalized Least Squares (FGLS) and Panel Corrected Standard Errors (PCSE). Although, Beck and KatzReference Beck and Katz 33 demonstrated that the standard errors of PCSE are more precise than those of FGLS, as the authors showed that when N>T (as is the case where N=27 and T=16), and that FGLS should not be used, we decided however to use both models, in order to check the robustness of the model.
In addition, regarding the possible existence of an endogeneity problem in the fiscal variables and the variables that measure the economic growth and social spending, we decided to use the GMM estimatorReference Arellano and Bond 34 for dynamic panel data in its robust version due to the presence of heteroscedasticity. We used the lagged fiscal variables and those that measure economic growth and social spending as instruments, and the exogenous variables. The comparison of the results obtained through this estimator with those obtained with FGLS and PCSE once again allows the analysis of the model’s robustness.
We have used panel data to jointly evaluate all the economic, institutional and geopolitical variables used. Using panel data instead of cross-section analysis – which is the most often-used by those investigators who employ institutional variables for previously-mentioned problems of data availability – allows us to check individual heterogeneity, produce data with a higher degree of variability and a lower level of collinearity among the regressors, study dynamic adjustment processes, identify and measure effects that are not detectable with pure cross-section or time series data, and build and contrast models of more complex behaviour than would be possible with simpler data.
We have undertaken eight separate estimations depending on the estimator used and the measure of inequality employed, which is to say, the Gini Index and the income ratio between the 20% richest and 20% poorest of the population.
In this way, we have estimated using the following models.
-
∙ Tobit model
(1) \hskip -59pt$$ID_{{it}} {\equals}\left\{ {\matrix{ {ID_{{it}}^{{\asterisk}} } & {{\rm if}} & {0\,\lt\,ID_{{it}}^{{\asterisk}} \,\lt\,100} \cr 0 & {{\rm if}} & {ID_{{it}}^{{\asterisk}} \leq 0} \cr 0 & {{\rm if}} & {ID_{{it}}^{{\asterisk}} \,\gt\,100} \cr } } \right.$$
(2)
$$\eqalignno{ ID_{{it}}^{{\asterisk}} \,{\equals}\, & \alpha {\plus}\beta _{1} SOCIAL__{{it}} {\plus}\beta _{2} WAGE_{{it}} {\plus}\beta _{3} ITAX_{{it}} {\rm {\plus}}\beta _{4} Y_{{it}} {\plus}\beta _{5} AGR_{{it}} \cr & {\plus}\gamma _{1} ICL_{{it}} {\plus}\gamma _{2} IPR_{{it}} {\plus}\gamma _{3} IEF_{{it}} {\plus}\gamma _{4} IPC_{{it}} {\plus}\lambda _{1} NORDIC_{{it}} \cr & {\plus}\lambda _{2} MEDITERRANEAN_{{it}} {\plus}\lambda _{4} PARTY_{{it}} {\plus}\theta _{1} CRISIS_{{it}} \cr & {\plus}\theta _{2} SOCIAL{\rm \_}CRISIS_{{it}} {\plus}\theta _{3} SOCIAL{\rm \_}PARTY_{{it}} {\plus}\eta _{i} {\plus}\delta _{t} {\plus}\mu _{{it}} $$
-
∙ Linear model


 $$\eqalignno{ ID_{{it}} \,{\equals}\, & \alpha {\plus}\beta _{1} SOCIAL_{{it}} {\plus}\beta _{2} WAGE_{{it}} {\plus}\beta _{3} ITAX_{{it}} {\rm {\plus}}\beta _{4} Y_{{it}} {\plus}\beta _{5} AGR_{{it}} \cr & {\plus}\gamma _{1} ICL_{{it}} {\plus}\gamma _{2} IPR_{{it}} {\plus}\gamma _{3} IEF_{{it}} {\plus}\gamma _{4} IPC_{{it}} {\plus}\lambda _{1} NORDIC_{{it}} \cr & {\plus}\lambda _{2} MEDITERRANEAN_{{it}} {\plus}\lambda _{4} PARTY_{{it}} {\plus}\theta _{1} CRISIS_{{it}} \cr & {\plus}\theta _{2} SOCIAL{\rm \_}CRISIS_{{it}} {\plus}\theta _{3} SOCIAL{\rm \_}PARTY_{{it}} {\plus}\eta _{i} {\plus}\delta _{t} {\plus}\mu _{{it}} $$
where,
ID is the income distribution, measured by means of two variables, these being the Gini Index and the ratio between the income of the 20% richest and 20% poorest in the population; SOCIAL is the total spending on social benefits in relation to GDP; WAGE measures the importance of the pay of salaried staff for the GDP; ITAX measures indirect tax pressure; Y is per capita income, measured through GDP; AGR is the importance of agriculture within the GDP; ICL is the Index of Civil Liberties; IPR is the Index of Political Rights; IEF is the Index of Economic Freedom; IPC is the Index of Perceived Corruption; NORDIC is a dummy variable which takes a value of 1 if the country is Scandinavian; MEDITERRANEAN is a dummy variable which takes a value of 1 if the country is Mediterranean; PARTY is a dummy variable which take the value 1 if the governing party is left-wing; CRISIS is a dummy variable which takes a value 1 if the year falls between 2008 and 2011; SOCIAL_CRISIS is the interaction between social welfare spending and the dummy variable CRISIS, which is to say, social spending for the EU countries is taken into account only during the years of the economic crisis; SOCIAL_PARTY is the interaction between social welfare spending and the dummy variable PARTY, which is to say, social spending for the EU countries is taken into account only when the government is left-wing; η i collects individual, specific, unobserved (but constant in time) effects for each country, and δ t measures temporary unobserved effects that are variable with time but identical for all countries.
Results
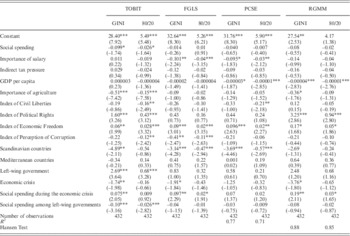
After estimating the Tobit model with maximum likelihood and the linear model with FGLS, PCSE and RGMM, verifying the model as globally significant and, in the case of the GMM estimator, checking that the instruments are valid through the Hansen Test, we obtained the results we can see in Table 2.
Results of the estimations

*Significant at 10%. **Significant at 5%. ***Significant at 1%.
The first conclusion that one finds on observing Table 2 is that the results do not vary substantially, whichever estimator is used, nor do they vary with the inequality variables employed. This enables us to affirm that the model used is robust. In addition, the R 2 is close to 0.77, so the quality of adjustment is good, and the Hansen Test gives a value greater than 0.05, so that the instruments used in the dynamic model are valid.
As for the values we have obtained, most cases coincide with what is expected a priori. In this way, the social policies put in place by governments and measured in terms of public spending on social benefits do reduce inequalities in income distribution, although the significant level is very low. This result accords with that obtained by Afonso et al.,Reference Afonso, Schuknecht and Tanzi 30 in that greater public spending leads to greater equality in the distribution of incomes. Similarly, Keizer and SpithovenReference Keizer and Spithoven 35 conclude that in the Dutch case, inequality of income diminishes as the welfare state expands and, on the other hand, Ovaska and TakashimaReference Ovaska and Takashima 36 maintain that welfare inequality can be explained in terms of inequality of income, quality of health care and quality of institutions. Furthermore, as AtkinsonReference Atkinson 37 points out, redistributive intervention in public spending is justified in terms of aversion towards inequality.
The introduction of the variable that measures the importance for the GDP of remuneration of salaried workers did not produce any definitive result, given that the estimated regressor is not significant for all the estimations, but for those estimations for which the regressor is significant, the negative sign shows that the decrease in the importance of the remuneration of salaried workers has been experienced in relation to the gross operating surplus, which has increased the inequality in income distribution. To the extent that the effect of the indirect tax pressure on income distribution is not significant, it is not possible to affirm that the regressivity of indirect levying generates any major inequality in income distribution. In this sense, the majority of EU countries have established a VAT of varying rates, and this has had the effect of softening the regressive nature of taxation. In fact, Denmark is the only country to have a unique rate of VAT. Furthermore, the importance which special taxes have acquired in certain countries could explain the obtained result. In the same way, this result does not differ substantially from the study of Afonso et al.,Reference Afonso, Schuknecht and Tanzi 30 who obtained an insignificant regressor for the direct taxation variable, and whose sign fluctuated with the dependent function used.
We measured the effect of economic development by means of two variables, GDP per capita and the importance of agriculture in the economy, and the results obtained are contradictory. Thus, in the first case, the estimated regressor is negative and significant in some of the estimations, and so the greater the GDP per capita the more equitable the income distribution. However, the estimated value is very close to zero. On the other hand, the regressor obtained to measure the effect of the importance of agriculture in income distribution is only significant in the Tobit model. In this case, the negative sign enables us to conclude that economic development, in so far as it exists, worsens the equality of income distribution. This result is in agreement with the results obtained by Ravallion and Chen,Reference Ravallion and Chen 18 for whom economic growth does not reduce income inequalities. In addition, CameronReference Cameron 25 maintains that inequality is greater in urban areas, along with which economic development, measured in terms of the diminished importance of agriculture in the overall economy, has a negative effect on income distribution.
In so far as the effect of the index of civil liberties on income distribution merits attention, the regression coefficient obtained is negative. Since this indicator (as with the index of political rights) is defined in such a manner that those nations with a lower index enjoy greater civil liberties, it implies that those European countries in which greater freedom of speech, belief and association exist, and that enjoy secure juridical systems, suffer a greater inequality in income distribution – at least when we apply the income ratio between the 20% richest and 20% poorest of the population. According to the Gini Index, the estimated value of this variable is not significant. However, in the case of the estimated parameter for the index of political rights, the positive and significant sign allows us to affirm that the greater the degree of democracy reached by the nations of the EU, the greater the equality of income distribution. With regard to the impact of economic freedom on income distribution, the result is positive and significant. In this regard, the liberalization of commercial regimes, the reduced intervention of governments in the economy, the free circulation of capital and the freeing-up of the labour market have led to a major inequality in income distribution. Previously, we pointed out that intervention in the public sector improves income distribution, and so a major liberalization of the economy, logically, increases inequality in the distribution of incomes. Further, this result supports the thesis of Hall and Ludwig,Reference Hall and Ludwig 38 for whom the more liberal societies do not propose to fight inequality of income distribution. In the case of corruption, there is only a significant and negative effect on income distribution in three of the estimations. Thus, when the degree of corruption in a country is greater, the inequality in income distribution is also greater. In this sense, Molina et al.Reference Molina, Amate and Guarnido 39 conclude that those countries that present a higher incidence of corruption spend less on social benefits, which means that inequality of income distribution is greater.
Concerning the analysis of the efficiency of the Scandinavian and Mediterranean models in the struggle against inequality in income distribution, we observe that the significance of the estimated parameter for Scandinavia, and the non-significance of the Mediterranean model, enables us to conclude that the Scandinavian example, which concentrates its efforts on the young population, is more effective in the achievement of a fairer distribution of income than is the case with the Mediterranean model, which is founded on social benefits and which is focused on the older population.
As far as the effect of the ideology of the governing party of each country on income distribution is concerned, the result is not very significant and positive, so we cannot state that left-wing governments are the ones who make improvements in the distribution of income. However, when we combine the social spending and governing ideology variables, that is to say, when we analyse the effect of social policy when it is operated by left-wing governments, we observe that the sign change is negative, but it is not very significant, and so we cannot emphatically conclude that spending on social benefits is far more effective in the struggle against inequality of income distribution when it is carried out by left-wing governments.
Finally, we estimated the effect that the economic crisis has had on inequality. The negative sign, although only significant for the Gini Index, allows us to conclude that, in principle, the economic crisis through which the European countries have lived since 2008 has not caused serious income inequality. This result supports the thesis of Wisman and Baker,Reference Wisman and Baker 31 who argue that the lack of equality in income distribution is one of the dislocators in the economic and banking crisis, and not one of its consequences, as Atkinson and MorelliReference Atkinson and Morelli 32 maintain. However, when we analyse the efficacy of social policies during the present crisis, the positive sign suggests that governments are redesigning social spending in such a way that the reduction of inequalities of income distribution is no longer a prime objective. In this sense, it must be borne in mind that the policy of adjustment being undertaken by the majority of EU countries is altering the weighting of each benefit within the social spending budget. Thus, unemployment benefits are taking on major importance because of the expanding numbers of unemployed Europeans, and the main purpose of this benefit is to restore, not to redistribute, income.
Conclusions
The results obtained in our study permit us to conclude that both the sample used and the variables employed greatly enrich the analysis. Despite forming part of the same economic bloc, the 27 countries analysed offer differences in both their levels of economic development and the historical, cultural, political and economic experiences which they boast. Added to this, the inclusion of institutional variables and the effect of the crisis on the analysis of determinants of income distribution in the case of the EU countries make for very interesting results, as we understand them.
How has the crisis affected the struggle against inequality of income distribution? To answer this question has been the fundamental aim of this study. The results obtained enable us to conclude that while the crisis has not necessarily engendered a worsening in inequality, the response of European governments by means of social policy has not so far proved effective in achieving a major equalization in income distribution, probably because inequality has dropped to the status of a secondary objective, as is reflected in the policies of cuts that most European governments have applied.
Thus, we can observe differences among the countries. In concrete terms, the Scandinavian countries have succeeded in distributing income in a more equal way. This is also the case in those countries in which the remuneration of salaried workers has lost importance in relation to capital gains. When social policy is designed and implemented by governments of the Left, more substantial improvements in fair income distribution are achieved.
Finally, in those countries where a greater degree of democracy has been attained, and where corruption is combated with greater firmness, and which boast less liberalized economies, lower levels of inequality have also been achieved.
Ignacio Amate-Fortes was Vice-Dean of the Economic and Business College at the University of Almeria. Currently, he is Associate Professor at the Department of Economics and Business of the University of Almeria, Spain. His research fields are public economics, inequality, development and international economics. He has more than 25 publications, with the most recent ‘On the Perpetuation of the Situation of Economic and Social Underdevelopment in Africa’, in the Journal of African American Studies, 19(3), 2015. In 2011, Almudena Guarnido Rueda and he received the VI Unicaja´s Prize in Economic Research.
Almudena Guarnido-Rueda is Associate Professor at the Department of Economics and Business of the University of Almeria, Spain. Her research fields are public economics, inequality, development and industrial organization. She has more than 25 publications, with the most recent ‘On the Perpetuation of the Situation of Economic and Social Underdevelopment in Africa’, in the Journal of African American Studies, 19(3), 2015. Together with Ignacio Amate Fortes, she received the VI Unicaja´s Prize in Economic Research in 2011.
Agustin Molina-Morales is Full Professor of Public Economics at the department of Economics and Business of the University of Almeria, Spain. He has more than 100 publications, but his most recent publication is ‘On the Perpetuation of the Situation of Economic and Social Underdevelopment in Africa’, in the Journal of African American Studies, 19(3), 2015. Currently, he leads the research group ‘Almeria Group of Applied Economics’.