1. Executive Summary
A key motivation of this paper is to highlight the broad range in quality of judgements applied in actuarial work. The topic of expert judgement in the context of Solvency II requirements has already been covered in Ashcroft et al. (Reference Ashcroft, Austin, Scolley and Makin2015) Since judgements are also integral to the day-to-day functioning of the business, this paper attempts to widen this discussion even further. In this light, we are here more interested in the vernacular understanding of the term “expert judgement”, thereby also capturing judgements that may fall outside the scope of regulation.
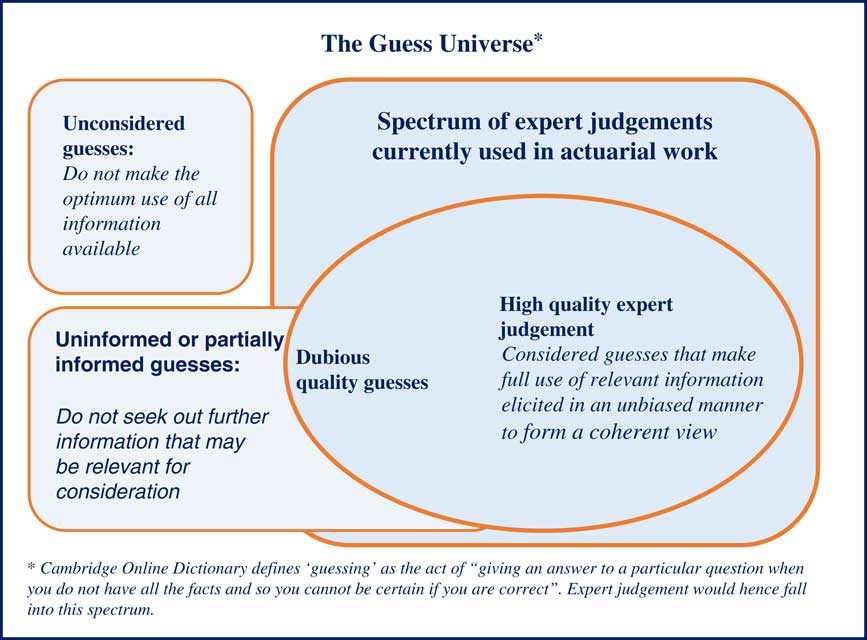
The spectrum of judgements, or “guess universe”, encompasses guesses informed with little knowledge of the situation under consideration from one end of the spectrum to high-quality expert judgement at the other. At one level, the process of forming either a guess or expert judgement can appear similar, i.e. how to form a view in the presence of incomplete information and both guesses and expert judgements can be delivered with confidence and can be hard to falsify. However, we typically give high-quality expert judgement more credence than other items badged as guesses. Expert judgement often has a greater degree of rigour applied to its formation. It accesses information sources that are not readily available to an individual forming a guess, and includes a critical analysis of these information sources before taking a view. The key consideration is where on this spectrum particular expert judgements lie and how we can move the high materiality judgements from left to right, i.e. improve their robustness and accuracy (Figure 1).
The guess universe ranges from low-quality guesses to high-quality expert judgement

1.1. Key Findings
We have conducted a number of studies to assess how actuaries use new information to update previous views, how to best elicit expert judgements and the extent to which actuaries may be less prone to biases exhibited by the non-actuaries when dealing with information. Often our sample sizes have been too small to draw any statistically significant conclusions but nonetheless some interesting observations have been identified. In addition, as this is the first time we are aware of such studies being performed on actuaries, we recommend further studies to be conducted to assess the robustness of the results.
-
∙ An individual’s judgement is likely to be affected by cognitive biases. Actuarial training in statistical concepts and techniques may provide some immunity to these biases, but the extent to which this exists is not clear.
-
∙ In areas where actuarial intuition is likely to be less reliable – for example, in dependency estimation – the end result is sensitive to how the problem is framed. This finding is consistent with those from statistical studies on non-actuaries where similar types of bias are observed.
-
∙ The actuary’s inherent bias towards the use of data-intensive methods affects the way that they process data with a clear preference towards the use of “hard data” as opposed to more qualitative information. The latter is often discarded as it is not clear how this should be used or the credibility weighting that should be attached to it.
-
∙ Actuaries in our studies exhibited divergence in methods to incorporate new information into their view. We find that the sequencing of information arrival can materially affect the end result. We speculate that part of this may be an attempt to tackle the issue where the actuary is being asked to express a view on a changing risk. On being primed to process the data in a certain way, this divergence can be reduced. This is explored further in section 9 of this paper.
1.2. Additional Findings
Our secondary findings explore how the process of eliciting information may be improved.
-
∙ Deconstructing a seemingly simple question can be insightful and reveal the hidden assumptions or frames of reference used by the questioner. Making these explicit will ensure that both the questioner and the respondent have the same understanding of what is being asked.
-
∙ The sequencing of questions can be important. For example, it may be better to build up the questions gradually for the more remote percentiles to allow the respondent an opportunity to review their beliefs before answering.
-
∙ Conducting group elicitation is a skill. Assessing the health of the group dynamics is an important factor in determining the quality of the group’s output. In addition, conducting both group and individual exercises can result in more robust challenges before converging on a consensus.
-
∙ Individuals with a broad range of experience are more likely to provide reliable expert judgements than non-experienced individuals.
2. Introduction
2.1. Background and Motivation
Actuarial research has historically focussed on quantitative methods. For example, there is a significant volume of research on stochastic reserving techniques. Yet most, if not all, practitioners involved in assessing reserving risk would confess to use at least as much reliance on judgement in the calibration of their models as any stochastic methodology. Whilst there is extensive literature available on judgement formation in the psychological sciences, there is little that is specific to actuarial work.
The level of judgement which is applied in actuarial work is often driven by data availability and we can exploit expert judgement to complement sparse data sets. Even in cases where actuarial views appear to be driven by extensive data analysis, judgements are applied in order to determine what data are relevant to the problem, which data filters to apply (e.g. the total or partial removal of outliers) and in assessing how changes in environmental conditions may affect future values of variables. Expert judgement is often applied in such circumstances by first assessing the extent of what is known and then applying expert judgement to derive suitable adjustment factors.
Expert judgements are typically based on the intuition of credible experts and will be affected by the expert’s spread and depth of experience, particular scenarios the expert has experienced and the emotional resonance these scenarios may carry with the expert. They will hence be subject to a degree of bias. Currently, there is little assessment of the degree of bias to which experts are subject or the extent to which this may compromise the integrity of judgements gained. We have observed that the quality or robustness of any expert judgement can vary significantly.
2.2. Web-Based Survey
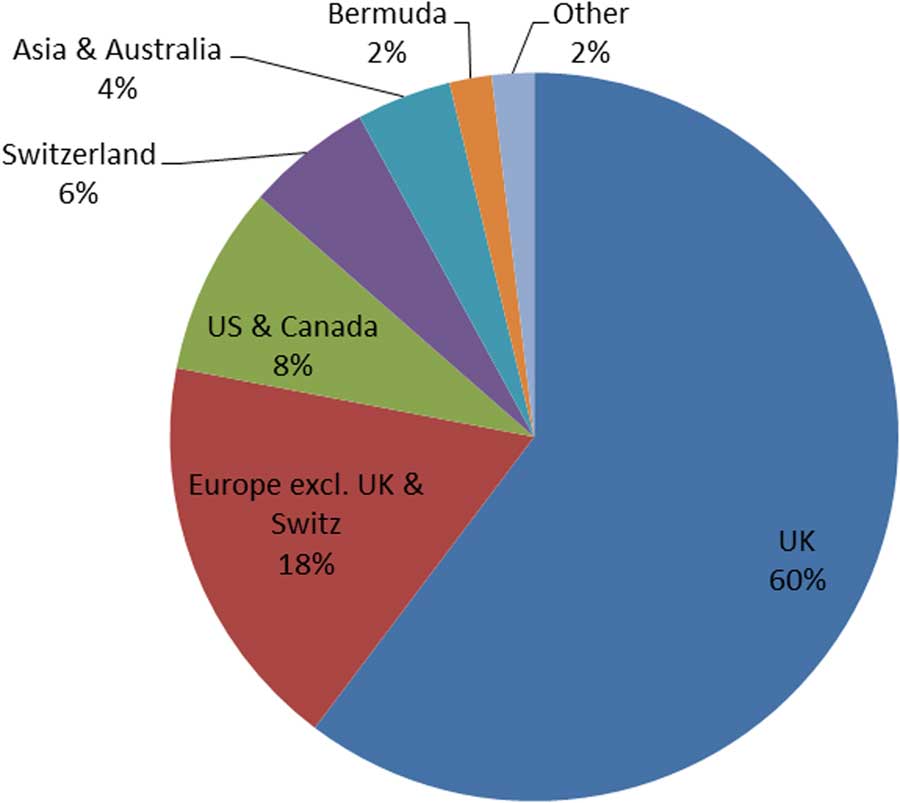
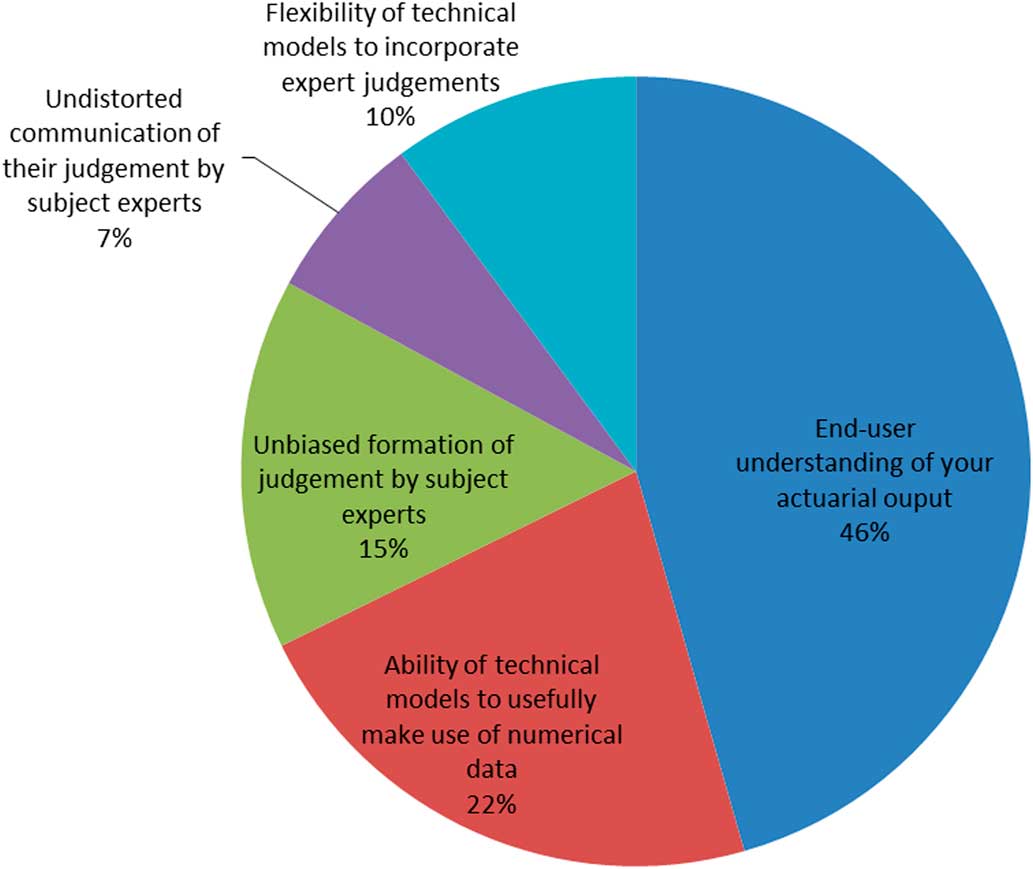
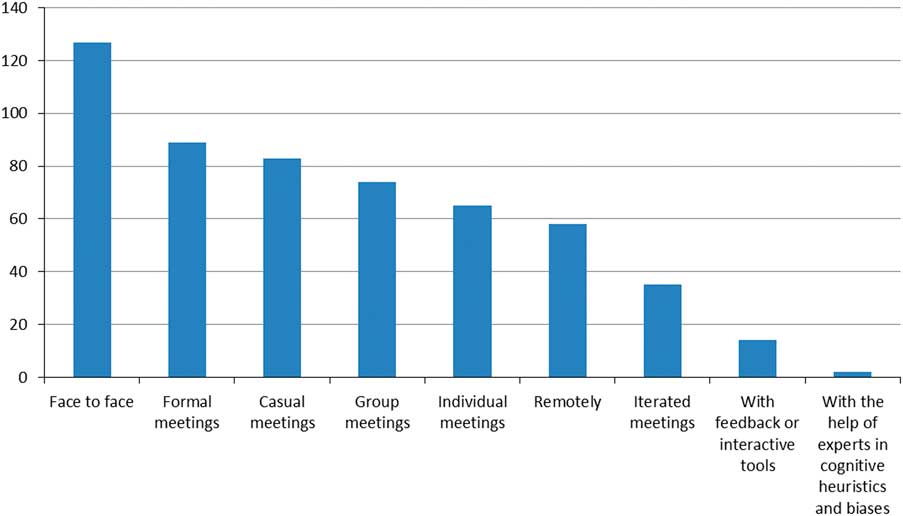
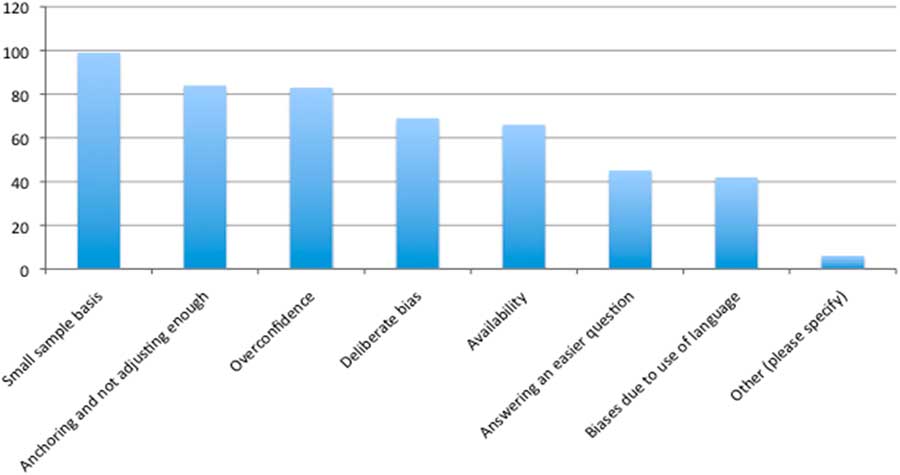
The working party conducted a web-based survey in July 2014 aimed at obtaining actuarial practitioners’ views on
-
∙ the most important issues to consider when making judgements;
-
∙ methods used to elicit judgements;
-
∙ types of bias commonly encountered in elicitation; and
-
∙ how respondents were aiming to address them.
There are some key takeaways from the survey which provided much of the motivation for the work of the working party.
-
∙ Understanding how high-quality expert judgement is formed is important to a range of actuarial practitioners.
-
∙ Most survey participants are aware of and have encountered some of the cognitive biases, and are planning to do “something” to address them.
-
∙ Further work is needed to enhance the awareness of the lesser-known biases and to identify techniques that can be used to mitigate them.
-
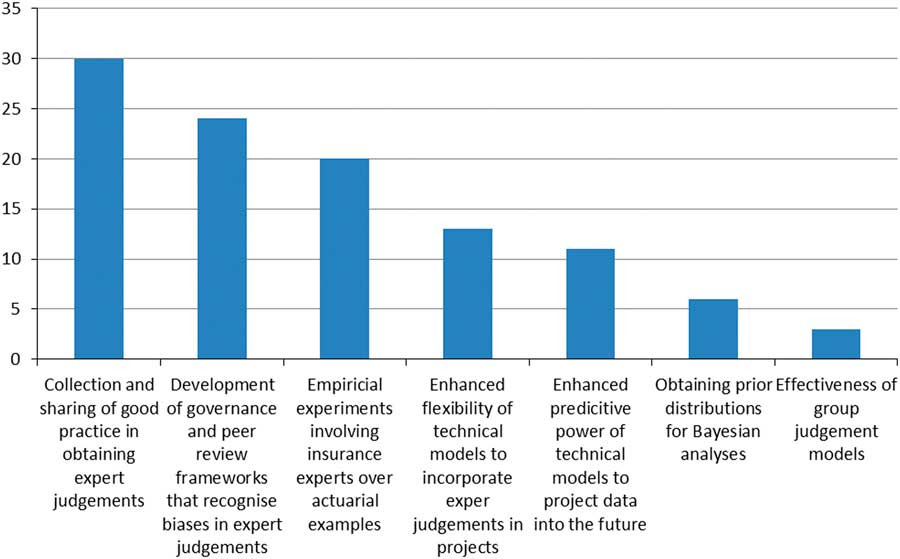
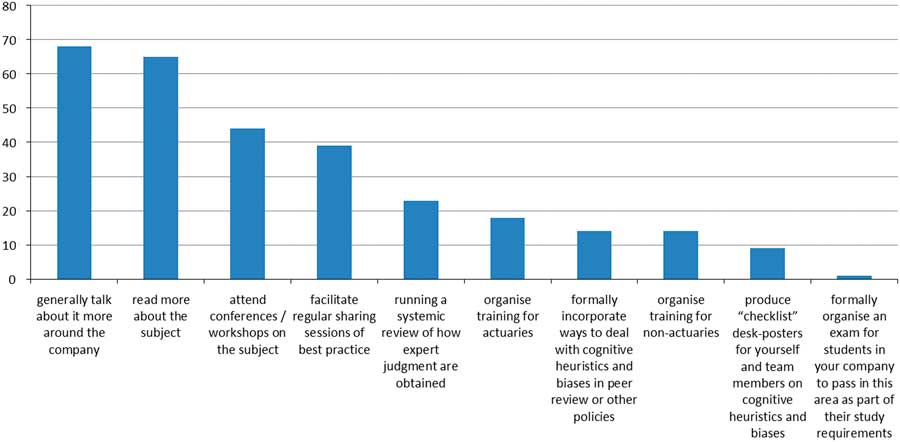
∙ Survey respondents are planning to discuss the topic within their firm and some are planning to facilitate sessions. There is less appetite, currently, for formal training on the subject.
Full results of this survey are included in the Appendix.
2.3. A Contentious Issue
We had a few debates within the working party whilst writing our paper. It may be illuminating to briefly share the substance of these with the reader to show how the thought process of the group evolved as the paper progressed.
The Getting Better Judgement Working Party felt that some readers may be uncomfortable with the positioning of expert judgement as a guess. When taken out of context such statements have the capacity to undermine the credibility of the actuary. Despite this we felt that transparent discussions on the uncertainties attached to and the varying quality of expert judgements needed to occur in order to make progress. We wanted to move the discussion beyond such implicit positions such as “Trust me, I am an actuary”. Expert judgement is at most a considered view which is formed in the presence of incomplete information: no expert can be expected to have perfect foresight and we think that our clients and stakeholders sometimes need reminding of this fallibility. By not shying away from such statements, the actuary in our minds can then start a proper dialogue on the states of the world on which the view hinges, and discuss the uncertainties present.
Furthermore, we feel that it is important that expert judgements are challenged from a number of different perspectives that include both quantitative and qualitative elements, the latter of which, in particular, may be more prone to being neglected by the actuary.
2.4. Solvency II and Expert Judgement
The recent few years have seen an increasing interest in the study of judgement in society. The recent crisis reminded the financial industry that technical modelling alone cannot guarantee adequate risk management. Excellent books such as Thinking, Fast and Slow by Kahneman have raised wide awareness of issues related to human judgements.
In addition, the Solvency II regime requires the explicit recognition and monitoring of the use of judgements in approved internal models. It is difficult to imagine some of the recent actuarial conference presentations and papers on judgement without the catalyst of Solvency II.
Nevertheless, we shall only mention the regulatory regime twice more after this section, both times as passing references. Instead, the reader will be reminded regularly that judgement is important in all areas of general insurance actuarial activities: reserving and pricing, as well as capital modelling. The aim is to arm the insurance practitioners with tools to work more effectively with judgements in general, rather than acting as a guide to comply with specific regulatory requirements.
Judgements in the actuarial context are invariably made by perceived or actual experts, even if they could, on occasions, be classed as low-quality guesses. This paper will therefore continue to use the phrase “expert judgements” to denote these judgements, whether or not they come under Solvency II Expert Judgement guidance.
2.5. Outline of this Paper
The remainder of this paper is structured to discuss specific areas of actuarial work, the potential for different biases associated with these areas and how we might overcome the biases. The remaining parts of this paper are structured as follows:
-
∙ Section 3 outlines the most common biases identified in the literature.
-
∙ Section 4 outlines a framework for assessing expert judgement as “high quality”.
-
∙ Sections 5–7 present individual case studies examining common areas of expert judgement in actuarial work.
-
∙ Sections 8 discusses the topic of group elicitation.
-
∙ Section 9 presents the results of an empirical study carried out with the help of actuaries.
-
∙ Section 10 concludes this paper with our final thoughts.
3. An Overview of Cognitive Biases
First, we examine some of the more common biases, or “heuristics”, which may arise in the elicitation of expert judgement. These mental shortcuts or rule-of-thumb approaches allow experts to solve problems and make judgements quickly without having to carry out a complete in-depth analysis. They are key to the formation of an expert’s intuition. However, by doing so, experts may introduce cognitive biases to their judgement subconsciously. 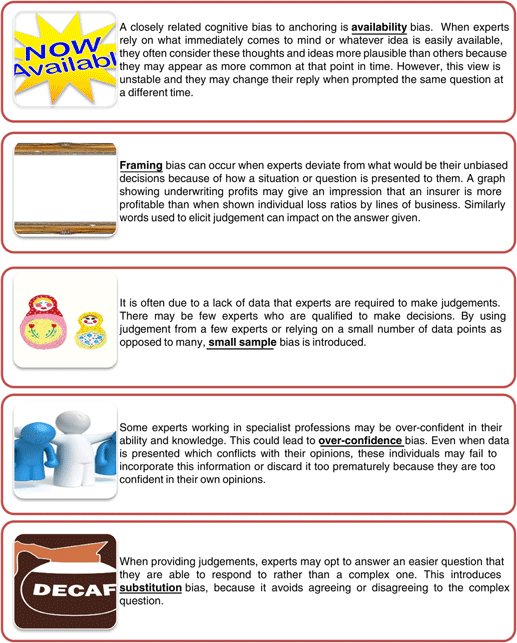
For those who are interested in further reading we suggest the following as valuable starting points:
-
∙ Uncertain Judgements – Eliciting Expert’s Probabilities (O’Hagan et al., Reference O’Hagan2006).
-
∙ Thinking, Fast and Slow (Kahneman, Reference Kahneman2012).
-
∙ Lloyd’s of London’s paper on cognition (Weick et al., Reference Weick, Hopthrow, Abrams and Taylor-Gooby2013).
4. High- and Low-Quality Expert Judgements
In section 3, we have highlighted a range of biases which can materially influence the result of an expert judgement elicitation process. Perhaps one of the key questions in this paper is the following:
“Given the existence of bias, how do we distinguish between high-quality expert judgements and other guesses?”
We first set out characteristics of high- and low-quality expert judgements in this section. This is followed by discussion of methods to improve the quality of judgements, for those judgements that are proportionately more material. This includes discussions on the setting of an expert judgement policy, identification of relevant judgements and experts.
At one end, low-quality expert judgements can be made quickly, may be made by someone with no specific expertise and do not require a clear logic or rationale. At the other end of the spectrum, high-quality expert judgements are often the result of a structured rationalisation process, made by someone with relevant expertise and who explicitly considers the areas of uncertainty and validity of the assumptions made.
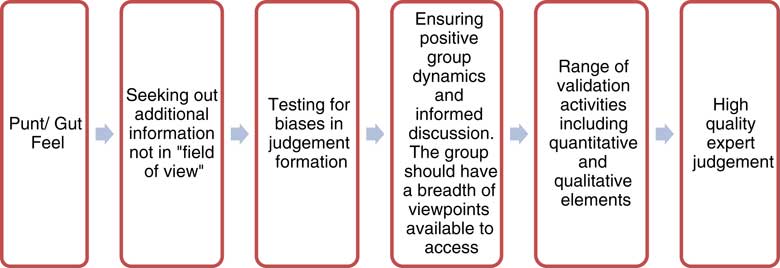
Figure 2 represents a spectrum of judgements or processes which build upon each other with increasing sophistication from left to right.
A spectrum of judgements and process with increasing sophistication from left to right
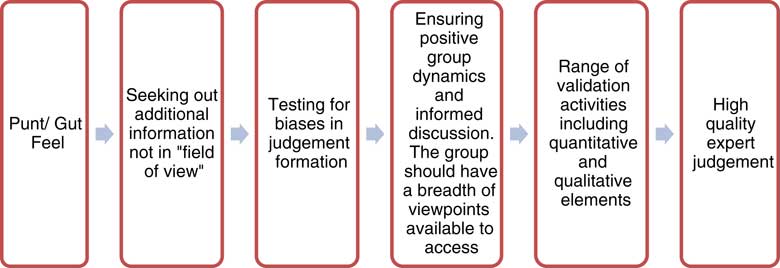
“Punts” or “gut feel” tend to be the product of a seemingly intuitive thought process that is quick, but not necessarily structured or tested. It is often the product of an individual mind, or a single narrative view of the world which may itself be subject to strong availability bias. Whilst this may be a reasonable method to approximate an order of magnitude view of the assumption, there is no rigorous mechanism to amalgamate a range of different views, challenge them or attach a credibility ranking and form an integrated world view. All of these would result in further refinement and pinpointing more precisely where the parameter value may be expected to lie and would be the hallmarks of high-quality expert judgement.
By contrast, high-quality expert judgement would further aim to actively search for a range of different scenarios and assess the issue from different perspectives. Lateral thinking would be applied, and related and seemingly unrelated issues may be examined for insights they may provide into the issue at hand (de Bono, Reference De Bono2015). There would be a coherent attempt to distinguish between the values provided by different pieces of information. Judgement would be suspended until a full discussion of scenarios has taken place and coherence of inputs tested. This ensures that the participants are not working off inaccurate preconceptions. The output would then be challenged by a range of different validation activities and parameter values may be further refined using the insights gained from this process.
4.1. Setting the Process: The Expert Judgement Policy
As a starting point for elicitation, establishing an expert judgement policy is recommended. This policy should outline a framework for the processes which are to be followed:
-
∙ identification of the relevant assumptions where expert input is needed and their relative levels of materiality for the business;
-
∙ identification of the expert for the specific assumption;
-
∙ how to optimise the elicitation process including communication aspects and strategies to minimise bias;
-
∙ approaches to validation; and
-
∙ the required documentation.
We will be covering the first two steps summarised in our list above in sections 4.2 and 4.3, whilst the remaining three items will be dealt with in section 5.
In light of the varying materiality of different expert judgements, companies could consider the use of different methods for the most material judgements, as well as an increased emphasis on peer review and validation in respect of these.
A formal expert judgement policy will already exist for the firms developing an internal model under Solvency II. However, such a policy could also be invaluable for some areas of reserving or pricing work that may fall outside the scope of the internal model. The policy could be set within pricing and reserving policies or as an over-arching policy which encompasses all areas of actuarial work within the business.
An explicit expert judgement policy or reference in related policies could also identify the scope of expert judgement within different actuarial processes. For example, we may expect that – in the context of reserving – a (non-actuarial) expert judgement may be applied during the large claims review.
4.2. Identification of the Relevant Judgements and Updating Processes
Once the expert judgement policy is set up, we need to identify the judgements necessary for a given process. This should include the following information:
-
∙ date the judgement was set and subsequently updated;
-
∙ judgement owner and experience that qualifies them as an expert for that particular assumption;
-
∙ process of peer review and sign off (e.g. by colleague, director or relevant internal board);
-
∙ rationale for the judgement and validation;
-
∙ updating/falsification process; and
-
∙ identification of materiality.
Proportionate process design is key to its success, i.e. the extent to which the full process needs to be applied depends on the materiality of the judgements involved. A recent actuarial working party report on expert judgement (Ashcroft et al., Reference Ashcroft, Austin, Scolley and Makin2015) provides a detailed discussion of a process for the more critical or material judgements. More informal arrangements that encompass the above bullet points to various degrees can be formulated for judgements that are less impactful.
4.3. Identifying the Expert
The expert judgement policy should address the identification of appropriate and relevant experts within the context of the work. It should be relevant to ascertain and assess the individual on the following:
-
∙ Professional qualifications – as we noted earlier in this paper, our studies have identified that trained and experienced individuals can offer more accurate judgements that are less subject to cognitive biases than those less experienced. This is particularly likely to be the case with the estimation of more central outcomes.
-
∙ Current position and years employed within the firm – long-serving employees may be more capable of shaping their judgement in the context of the firm specifics. A counter-argument to this is that they may be biased towards what they cannot see outside the norm for the firm. So, whilst they may be better at estimating central outcomes, their estimates of variability at the extremes may be suppressed by their relatively limited exposure to different environments.
-
∙ Previous positions and years of other relevant experience – too narrow an experience may be detrimental.
-
∙ Degree of insight into the specific subject.
-
∙ Conflicts of interests – these should be declared and mitigated to the extent possible. Where an appropriate level of mitigation is not possible, the facilitator should consider the extent to which any judgement provided is likely to be subject to bias.
If a group’s judgement is sought such as that of a risk committee, then it is necessary to consider the group characteristics in addition to the merits of each individual member:
-
∙ Make-up of the members – having representatives from various teams can help to ensure there are sufficient challenges of individual views and that a wide spectrum of views can be considered.
-
∙ Number of members – the size of the group will depend on the context and materiality of the decisions, but the potential for small sample bias should be considered. Equally, too large a group may also present issues and the group discussion may become unwieldy.
-
∙ Reporting structure of the individual members and the whole group to other committees – this should be reviewed to ensure there is no undue influence from senior figures on those less senior.
-
∙ Accountability – i.e. who ultimately signs off on the decisions made and hence who is held accountable for them. It may be that the chairman has the ultimate sign off or each member of the group is held equally accountable.
In addition to identifying individual or group of experts within firms, experts may be hired from external sources, for example consultants or academics. External experts should be vetted in a similar manner as above, but firms should also consider the following:
-
∙ Remuneration details – undue influence from remuneration packages or consultancy fees may cause external experts to provide a biased judgement that favours the firm.
-
∙ Capacity and scope of the expert working for the firm and who they are reporting to at the firm.
After establishing the expert judgement policy and identifying both the judgements that are needed and the expert(s) to be consulted, we can then focus our attention on the actual process that could be used to elicit the expert judgement. This is explained in more detail in section 5. We will discuss the steps that could be taken to manage bias and outline potential methods that could be applied in order to validate the elicited judgement. We will then suggest some areas to be considered when documenting and using the expert judgement within the firm.
5. How the Elicitation is Carried Out
We now present an outline of a framework for eliciting expert judgement. Preparation is important for a successful discussion. The discussion needs management of cognitive bias. Validation of judgement against other assumptions is useful, as is documentation afterwards.
Two case studies then follow in sections 6 and 7.
5.1. Preparation
Before speaking to the experts, some planning can help to facilitate what is to be discussed. The preparation stage should consider the questions to be asked and whether the approach is likely to introduce particular bias or heuristics which could materially impact the quality of the end result. We share ways of doing this within the examples discussed in sections 6 and 7 of this paper.
A critical aspect of this phase, which is often overlooked, is the collection of data that is relevant to the problem and the mental discarding of any irrelevant information. Relevant data may be available internally but may require representation of the specific assumption to be discussed and will also often require supplements from external sources such as market statistics, newspaper articles or publications of relevant expert panels.
5.2. Elicitation Discussion
Here we consider processes for individual elicitation. To manage the meeting with the experts, some consideration needs to be applied to the specific personalities involved and how they may best arrive at robust judgements. The process of group elicitation will be tackled separately in section 8.
5.2.1. Bias management
The facilitator should guide the discussion in a way to manage any obvious bias, for example:
-
∙ Framing – consider how the questions are asked. In particular, consider using
-
o clear and unambiguous questions;
-
o a series of questions with care in the sequencing of questions; and
-
o neutral language.
-
-
∙ Substitution bias – is there a risk that an easier question may be answered by the expert instead, if so how could the question be re-phrased to avoid this? Would it be better to ask the easier question and build up progressively to the more complex question?
-
∙ Availability bias – having an awareness of how recent events, experiences or commercial factors may influence the results and the extent to which this may or may not be appropriate.
-
∙ Anchoring – consider whether and how anchoring should be introduced and managed.
-
∙ Is there a desire to anchor on a particular data point or previous judgement?
-
∙ Is there a desire to move away from a potential anchor point that the expert may have explicitly available?
-
∙ Consideration of which anchors are presented in the data and which will arise as part of the discussion.
-
∙ Encourage thinking “slow”, rather than following “gut feel”; for example, by
-
o discussing the possible trends present in the past data;
-
o discussing changes since then;
-
o asking for rationale on an ongoing basis to ensure some examination of the expert’s responses; and
-
o presenting the expert with the opportunity to refine their response.
-
An expert will not function as an expert if the questions asked are inappropriate or invite a knee-jerk response. In this sense, the facilitator should try to frame the elicitation in the context of the expert’s experience. For example, an underwriter should know the class of business they manage, policies written and history of significant events in great detail, but not necessarily be an expert in statistics or assessment of tail return periods. In this sense, we should try and ask questions the underwriter can answer with confidence rather than complex probabilistic questions that cannot be well answered by someone who is not familiar with actuarial terminology.
The existence of rationale is of critical importance in understanding the expert’s thought process, allowing for peer review and may even provide a sensible approach for future updating. An example below demonstrates this point.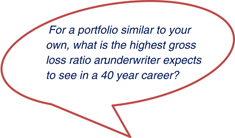
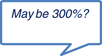
It is difficult to know whether this result is in any way reliable, it is very hard to challenge or update in a sensible way. Next year the same question could give an answer of 200% or 2,000% and it would be hard to know how to deal with the information.
Now consider a different answer, albeit with the same quantitative response.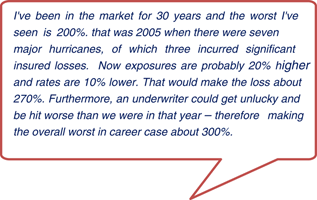
This rationale outlines a logical process, which limits some biases such as anchoring, and provides a reasonable starting point for adjusting the estimate next year, based on next year’s rates, etc.
If the next year, the response is different we could consider what has caused this in a more scientific manner; for example, it may the result of rate or exposure changes, or due to a new event which has changed the risk landscape.
5.2.2. Validation
It can be difficult to validate the accuracy of the expert judgement and even harder to validate that biases have been minimised. The Expert Judgement paper (Ashcroft et al., Reference Ashcroft, Austin, Scolley and Makin2015) highlighted some useful validation tools to validate the accuracy of judgements. Some of these tools and concepts (e.g. plausibility range) can be used for validating the biasedness, but they often require data which is difficult to collect for biases. For example, backtesting in situations where few events are available can lead to over-fitting. Therefore a range of other methods to validate the expert judgement will need to be employed. For example
-
∙ checking coherence of the judgement with other assumptions;
-
∙ testing whether the question has been identified and understood correctly; and
-
∙ assessing whether there is sufficient structural basis to the expert judgement or a robust process used to derive the value of the assumption.
The rest of this paper details the validation of biases rather than accuracy of the expert judgement.
5.2.3. Documentation and use of expert judgement within a firm
The write-up and use of results after the meeting is also very important to the elicitation process. Some suggested areas for consideration are as follows:
-
∙ Documentation needs to be in line with the expert judgement policy and the regulator’s expectation where relevant.
-
∙ The process for updating the expert judgement should be outlined.
-
∙ The process for conducting backtesting and identification of appropriate triggers for the revision of expert judgements should be documented. Whilst some forms of validation can take place during the elicitation process itself, a longer-term feedback loop is an essential part of revising judgements each cycle.
-
∙ Communication of the impact the judgement has on the results, both to the expert and any wider group. We do not necessarily have to explain the detail of every judgement if the process carried out follows a clear policy and peer-review process. For example, the board should know if there is a big difference to results if we pick a Pareto or a lognormal distribution, and that there is some sensible rationale behind which distribution has been chosen. However, they do not need to understand the subtleties of minimum least squares fitting or the method of moments.
In the following sections of this paper we explore some practical ways that expert judgement could be improved and applying elements of the framework discussed above on some typically asked questions.
6. Estimating Low Frequency and High Severity Events
An example of using expert judgement where data is sparse is the calibration of extreme values for a low frequency and high severity event. Judgements are often sought from underwriters, claims or risk managers, with actuaries involved in the elicitation process.
In order to explore the potential biases that can arise as part of this process we focus on a very common, albeit naive question:
“What do you expect your 1-in-200 loss to be?”
6.1. Potential for Bias
This question is often used in capital modelling to derive appropriate assumptions for large losses or natural catastrophe risk despite having some obvious (and some less obvious) biases:
-
∙ The language used in the question may introduce bias. It is unclear what exactly is meant by “loss” in this context. This is a critical point, because several different interpretations could arise:
-
o attritional, catastrophe or large loss;
-
o next year’s or ultimate loss;
-
o single or multiple loss (i.e. the occurrence exceedance probability or the aggregate exceedance probability);
-
o gross or net of reinsurance loss; and
-
o real or nominal value.
The expert may apply their own interpretation of loss without making this explicit. The question therefore needs more consideration and refinement on what is meant by the term.
-
-
∙ The word “expect” implies expectations which has a technical meaning in this context and may not be well understood. Loss distributions are typically positively skewed and so an estimate of the mode is likely to be lower than the mean. The expert may substitute their own interpretation if this is not clear.
-
∙ The “1-in-200” return period is ambiguous – is this last 200 years, next 200 years or 200 realisations of the next future year? For most cases it is intended to be the last of these options but this is not the most intuitive interpretation for non-actuarial practitioners. It is also a trickier concept to visualise and so the expert may answer an easier question which would likely be the last 200 years.
-
∙ The question gives no positive anchoring via the context of previous loss levels, it is more likely that the expert will be influenced by the more recent or extreme events as these are more easily recalled. It is also very vague, which means the event will seem less likely than a more clearly described event.
-
∙ “Your” makes the loss personal to the expert and therefore may encourage protectiveness, self-responsibility and even under or overconfidence. Therefore judgements may be more likely to be based on the inappropriately small sample represented by the underwriter’s personal experience.
-
∙ If asked to estimate this figure with no context or structure the expert may err on the low side if the tail risk has implications for their class of business – such as cost of capital loadings.
6.2. Towards High-Quality Expert Judgement
In the context of capital modelling, it is understandable that we are drawn towards asking for a 1 in 200 since this is the main regulatory focus, but this is perhaps placing unrealistic demands on the expert. After all, there is only a 0.5% difference in the probability of a 1-in-200 and a 1-in-100 loss. Few people are able to discern this difference when imagining scenarios and you are unlikely to get a robust estimate. Asking a series of more accessible, easier questions and presenting relevant data may significantly reduce the effect of bias on the outcome. It is also worth remembering that the tails of an aggregated distribution are made up of the main body of the underlying individual loss-type distributions. If we focus on the typically more easily parameterised and more central components, the problems associated with estimating tail values will potentially reduce. For example, it may be more reasonable to ask for a lower percentile; e.g., 1 in 40 (i.e. once in a working life). This in turn will supplement the already available data sets to parameterise the main body of the distribution. The fitting of the tail can then follow using an underlying distributional assumption. A further advantage of asking for a lower percentile is that there may be some data available for validation. For example, with 20 years of market experience we might expect a 1 in 40 to be higher than the observed maximum, although not very much so; however, a 1 in 200 is much harder to validate with existing data.
6.2.1. Carrying out the process
It is already highlighted in section 5 that setting a good framework for eliciting expert judgement can reduce the impact of bias on the estimation process for low frequency and high severity events.
6.2.1.1. Prepare context and data
The process could begin with a preparation of data which is going to be presented; for example, the level of historical losses for each year that is available. Where appropriate this should be adjusted for known trends such as inflation. The context of the expert’s experience should also be considered. How many years’ experience does the expert have in the market? This may provide a cut-off point beyond which the judgements would become less credible.
6.2.1.2. Discussion
The high-level information could then be used to inform specific discussion on claim frequency and severity. This should combine information about the expert’s past experience and the composition of the book. For example, discussing historical large loss events and how the effect of these may change under the current risk environment and exposed policies.
The discussion of frequency and severity may be biased towards existing and recent events. In order to maintain the focus on the extreme losses that are the focus of the exercise, we propose that the next stage explicitly explore the potential for larger than historical events and probable maximum losses given the exposure. Framing the discussion in terms of a market loss can make the question seem less personal to the expert and so is likely to generate a less biased result. Now instead of the 1-in-200 loss which may be experienced on their specific book of business, where the underwriter take a protective stance and consider there are proper mitigants in play to prevent specific losses of this nature arising, the angle taken is more that an unusual set of circumstances will give rise to a market loss of this nature and such circumstances will in most circumstances be outside the scope of current underwriting/pricing practices. Using specific questions on exposure concentrations is also more likely to yield a less biased result than asking vague questions which take additional cognitive power to visualise.
6.2.1.3. Validation
The final stage should cover the results implied by the judgements already made. It should combine frequency, severity and probable maximum loss estimates and compare the implied levels of these to the losses experienced historically. Furthermore, the assumed loss distributions should be run through the reinsurance programme to confirm that the programme is operating as intended. Any unexpected results – such as unusually high reinsurance recoveries – should be explored by further investigations and discussions using the above framework.
7. Estimating Dependency
Determining the dependencies between perils, risk types or lines of business can be some of the most material assumptions in capital modelling. Typically, it will require the determination of the dependency structure and the dependency parameters. Decisions are typically based on expert judgement because of the scarcity of data and sometimes unintuitive statistics associated with dependencies. Similar to the case study in the previous section, expert judgements are likely to be sought from a number of different participants, including actuaries and underwriters.
In this case study, we only focus on the estimation of the parameters for the dependency and consider the potential for bias in this judgement process to be introduced and ways to mitigate against this bias.
7.1. Methods and Associated Biases
7.1.1. Matrix and risk driver approaches
A very widespread process for eliciting judgements of dependency parameters relies on estimation of correlation as part of a correlation matrix, with each pair of class considered one at a time. In order to avoid spurious accuracy particular correlation parameters (e.g. 0, 0.1, 0.3, 0.5) are assigned to select broad categories of correlation (e.g. nil, low, medium or high). Justifications of these selections usually involve subjective narratives such as
“Classes A and B are highly correlated due to them both being casualty classes with similar exposures in the same jurisdictions”;
or
“Classes C and D are not highly correlated as one is property-damage related and the other liability related and they are from different jurisdictions”.
These judgements are usually codified, applied systematically and documented.
Another common approach is to consider the drivers of losses. There are a few variations to the theme. It is likely to involve a list of potential drivers and the experts for each risk type asked how strong the impact of each driver would be to their risk. Two-dimensional answers could be sought: the likelihood of impact and the severity of impact if the event occurs.
The “reverse drivers” approach asks the experts to provide probabilities of the action of drivers, conditional on there being an extreme situation for their class of business.
Interested readers could consult Kerley & Margetts (Reference Kerley and Margetts2006) for a comparison between the two approaches, Antal (Reference Antal2014) for a more recent report on implementing the driver approach and Arberz & Canestraro (Reference Arberz and Canestraro2012) for an illustration of the reverse drivers approach.
7.1.2. Potential for bias
A number of cognitive heuristics and biases can influence each of the processes described above. Here we focus on availability, anchoring and framing issues, all of which have particular relevance to the elicitation of correlations.
7.1.2.1. Availability
Availability bias simplifies a complex problem by referencing examples that are easily recalled. For example, a high dependency between directors and officers and a professional indemnity class of business may be readily accepted given the experience over the years of the financial crisis but potential links, which have not been manifest in recent years, between other classes may not be considered. The pertinence of this bias lies in the fact that data to support parameter estimation is usually lacking.
7.1.2.2. Anchoring
It is possible to find both technical as well as cross-class anchoring for dependency parameter estimation. Technical anchoring is specific to how bounded figures (e.g. from 0 to 1) are elicited. The anchors of 0 (e.g. independence) and 1 (i.e. no diversification) can mean that experts adjust too little away from these initial anchors. There is also evidence that experts tend to have biases downwards when considering conjunctions (e.g. probabilities of events happening at the same time), since the anchor typically assumes independence, with upwards adjustments for positive associations that tend to be too small.
Technically, anchors can also exist for joint probability/conditional probability methods. The presence of the reference percentiles (e.g. asking for the probability of X being greater than the 90th percentile, conditional on Y being greater than the 90th percentile, could anchor – cognitively speaking – the respondent onto the number 90).
Cross-class anchors of specific values also exist from previous model parameters, industry benchmarks or other references (e.g. the correlation coefficients in the Solvency II standard formula) that could make estimations too close to these benchmarks. Updating a value from last year’s result is a particular case of this issue, especially where there is a reluctance to change assumptions.
7.1.2.3. Framing of questions
The way a question is asked can have a significant impact on the answers given. For example, the following questions would likely lead to very different estimates of conditional probabilities:
-
∙ Conditional on class A being worse than the 99th percentile in a particular year, what is the probability that your class of business would also be worse than 99th percentile?
-
∙ Conditional on class A being worse than the 99th percentile in a particular year, what is the probability that your class of business would be better than the 99th percentile?
This example shows two different ways of looking at the problem. The first method assumes that risks are independent, and then find drivers and other rationale to allow for positive associations. The second method assumes risks are fully dependent, and then find reasons to allow for diversification benefits.
The tendency in industry seems to rest with the first method. This view would correspond with different teams within firms writing different classes of business, and lines being independently managed with few common or market-wide drivers between lines. Whilst this is likely to be the case at the centre of the loss distributions, it may be a less good description for the tails which may experience heavier degrees of correlation. The difficulty in the second method is that the starting scenario from which one adjusts down could be based on drivers whose importance may be considered to be too grossly overstated. These drivers may also be less familiar to the expert and hence may put the expert at significant unease.
A number of other cognitive biases could also affect the judgements elicited. A process should be established that mitigates (or at least recognises) the impact of these as far as possible.
7.2. Towards High-Quality Expert Judgement
There are several broad approaches to dependency parameter elicitation currently adopted in the market. The best approach will depend on the specific problem, but including a consideration of the potential for cognitive biases to distort judgements should serve as an improvement.
As with the example of estimating low frequency high severity events discussed in section 6, biases can be reduced by understanding their effects in order to create a process that is less open to their influence. An outline of this process is summarised in the points below.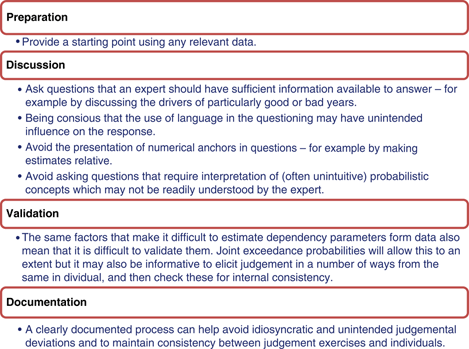
Dependency modelling places demands on the technical, communication and subject knowledge of the modeller in order that they elicit the appropriate judgement from the expert. The elicitation session might well require contrarian approaches, for example, when the subject experts rule out drivers, the facilitator might ask for opinions about black or grey swan scenarios.
Whilst it can be hard to eliminate anchors completely, the actuary should be aware of the impact of preceding a question with a series of particular large or small numbers since we might expect these to impact the result. The challenge here is to come up with questions following both methods that appear natural, so as to obtain a more balanced view when they are used together.
Any process should therefore be designed such that it reduces the cognitive demand on the expert to follow the technical detail and makes the most of their subject-matter expertise. Such a complex exercise will benefit from a well-designed and followed process coupled with validation or peer reviews.
8. Group Elicitation
The process of deriving an expert judgement involves the distillation of multiple and sometimes conflicting information sources into one point. This distillation can be done by a single individual or within a group scenario where “information wells” may exist within different group members. Different facets of information are extracted and then combined to form a single group view. This section investigates strengths and pitfalls of group elicitations. It makes suggestions for facilitating group elicitation sessions more effectively, before highlighting and briefly evaluating a structured process widely researched and used in management science.
8.1. Behavioural Traits and Personality
During the elicitation process, the expert is sometimes required to make judgement calls beyond their usual scope of duties. This increases cognitive demands on them and can place some personality types under considerable pressure. When under stress, individuals typically move into a personal space within which they feel most comfortable and react to the situation accordingly.
Take for example, making judgements on high return periods. Some individuals may be more likely to act on impulse and be creative in thinking up examples. Others may want to know the impact their answers will have first and then tailor them accordingly. Another set may try to avoid answering the question and engineer the discussion so that the facilitator ends up making the judgement themselves. Prior recognition of these behavioural traits can help to formulate better questioning approaches, select the appropriate format for meetings (i.e. face-to-face or roundtable discussions) and predict, and hence make allowances for, the level of biases introduced by the individuals.
There are a number of personality profiling tools available – such as DiSC, Myers-Briggs or Belbin – that can help the facilitator to gain prior insight into personality types. Often, however, the personality tendencies of the interviewed person are unknowns at the point of elicitation. Whilst there is likely to be some revelation of tendencies during the elicitation process itself, it will be challenging for the facilitator to tweak the interview in a dynamic fashion in order to get the best answer out of the individual involved. However, we can ensure that participants get all the relevant information they need to make the judgement so that they can focus on the judgement itself and reduce demands on other cognitive processes.
8.2. Group Think
No discussion on group elicitation could be complete without a discussion on group think. The psychologist Irving first coined this term in 1972 (Irving, Reference Irving1972). A tendency towards group think is detrimental in a group elicitation exercise and will stop the proper challenge of views. Instead views will tend to converge to the most powerful person in the room and the group discussion becomes a charade.
There has been much subsequent research conducted into this phenomenon and this has identified possible antecedent indicators that mean that group think is more likely to occur. These include
-
∙ a high cohesiveness of the group – for example, a group where membership has been stable over a considerable period of time and where individuals have a high degree of familiarity with each other;
-
∙ insulation of the group to alternative ideas – particularly where the group is shielded from new perspectives and approaches;
-
∙ lack of methodical procedures for searches and appraisal of searches – where the full gamut of options are unlikely to be explored in a consistent fashion; and
-
∙ directive leadership which tends to influence the end outcome before the discussion.
The symptoms of group think include
-
∙ collective rationalisation behind a view or judgement with little challenge;
-
∙ belief in the inherent morality of the group and its ability to form judgements;
-
∙ direct pressure being put on dissenters to conform, rather than express their alternative point of view;
-
∙ illusion of unanimity, when differences are portrayed as immaterial or not discussed; and
-
∙ self-appointed mind guards when different views are aired either within individuals or between individuals that prematurely close down other avenues of enquiry before appropriate discussion can take place.
To the extent that these conditions exist in a group discussion, the quality of any expert judgement produced is significantly compromised. Methods to open up the group must be found, which may include dissolution of the existing group so that new dynamics can emerge or the removal of any particular authoritarian influences. Interestingly, the latter method may result in a substantial increase in the robustness of the expert judgement even when the authoritarian influence has a material amount of information not available or accessible to the rest of the group.
8.3. Successful Group Elicitation
8.3.1. Structuring activities
Both group and individual elicitation exercises play a key role in the formation of most expert judgements in actuarial work today. An outline for the process for group elicitation is provided below.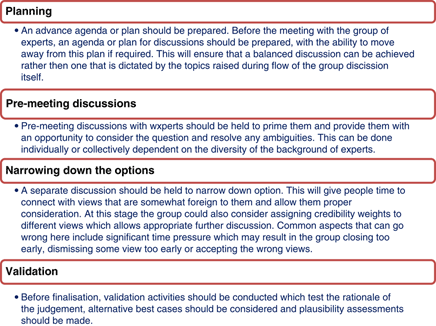
8.3.2. Implementing group elicitation
The chairperson or facilitator’s role during the elicitation meeting can be crucial in ensuring positive group dynamics, which lead to an unbiased discussion. For example, the chairperson will need to ensure that
-
∙ the question is framed appropriately, by ensuring that
-
o all ambiguities have been removed;
-
o all parties have a consistent understanding of the question; and
-
o that the question has been carefully worded to avoid deliberate bias.
-
-
∙ the right question is being asked – both in detail and as a lens to focus the group’s attention;
-
∙ the impact of dominant individuals is suitably addressed. Where this is of particular concern, views can be elicited in isolation and replayed to the group anonymously for subsequent discussion;
-
∙ there is proper critical challenge to ensure that collective and institutional blind spots are investigated; and
-
∙ all relevant views receive an appropriate amount of time for discussion.
Some consideration also needs to be given as to how the different views should be amalgamated. In particular the treatment of significant minorities, for example, instances where 65% may believe option A, whilst 35% may believe option B. Here a blend approach may result in an inferior outcome and a scenario in which no one believes. Other aspects that can go wrong in the amalgamation process include prior selection of views where evidence is back fitted or where decisions are being influenced unduly as a result of anchoring to past views. This consequently will lead to inferior outcomes.
Longer-term solutions to address areas of potential bias in group discussions include educating experts, considering a broad range of techniques to amalgamate quantitative and qualitative data, and adding more in-built reflection, challenge and validation time into the expert judgement formation process.
8.3.3. The Delphi method
The Delphi method was developed by the RAND Corporation in the 1950s and 1960s to bring together experts in a panel to grapple with specific planning and social forecasting problems. Since then, this structured group process has been reportedly widely used in public and private spheres.
At its heart, the method attempts to avoid the aforementioned issues such as group think or dominant individuals. There are variations to its implementation, with the following main phases, simplified from page 312 of Goodwin & Wright (Reference Goodwin and Wright2009):
-
1. Individual panellists provide opinions about the likelihood of future events, or when those events will occur or what the impact of such event(s) will be.
-
2. The results of this polling of panellists are then tallied, and statistical feedback of the whole panel’s opinions is provided to individual panellists. Next a repolling of individual opinions takes place. At this stage, anonymous discussion may occur so that dissenting opinion is aired.
-
3. The process of obtaining individual judgements and feeding back statistical information on what the panel as a whole is thinking continues over a number of rounds until either a consensus emerges or the panellists are no longer changing their opinions.
-
4. The output of the Delphi technique is a quantified group “consensus”, which is usually expressed as the median response of the group of panellists.
We have yet to come across publications on its use in the management of insurance companies. One may conjecture that the method would require significant tailoring for actuarial work in the insurance context. For example, the traditional peer-review process envisions a process with just two independent actuarial experts. The anonymity process in the Delphi technique to tackle group issues is clearly meaningless in such a context. The luxury of having many independent actuarial experts working on particular problems is unlikely affordable to most insurers. However, one might see potentials for it in areas such as emerging risk research, which may need a much wider range of expertise.
The technique is the subject of research of many management scientists, and actuarial researchers would do well listening in. The suggestions we make in this paper may not be sufficient for the most material judgements, which could require more structured processes. As well as Goodwin & Wright (Reference Goodwin and Wright2009) above, the interested reader could also further reference page 261 ff. of Bell (Reference Bell1997) and Rowe & Wright (Reference Rowe and Wright2001).
9. Blending Data and Judgement
Up to this stage of this paper we have covered the cognitive biases that are involved in actuarial expert judgement, together with the tools that may be used to identify these biases and to reduce them.
Expert judgement is not always used in isolation. Typically, expert judgement can be blended with the usually limited data to determine an appropriate blended estimate. Current practice seems to indicate that blending between judgement and data is carried out by means of actuarial judgement which will, of course, also be subjective, biased and subject to similar pitfalls associated with expert judgement as described in section 3.
Blending between soft information (i.e. judgement) and data is a common issue across a diversity of fields. Let us consider another, seemingly unrelated, situation of a judge who is in the process of reconstructing a crime scene and eventually providing the “guilty” or “not guilty” verdict.
For the sake of the argument, evidence on a crime scene may be divided into two main categories:
-
∙ Testimonial evidence – consisting of statements from the witness(es), the suspect(s) and potentially from the victim(s). Similar to the expert judgement collected in an actuarial context, testimonial evidence is subjective in nature and can therefore be biased, fabricated, etc., and subject to all of the previously mentioned cognitive biases.
-
∙ Physical evidence – which can be compared with the claim experience to date – consists of tangible articles such as fingerprints and other biological material.
As one might expect, it is highly unlikely that the testimonial or the physical evidence available will – on their own – recreate the crime scene completely and fully establish the sequence of events. Testimonial evidence is therefore used to “fill the gaps” found in the physical evidence (and vice versa). Similarly, actuaries will use their own judgement, or the judgement obtained from other experts, to complement the typically limited claim experience.
In this context, the judge will be pondering on at least two fundamental questions:
-
∙ How much should I trust the testimonials?; and
-
∙ How much should I rely upon the physical evidence?
Elaborating slightly further on this analogy, we realise that the corresponding two questions to be answered by the actuary are indeed quite similar in nature:
-
∙ How much weight should be placed on the elicited expert judgement?; and
-
∙ How much weight should be placed on the experience to date?
Initially, these two questions appear to be quite difficult to answer. So, let us start by making some simplifications.
First, we note the duality of the problem: it is a question of judgement against data. So if we are able to determine how much weight to place on the experience to date, hereby denoted by Z, where 0≤Z≤1, then the remaining weight of (1−Z) must be attributed to the expert judgement.
So in reality, we must answer just one question rather than two:
“How much weight should be placed on the experience to date?”
This is still not an easy question to answer; however, Bayesian statistics gives us a well-established theoretical foundation for doing so.
The remainder of this section has two aims. It will be a reminder for us on Bayesian credibility: outlining the method and highlighting its key strengths and weaknesses. We shall introduce the topic through a reserving example. Second, it shall also report on the results from an empirical experiment. The results will suggest actuaries are not necessarily good at blending in experience in their heads, when benchmarked against Bayesian credibility. Training on cognitive heuristics seems to improve performance.
9.1. Reserving
The question of how much weight to place on the experience to date is of particular relevance in the Bornhuetter–Ferguson (BF) method. This method is essentially an amalgamation of the chain ladder and the expected loss ratio (LR) method. In the chain ladder technique, we multiply actual claims by a cumulative claim development factor (CDF). This technique can, however, lead to unreliable projections when the CDF is large because a relatively small swing in the incurred claims, or the reporting of an unusually large claim, could result in a very large jump in the projected ultimate figure.
On the other hand, the expected LR method offers the advantage of stability in the projected ultimate. However, the method completely ignores the actual claim experience.
The BF technique combines the two techniques by splitting ultimate claims into two components: actual incurred (or paid) claims and expected unreported (or unpaid) claims. As the experience matures, more weight is given to the actual claims and the expected claims become gradually less important.
Against this backdrop, the BF method may be viewed as a credibility-weighted method between the chain ladder method and the expected LR method. The basic formula for calculating the credibility-weighted projection (Brosius, Reference Brosius1993) is
 $${\rm BF}\,{\rm estimate \,{\equals}\, }\left[ {Z\,{\times}\,\left( {{\rm chain}\,{\rm ladder}\,{\rm method}} \right)} \right]{\rm {\plus} }\left[ {\left( {{\rm 1}-Z} \right)\,{\times}\,\left( {{\rm expected}\,{\rm LR}\,{\rm method}} \right)} \right]$$
where Z is the credibility weight assigned to the chain ladder method and (1−Z) the complement of credibility assigned to the expected LR method. The credibility weight Z satisfies 0≤Z≤1, if no downward development is present.
In the BF method, the credibility weight is equal to the percentage of claims developed at a particular stage of maturity, which is a function of the cumulative CDF, i.e. Z=1/CDF. Therefore, more weight is given to the expected claims method in less mature years, and more weight is given to the development method in more mature years of the experience period.
9.2. Other Examples
We are faced with similar scenarios in other actuarial settings: for example, consider the following scenario, typically faced in parameterisation of actuarial models:
-
∙ Based on expert judgement, the LR for large loss experience on a particular line of business is equal to 40%, with a coefficient of variation (CV) of 20%.
-
∙ We have only 3 years of claim experience, with LRs 80%, 20% and 11%.
How should we determine the best-estimate (BE) LR for the next underwriting year? Should we change our current estimate of 40% LR? Could we use a formula, similar to that used in the BF method in order to determine the blended estimate between the expert judgement and the LRs exhibited from the underlying data?
9.3. Bayesian Credibility
Bayesian statistics could be one method which will help us answer these questions, As such, we can view Bayesian techniques as structured approaches which may help us collect expert judgement and blend this with the available data. The Bayesian credibility formula – which shows a striking resemblance to the BF estimate formula – is formulated as follows:
 $${\rm Updated}\,\,{\rm estimate\,{\equals}}\,\left[ {Z{\times}{\rm data}} \right]{\rm \,{\plus}}\,\left[ {\left( {{\rm 1}-Z} \right)\,{\times}{\rm expert}\,\,{\rm judgement}} \right]$$
The credibility weight Z will depend on the
-
∙ Amount of data available; having more years of experience will assign a higher credibility weight being applied to the data.
-
∙ The volatility of the underlying data available; more volatile experience will lead to a lower credibility weight being applied to the data.
-
∙ The uncertainty underlying the expert’s judgement; more uncertainty in the judgement will lead to a higher credibility weight being applied to the data.
So, the natural question that one may ask is
“How does this compare with blending solely using actuarial judgement?”
9.4. An Empirical Experiment
In order to help us answer this question about the weight that should be attributed to the experience to date when blending judgement with data, we have carried out an empirical experiment where actuaries were asked to update the BE loss frequency for a particular line of business. The aim of this experiment was to look for evidence as to whether actuaries exhibit bias in their judgement compared with the Bayesian estimate. Participants were given
-
∙ Internal frequency data – each data point provided to the respondent represented the loss frequency in a particular year, sorted in increasing order. Some respondents were provided with 5 years of internal data, others were provided with 15 years. As an illustrative example, one response sheet have contained the following information: “Your internal frequency data showing the number of losses in the last 5 years on a particular line of business are shown below: 7, 9, 11, 13, 16. The data above has been sorted in increasing order”. The respondents were also provided with the mean and the CV of their internal data. In the example considered here, the mean and CV of the internal data provided would be 11.20 losses/year and 28%, respectively. The respondents were also told that the internal model assumption for the BE number of losses for this particular line of business is currently set to the mean of their internal data (i.e. 11.20 losses/year in the example considered).
-
∙ Expert judgement based on a survey of market experienceFootnote 1 of ten companies, each with 10 years of data. We have provided each respondent with the mean frequency estimate based on this external data as well as the 95% confidence interval. For example, one response sheet provided the following information: “After surveying market experience of ten individual companies (each with 10 years of data), an expert now provides you with a 95% range of possible calibrations of the best frequency: 8.72 (low), 10.28 (mid) and 12.66 (high)”.
Each respondent was then asked what BE frequency should be selected for this class of business given this new piece of market research. Each respondent was also made aware that
-
∙ there were no underlying incurred but not reported issues;
-
∙ the frequencies provided were appropriately inflated and exposure adjusted;
-
∙ past data can be treated as being a good guide to the future; and
-
∙ the companies surveyed by the expert were carefully chosen to reflect an appropriate comparison with the internal data set.
The internal frequency data and the market experience were generated using Poisson distributions (with same rate parameter) for each respondent.
For each respondent, we have assumed
-
a. a Gamma prior with shape α and rate β; and
-
b. a Poisson likelihood with a Poisson rate parameter θ.
The Gamma prior hyper-parameters α and β were derived based on the judgement provided by the expert. Since the Gamma distribution is said to be the conjugate prior of Poisson likelihood, then the posterior distribution will have a closed-form solution and the same distribution form as the prior. In this case, the posterior distribution will be a Gamma distribution with shape
 $\alpha {\plus} \mathop{\sum}\nolimits_{i\,{\equals}\,1}^n {x_{i} } $
and Gamma rate β+n, where x={x
i
} denotes the n element vector of internal data observations representing the number of losses in a particular year (i.e. either 5 or 15 data points).
We have then calculated the corresponding posterior meanFootnote 2 using
 $$E[\theta \mid {\bf x}]\,{\equals}\,{{\alpha {\plus}\mathop{\sum}\limits_{i\,{\equals}\,1}^n {x_{i} } } \over {\beta {\plus}n}}$$
and compared this figure to the BE frequency provided by the respondent in question. It can be easily shown by comparing (2) to (3) that the posterior mean can be expressed as a credibility-weighted average of the prior mean and the sample mean, where the credibility weight is given by
 $$Z\,{\equals}\,{n \over {\beta {\plus}n}}$$
This setup was designed to answer the following three questions:
-
1. Is the judgement from the audience Bayesian? (which is arguably a theoretically correct way to update judgements)
-
2. Is there any evidence of biases and heuristics in the respondent’s judgement?
-
3. Can training on biases and heuristics be used to improve the quality of judgement?
9.4.1. Data sets collected
We carried out this experiment twice on two different audiences. Both audiences were composed of actuarial practitioners. With the first audience (henceforth referred to as “the untrained respondents”), the aforementioned experiment was carried out at the start of the presentation. With the second audience (i.e. “the trained respondents”), the experiment was done immediately after receiving some training on biases and heuristics.
In both cases, each respondent provided their BE frequency estimate (to at most two decimal places) by considering their internal data as well as expert’s judgement based on market research. All respondents have also provided comments in which they have outlined the method they have used to arrive to their judgement. The two data sets collected are described below
-
∙ Untrained respondents’ data set – a total of 38 responses were received with 21 responses based on 5 internal data points and the remaining responses based on 15 internal data points.
-
∙ Trained respondents’ data set – we have collected 18 responses in total: 13 responses based on 5 data points and the remaining five responses based on 15 data points.
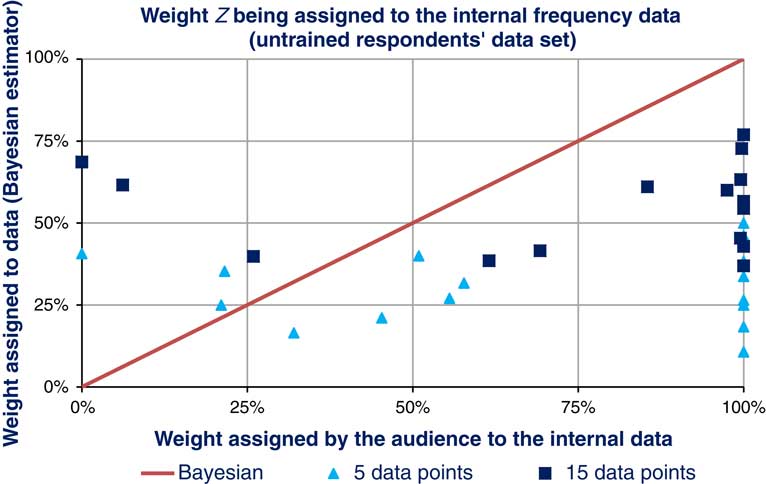
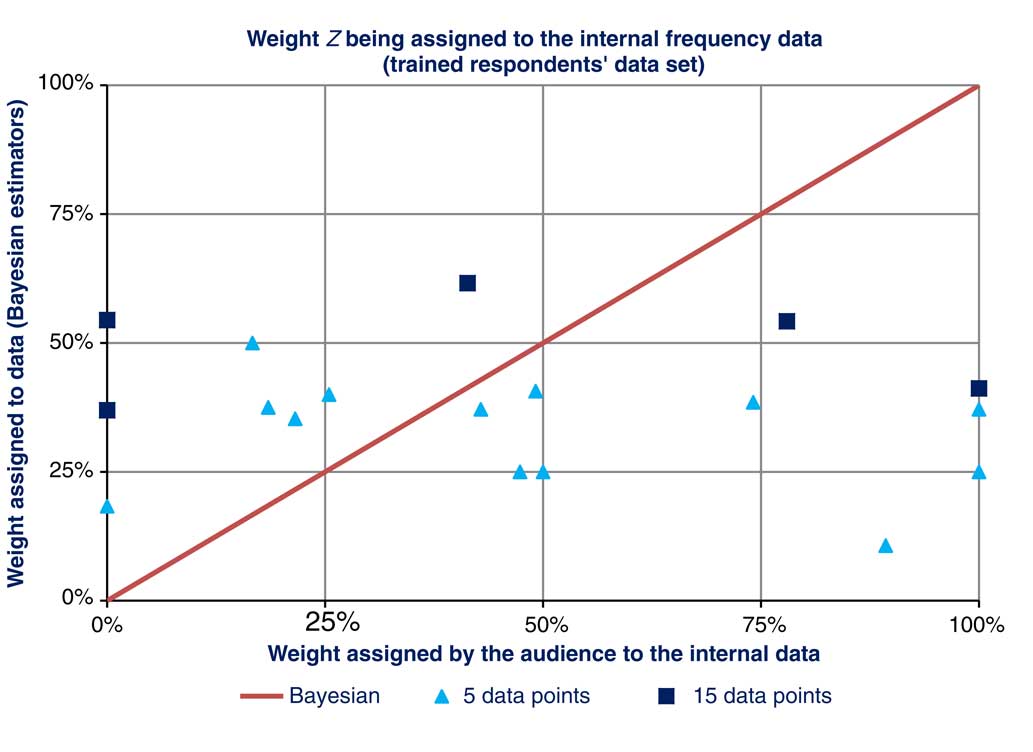
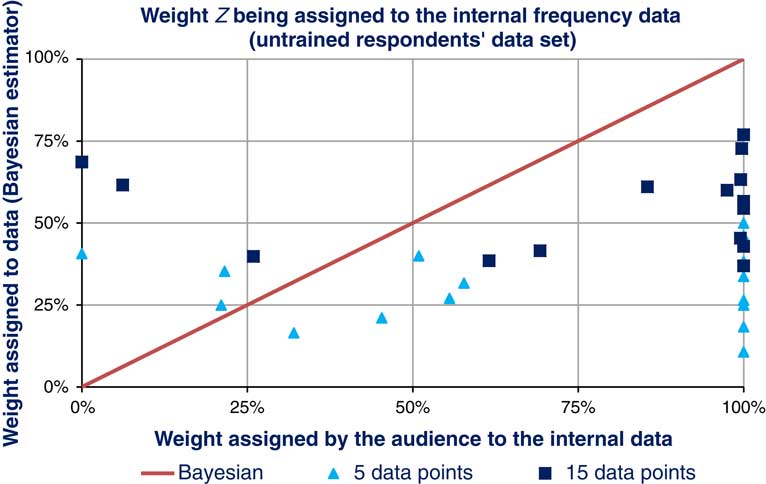
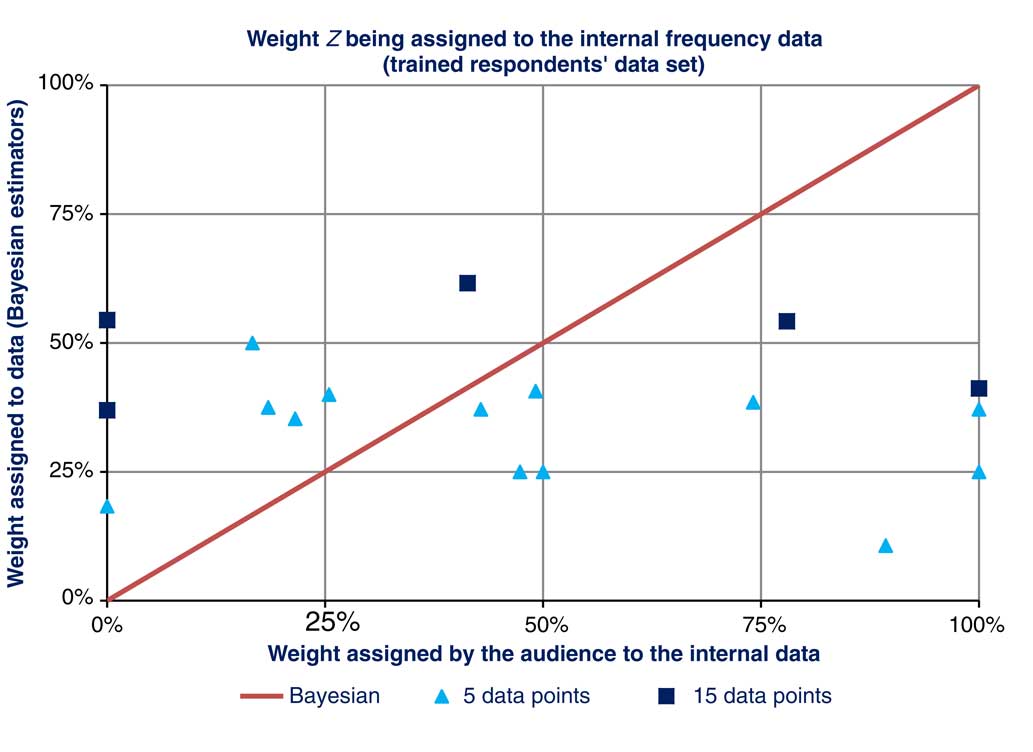
Figures 3 and 4 show the credibility weight Z being assigned to the internal frequency data (cf. equation (4)) and in the corresponding response provided by the audience, for each data set.
The untrained respondents’ data set – the weight being assigned to the internal frequency data in the Bayesian estimator (cf. equation (4)) as well as in the corresponding response provided by the audience. Responses represented by markers located on the right-hand side of the graph reflect responses that assigned a relatively high weight to the internal data
The trained respondents’ data set – weight being assigned to the internal frequency data in the Bayesian estimator as well as in the corresponding response provided by the audience
9.4.2. Is the judgement from the audience Bayesian?
We have carried out a hypothesis test to check whether there is a statistically significant difference between the Bayesian estimator and the judgement received from audience. The untrained respondents’ data set was used for this hypothesis test.
We find some evidence (p=0.028) against the hypothesis that the audience judgement is Bayesian.Footnote 3 Examining the data set in more detail, this statistically significant result is not surprising. In fact, we have observed that 61% of the responses had ignored completely the expert’s judgement. Justifications for this approach typically included remarks that the use of external data always needs strong justification over the internal data (and hence it is better to exclude the former data set). Other respondents used the expert’s judgement solely to validate their internal data, and often saw no reason to deviate from the mean frequency calculated from their internal data.
Only 24% of the respondents exploited some form of credibility weighting methods. The majority of these respondents made no attempt to derive appropriate credibility weights and simply adopted an “in-between” estimate.
There were ~5% of the responses collected which opted to give full weight to the expert’s judgement, arguing that such judgement was based on a much larger data set.
The other 11% of the responses collected adopted the mean frequency estimate from their internal data or from the expert’s judgement and then added an extra layer of prudence.
9.4.3. Is there any evidence of biases and heuristics in the respondent’s judgement?
The untrained respondents’ data set was used for this hypothesis test. This data set was split into two separate sets based on the number of years of experience: one set was therefore based on 5 internal data points and the second data set was based on 15 internal data points.
For each of the 38 responses, we have calculated the weight Z that each respondent has given the company’s internal data. Figure 3 shows a plot of these weights Z, excluding three respondents who have provided an estimate associated with a negative Z weight (in order to add an element of prudence).
We found no evidence (p=0.531) of a difference between the Z weight based on 5 data points and that based on 15 data points. In other words, the judgement received from the audience did not adjust for the level of credibility portrayed by the company’s internal data. This may also be an indication that the audience judgement was anchored to the company’s internal data.
9.4.4. Can training on biases and heuristics improve the quality of judgement?
For this test, we used the trained respondents’ data. The aim here is to investigate whether training can improve the quality of the responses; for example, by making them less susceptible to biases and heuristics that might have affected the untrained audience.
The weight Z that each trained respondent has given the company’s internal data is shown in Figure 4.
We again tested whether there is a statistically significant difference between the Bayesian estimator and the judgement received from the trained audience. In this case, we find no evidence (p=0.226) of a difference between the responses received from the trained audience and the corresponding Bayesian estimators.
This may suggest that training can reduce the effects of biases and heuristics.
9.5. Conclusion
Against this backdrop, our experiment shows that without any form of training, the judgement used by an actuary when updating the current model assumptions with new expert’s judgement would typically show marked deviations from the Bayesian estimate. More specifically, the responses collected showed that practitioners tend to place too much weight on their internal data and find it difficult to (a) blend their internal data with expert information; and (b) to adjust for the level of credibility exhibited by their internal data. We did however find evidence of an improvement in the quality of the responses provided by an audience who had received some immediate training on biases and heuristics.
In conclusion, the points below provide a non-exhaustive list of benefits of using Bayesian statistics in an actuarial setting:
-
∙ It is potentially more objective than current practice since the blending operation is carried out via a mathematical formula rather than using subjective actuarial judgement.
-
∙ It may facilitate the expert’s buy-in of the updated (i.e. the blended) estimate because of the objectivity of the blending operation, as described in the point above. The actuary can therefore explain to the expert the underlying reasons why the blended estimate is different from the expert’s judgement and provide reassurances that the differences are not the results of differing opinions – for example, between actuaries’ and underwriters’ opinions.
-
∙ It may help us to better comply with regulatory requirements regarding the use of expert judgement by virtue of having a more structured approach of dealing with judgement.
-
∙ The impact of the judgement(s) being made can be shown explicitly, which will be reflected by the specific choice of the prior distribution representing the expert’s judgement. Other methods usually involve making many implicit judgements along the way – and it may become quite difficult to track and evaluate the impact of so many judgements.
-
∙ In some scenarios, it could give closed-form results as in the form of the previously mentioned Bayesian credibility formula represented by equation (2), thereby facilitating its implementation in spreadsheet format.
-
∙ Still allows actuaries to exploit their actuarial judgement – the actuary can be one of the experts whose judgements are elicited and represented by a prior distribution.
The main downsides are that blended estimate may be over-reliant on the expert’s judgement in some scenarios – for example, when having very limited data – and that the result may perhaps appear to be overly precise in some contexts.
In our experiment, we have made use of the conjugate prior and so, our posterior distribution had a closed-form solution, thereby simplifying our analysis. However, we note that Bayesian methods will not always give closed-form results and consequently, Markov chain Monte Carlo simulations will sometimes be required. It is worth mentioning in this context that actuarial Bayesian models are however not expected to be very resource intensive and we believe actuaries are well trained to apply such techniques with confidence.
10. Conclusion and Further Work
This paper has highlighted and discussed the importance of expert judgement as an area for actuarial research. This is supported by the results of a survey, case studies and empirical experiments where we began to test our hypotheses on actuaries. Furthermore, there was keen interest expressed during our presentations at the GIRO, the LMAG and the IFoA Capital Modelling Seminar. Section 4 provided the hallmarks of high-quality expert judgement and crystallises the working party’s thinking on the topic and we hope that this will provide the stimulation for actuaries to give as much priority to the process of expert judgement formation and its elicitation as they currently do with the technical side of their work.
We recommend that further empirical studies should be carried out to explore specific questions on expert judgement. Examples of useful studies might be
-
∙ Should we ask for severities at a given return period or the return period of a severity?
-
∙ Is it better to elicit judgement from a group or ask all the individuals separately?
-
∙ Is there evidence for market-wide group think, resulting in systematic bias across the industry?
-
∙ Is there evidence that actuaries give different responses depending on the wording of a question?
-
∙ How often do underwriters change their initial judgement when shown the consequence – for example, the aggregate result at the 1 in 200 after eliciting frequency or severity distributions separately?
-
∙ What is the highest return period that an underwriter or actuary can predict within a certain degree of confidence or skill?
By exploring a series of case studies, we can build up an evidence base for the way specific questions should be asked.
Personality in expert judgement potentially gives a new topic for research and some may already be well developed in different areas of social sciences; for example, in criminology. However, this requires in-depth knowledge of a different type of science with which actuaries are typically not equipped, so cross-disciplinary research would need to be carried out.
Another useful area of research is how expert judgement in actuarial work impact decision making. Just as the expert judgement of a doctor in a diagnostic exercise would help the patient and their families make difficult decisions, the actuary’s work is now established as an important source of information for management of an insurance company or its portfolios. For example, different ways of communicating the reliance on expert judgement of various quality would likely result in different quality of decision making. Further research could usefully improve practitioner communication in this tricky area. Successful research in communication methods should also consider management of confidence in actuarial work, especially when actuaries are relying on judgements that could change drastically as new information emerge.
Not only actuarial work, but that performed by other professionals such as claims handlers and underwriters, would benefit from each others’ more explicit reflection on cognitive issues in expert judgements. We would therefore encourage sustained effort in judgemental research by these professionals and also through collaborations between us.
Acknowledgements
The authors would like to thank Michael Garner, Ajay Chhabra, Richard Barke, Clare Barley and Steven Fisher for the invaluable discussions and insight to this work. The authors also thank the participants of the survey and empirical experiments, which helped them to form opinions and reach interesting conclusions on the subject.
Disclaimer
The views expressed in this publication are those of invited contributors and not necessarily those of the Institute and Faculty of Actuaries. The Institute and Faculty of Actuaries do not endorse any of the views stated, nor any claims or representations made in this publication and accept no responsibility or liability to any person for loss or damage suffered as a consequence of their placing reliance upon any view, claim or representation made in this publication. The information and expressions of opinion contained in this publication are not intended to be a comprehensive study, nor to provide actuarial advice or advice of any nature and should not be treated as a substitute for specific advice concerning individual situations. On no account may any part of this publication be reproduced without the written permission of the Institute and Faculty of Actuaries.
Appendix: Survey Results
A total of 220 responses representing a broad spread of geographies and types of work were received. There were roughly even proportions representing the reserving, pricing and capital/risk areas. The geographical distribution of responses broadly reflects the spread of Institute and Faculty of Actuaries members worldwide with roughly 60% UK based and 40% non-UK.
When asked to rank the areas of importance to actuarial modelling, user understanding of data was considered to be the most important area with the ability to use data and unbiased judgements also considered key. There were 22% of respondents who have selected an area related to judgement as most important, motivating us that this is considered to be an issue by a significant portion of actuarial practitioners.
When asked about methods used to elicit judgements, some form of face-to-face discussion was most commonly used with less use of remote methods. There was little use of iterative tools or the involvement of experts in biases and judgements. This may suggest that more awareness in this area could help. Involving experts in this area, for example, can be common practice in other fields (e.g. sales forecasting).
Respondents indicated that they had encountered a good range of the different types of biases. The majority were aware of the existence of numeric biases, with fewer having observed more language-oriented biases or experienced framing issues. We believe the response reflects the natural tendency of actuaries to focus on the quantitative pieces of information when aiming to calibrate an assumption; and that language and framing biases are likely to exist in similar measure (but are less within the awareness of the statistically minded actuary).
When asked about key research topics and activities that actuarial practitioners would engage in to improve modelling outputs, there was a lot of appetite for developing and sharing practice and improving technical models. There seemed to be less appetite for assessment of quality of group judgement models and Bayesian techniques. Perhaps there is less awareness of these latter methods and they tend to be used less commonly.
In terms of what actuarial practitioners were planning themselves, many were planning on doing more reading on the subject and discussion within their firm and at conferences. A less popular suggestion was to engage in formal training or exams. This was perhaps surprising as it could be argued that the topic of expert judgement is only lightly covered in current exams and the training for actuaries.
Geographic spread of responses
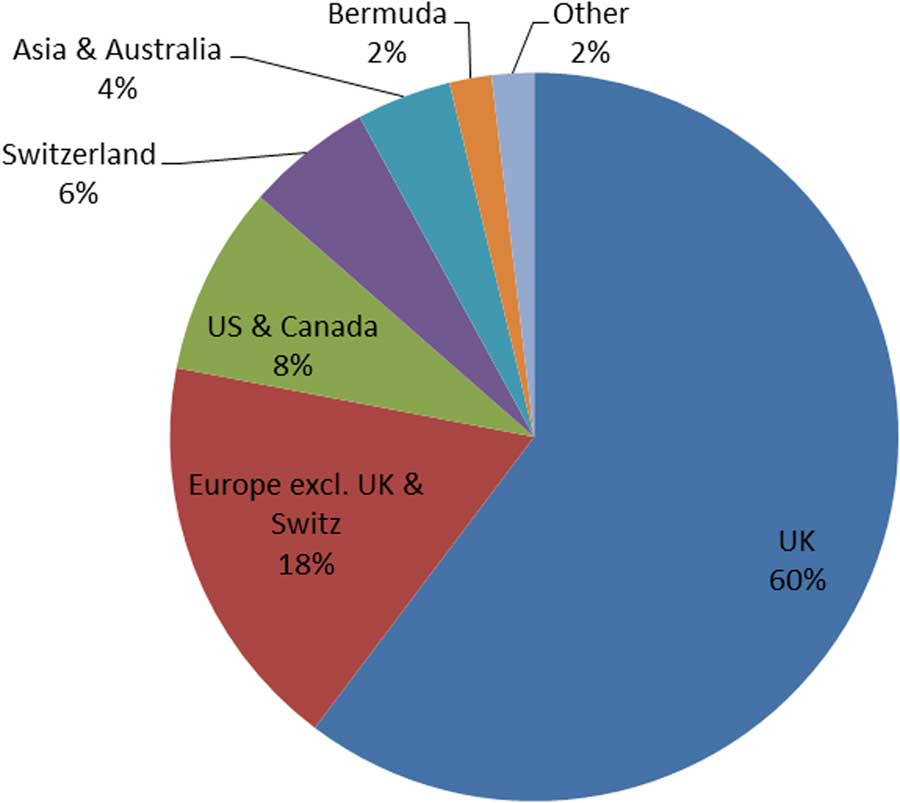
Areas ranked most important
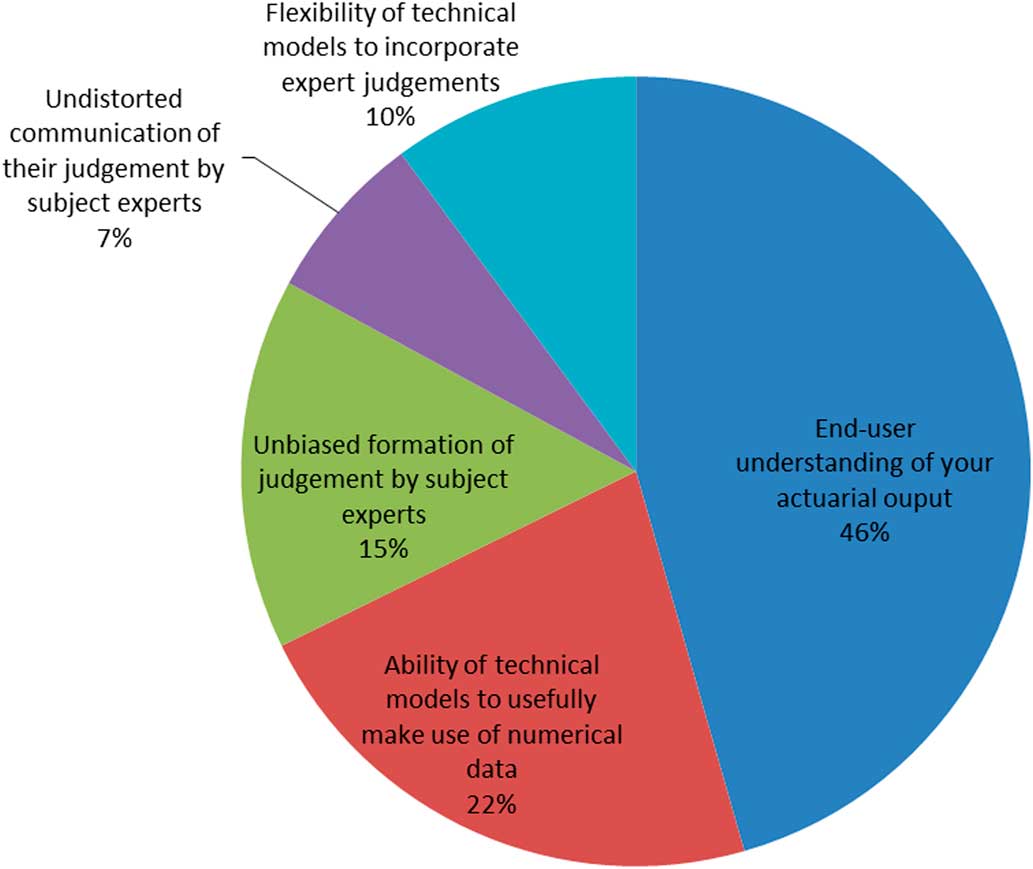
Methods used to elicit judgements
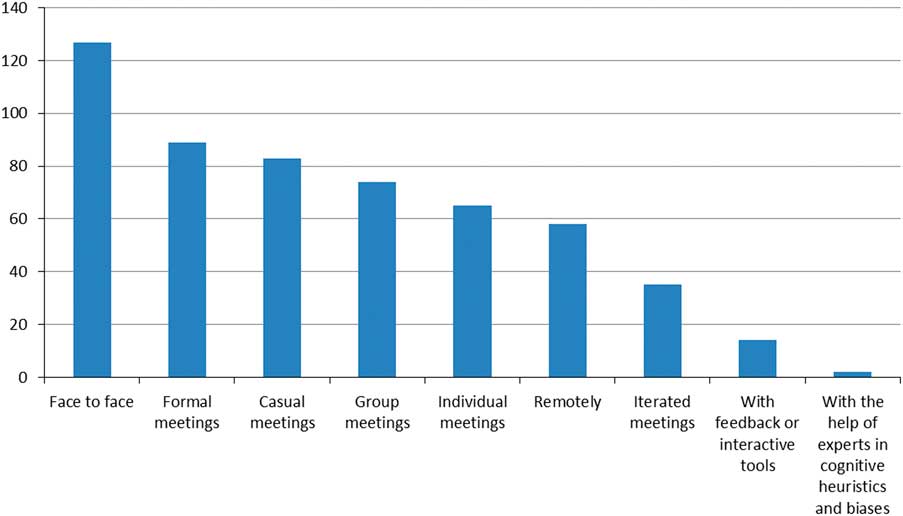
Relative experiences of different cognitive biases
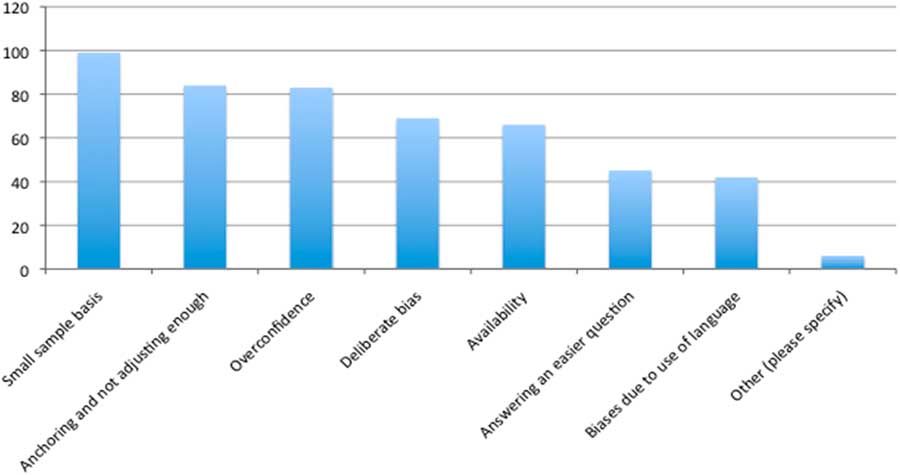
Most important research topics/activities for relevance to modelling work
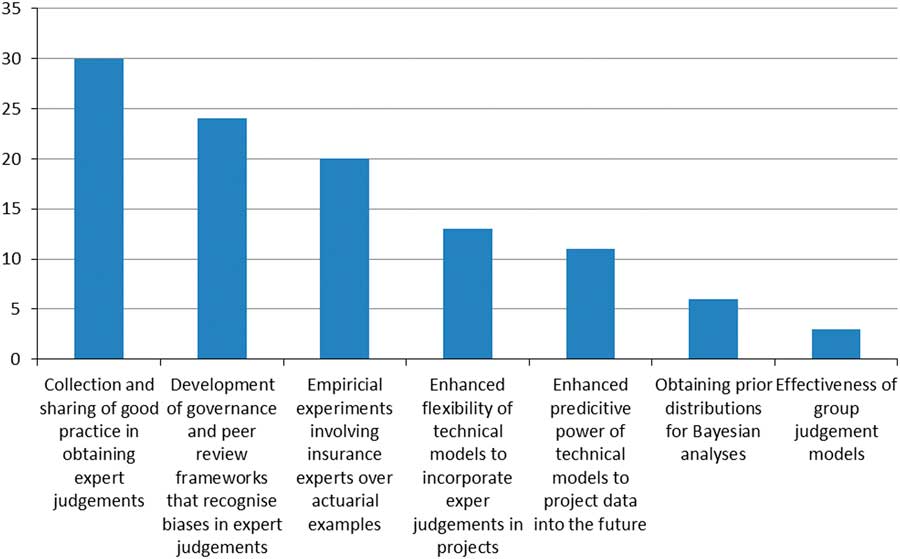
Numbers planning certain activities in the next 12 months to improve expert judgement