INTRODUCTION
The enzyme-linked immunosorbent assay (ELISA) has been widely used for many years to quantitatively determine concentrations of a variety of soluble proteins for serological diagnosis. It continues to be well-favoured and extensively employed due to its convenience to perform, particularly in multi-centre clinical studies, or in fieldwork and laboratories with only simple facilities. However, the results of this immunoassay are not sufficiently consistent when ELISAs are carried out at different times or by different people and on different multi-well plates. The ELISA reactions can be influenced by many factors, such as the affinity between reactants, activity of enzymes, and reaction duration of each step, as well as ambient temperature and humidity. These variations can be amplified because the ELISA protocol consists of multi-step sequential reactions, leading to complex reaction dynamics. For these reasons, many investigators do not consider ELISA as their first choice for protein quantification. Some investigators choose this assay, but ignore this problem and just analyse their experimental data by using original OD (optical density) values (Noor Azian et al. Reference Noor Azian, Hakim, Sumiati and Norhafizah2006).
Many attempts have been made to improve the description of the relationship between ELISA OD values and antibody protein concentrations. One representation of dose-response curves and model equations is the 4-parameter logistic-log model (4pLL). Many laboratories consider this model as one of the best (Plikaytis et al. Reference Plikaytis, Goldblatt, Frasch, Blondeau, Bybel, Giebink, Jonsdottir, Kayhty, Konradsen, Madore, Nahm, Schulman, Holder, Lezhava, Elie and Carlone2000; Wernette et al. Reference Wernette, Frasch, Madore, Carlone, Goldblatt, Plikaytis, Benjamin, Quataert, Hildreth, Sikkema, Kayhty, Jonsdottir and Nahm2003). Most of the methods being used are based on the availability of a standard reference for the protein to be quantified in the samples (Karpinski et al. Reference Karpinski, Hayward and Tryphonas1987; Plikaytis et al. Reference Plikaytis, Turner, Gheesling and Carlone1991). This limits the utility of their assay for quantitative analysis of proteins for which a corresponding standard reference is not available. The ratio of the OD value of the sample to a control serum was used to correct the variation between assay plates (Wu et al. Reference Wu, Dreger, Chow and Bowlby2002; Van Gool et al. Reference Van Gool, Vetter, Vervoort, Doenhoff, Wetsteyn and Overbosch2002). Our lab has also tried to calculate the ratio of the OD value of samples using 2 control sera (Wu et al. Reference Wu, Luo and Wu1995; Zhang et al. Reference Zhang, Wu, Chen, Hu, Xie, Qiu, Su, Cao, Wu, Zhang and Wu1997). However, the specific antibody concentration still could not be well determined.
To standardize the results of indirect-ELISA and improve their comparability on different plates, we propose a method that we call ‘Improved STandardization method for Optical Density’ (I-STOD). This method of standardization is derived from the reaction dynamics of the indirect-ELISA, and can transform the original OD values into the relative antibody concentrations in the test samples. By using an appropriate serum (even if the antibody concentration is unknown) as the reference on each multi-well plate to construct the I-STOD calibration curve, results on different plates can be standardized and compared. To evaluate the fitness of the I-STOD model to experimental data, we compared it with 5 other methods available for ELISA standardization to define protein concentration: (1) 3-parameter Langmuir-type (3pL) (Kortlandt et al. Reference Kortlandt, Endeman and Hoeke1987), (2) OD-C (concentration) (Vestergaard et al. Reference Vestergaard, Poulsen, Gronbaek, Larsen, Nielsen, Ejskjaer, Clausen, Thim and Nexo2002), (3) semi-log (Karpinski et al. Reference Karpinski, Hayward and Tryphonas1987), (4) log-log (Plikaytis et al. Reference Plikaytis, Turner, Gheesling and Carlone1991; Okuma et al. Reference Okuma, Saito, O'Connor, Phillips, De Kretser and Hedger2005), and (5) 4-parameter logistic-log (4pLL) (Plikaytis et al. Reference Plikaytis, Turner, Gheesling and Carlone1991), by the adjusted R 2 values of the calibration curves. Then, the CVs (coefficient of variation) of results between plates were assessed before and after implementation of the I-STOD standardization method.
Simultaneously, Shewhart charts (National GB/T4091-2001, China) were employed in our experiments for quality control. In 1950, Levey and Jennings for the first time introduced this control method (Levey and Jennings, Reference Levey and Jennings1950) and were followed by Henry and Segalove in 1952 (Henry and Segalove, Reference Henry and Segalove1952). Because the results of ELISA can be influenced by many factors and thereby vary widely, appropriate quality control is very important during the experiment, especially for the assays performed over several days or even months. By using these control charts, one can detect whether the results on the same or different plates were within the control range. If not, they need to be investigated and/or abandoned. The number of plates out of the control range was also used as a criterion to demonstrate the utility and effect of I-STOD standardization method. Finally, a cluster analysis was performed to evaluate the overall usefulness of these methods. We also provide a selection of field data and demonstrate its analysis using I-STOD model in Appendix III.
MATERIALS AND METHODS
I-STOD method establishment
We established a new equation, called I-STOD (Improved STandardization method for Optical Density) to standardize results of the indirect-ELISA by transforming the optical density (OD) values into relative antibody concentrations with respect to a standard reference serum pool (SR). The equation was derived according to the dynamics of the 3-step reactions involved in indirect-ELISA assay, which are: (1) reaction between immobilized antigen and suitable antibody, (2) reaction between bound antigen-antibody complex and an enzyme-labelled antibody and (3) catalysis by the enzyme-labelled antibody of substrate into a detectable product. Let C denote the concentration of the specific antibody to be detected in the serum, and OD the optical density value. We derive the following equation:  to describe the relationship between OD value and the detected antibody concentration. For every multi-well plate of the indirect-ELISA assay, b 1 and b 2 are constants calculated according to the OD values of the standard references (SR) on the same plate. A detailed description of the derivation process is shown in Appendix I.
Indirect-ELISA
The indirect-ELISA was used to quantify the anti-Schistosoma japonicum (Sj) antibody concentration in human serum, using a diagnostic kit for Sj from Shenzhen Combined Biotech Co., Ltd. The 96-well plates were pre-coated with Sj soluble egg antigen (SEA) and blocked with bovine serum. Test sera or control sera were added to each well, and after incubation, non-bound serum proteins were removed by washing (Immunowash microplate washer Model 1575, Bio-Rad Laboratories (UK) Ltd). Horseradish peroxidase (HRP)-labelled goat antibody to human IgG (H+L) was added to detect the egg antigen-bound human antibodies. Chromogenic substrate TMB (3, 3′, 5, 5′-tetramethylbenzidine) was added after incubation and washing away unbound goat antibodies. OD values were recorded at 450 nm with the ELISA plate reader (Clinibio 128C, ASYS Hitch GmbH, Austria) zeroed by the reagent blank wells after the reactions were stopped with 2 M H2SO4 stop solution.
Application and evaluation of the I-STOD method
Experiment design
The indirect-ELISA was performed using 26 multi-well plates. On each 96-well plate, 16 wells occupying the same location on each plate were designated for a duplicate of 8 serially diluted standard reference (SR) serum pool and 5 wells were randomly selected for the quality control (QC) (1:100 dilution) serum pools. Additionally, 1 positive control and 2 negative controls (sera from non-infected donors and from the kit) together with 2 blanks with no serum added were included on each plate. Wells for 35 duplicate assays (test sera at 1:100) were available.
Standard Reference (SR) and Quality Control (QC) sera
The serum samples used in these experiments were selected from the serum bank in our laboratory. Fifteen strongly positive sera from a Schistosomiasis japonica endemic area with high concentration of SEA-specific antibody were thawed and mixed fully, and then aliquoted into small vials and stored at −80°C to be used as the standard reference (SR) sera. Positive sera with moderate OD values were likewise pooled and aliquoted to serve as the quality control serum (QC, described below).
On each assay day, 1 vial of the SR was thawed and serially 2-fold diluted on casein-coated polystyrene plates from 1:100 to 1:12 800, in volume amounts suitable for 96-well assays. Based on previous studies, these dilutions were in the range of optimal OD values, within which OD values are shown to closely approximate a linear relationship with the plate-bound HRP enzyme concentration. Absolute antibody concentrations of these SR dilutions are unknown. Thus, to facilitate the analysis, we specified a value of 1·0000 units/ml (OD of blanks is subtracted for all data before defining the value 1·0000 in SR) for the antibody concentration value of the first serum dilution, i.e. the 1:100, and accordingly the concentration values of the subsequent dilutions are 0·5000, 0·2500, 0·1250, 0·0625, 0·0313, 0·0156, and 0·0078, respectively. All dilutions were tested in duplicate wells on each assay plate side-by-side. This resulted in all plates consisting of an 8-point dilution series of SR in duplicate, the OD values and the corresponding concentrations of which made up the reference data set of the plates that were used to construct the calibration curves with the different standardization methods.
Five randomly selected wells on each ELISA plate were designated for assay of the 1:100 dilution of the QC serum pool prepared before the experiment. The antibody concentration of the 1:100 dilution of QC fell within the range of the 8-point dilution series used for reference.
Standardization methods
To evaluate the fitness of the I-STOD model to experimental data of SR, we compared it with 5 other methods, including the 3-parameter Langmuir-type model (Kortlandt et al. Reference Kortlandt, Endeman and Hoeke1987), the OD-C linear model (Vestergaard et al. Reference Vestergaard, Poulsen, Gronbaek, Larsen, Nielsen, Ejskjaer, Clausen, Thim and Nexo2002), the semi-log model (Karpinski et al. Reference Karpinski, Hayward and Tryphonas1987), the log-log model (Plikaytis et al. Reference Plikaytis, Turner, Gheesling and Carlone1991; Okuma et al. Reference Okuma, Saito, O'Connor, Phillips, De Kretser and Hedger2005), and the 4-parameter logistic-log model (Plikaytis et al. Reference Plikaytis, Turner, Gheesling and Carlone1991). In the following equations, OD is the optical density value, C stands for the antibody concentration, and b 0, b 1, b 2, and b 3 are parameters to be determined by the SRs on the sample plates.
(1) I-STOD model.
 .
(2) Three-parameter Langmuir-type model (3pL). The function is
.(3) OD-C linear model (OD-C). The function is OD=b 0+b 1C.
(4) Semi-log model (semi-log). The function is OD=b 0+b 1 log C.
(5) Log-log model (log-log). The function is log OD=b 0+b 1 log C.
(6) Four-parameter logistic-log model (4pLL). The function is
.
 .
 .
 .
Quality control using Shewhart charts
OD values of 5 QC wells for each plate were transformed into the relative antibody concentrations (C) derived from each of the calibration curves generated by the I-STOD (described below) using the duplicate reference data sets (SR) on the same plate. Both the control data and control charts for OD and C values were established as depicted below.
The Shewhart charts system (National GB/T4091-2001, China) consists of a group of control charts. Among these, the most standard display used for quantitative variables consists of two charts, the X-bar ( ) chart and the R chart, both used for quality control in our experiments. The X-bar chart is used to observe fluctuation of the mean value of a particular variable, while the R chart is to observe fluctuation of the variance of a particular variable within-assay. To generate the Shewhart charts, several preliminary calculations were required, as indicated in Appendix II.
Statistical methods
All analyses were performed using Stata7.0. The constants (b 0, b 1, etc.) in the equations of these models were estimated by least squares. The antibody concentrations of the quality control (QC) serum pool in those wells are interpolated from the calibration curves generated by the standard reference serum (SR) on each plate. Within-plate and inter-plate coefficient of variation (CVs) of the OD values for both the quality control serum and the standard reference sera were calculated, as well as that of the transformed results by different models. Hierarchical cluster analysis was done with the Euclidean distance as the distance between 2 points and average linkage as distance between clusters.
RESULTS
Fitting of the standard calibration curves by I-STOD and its efficiency of standardization are the best among the 6 standardization methods
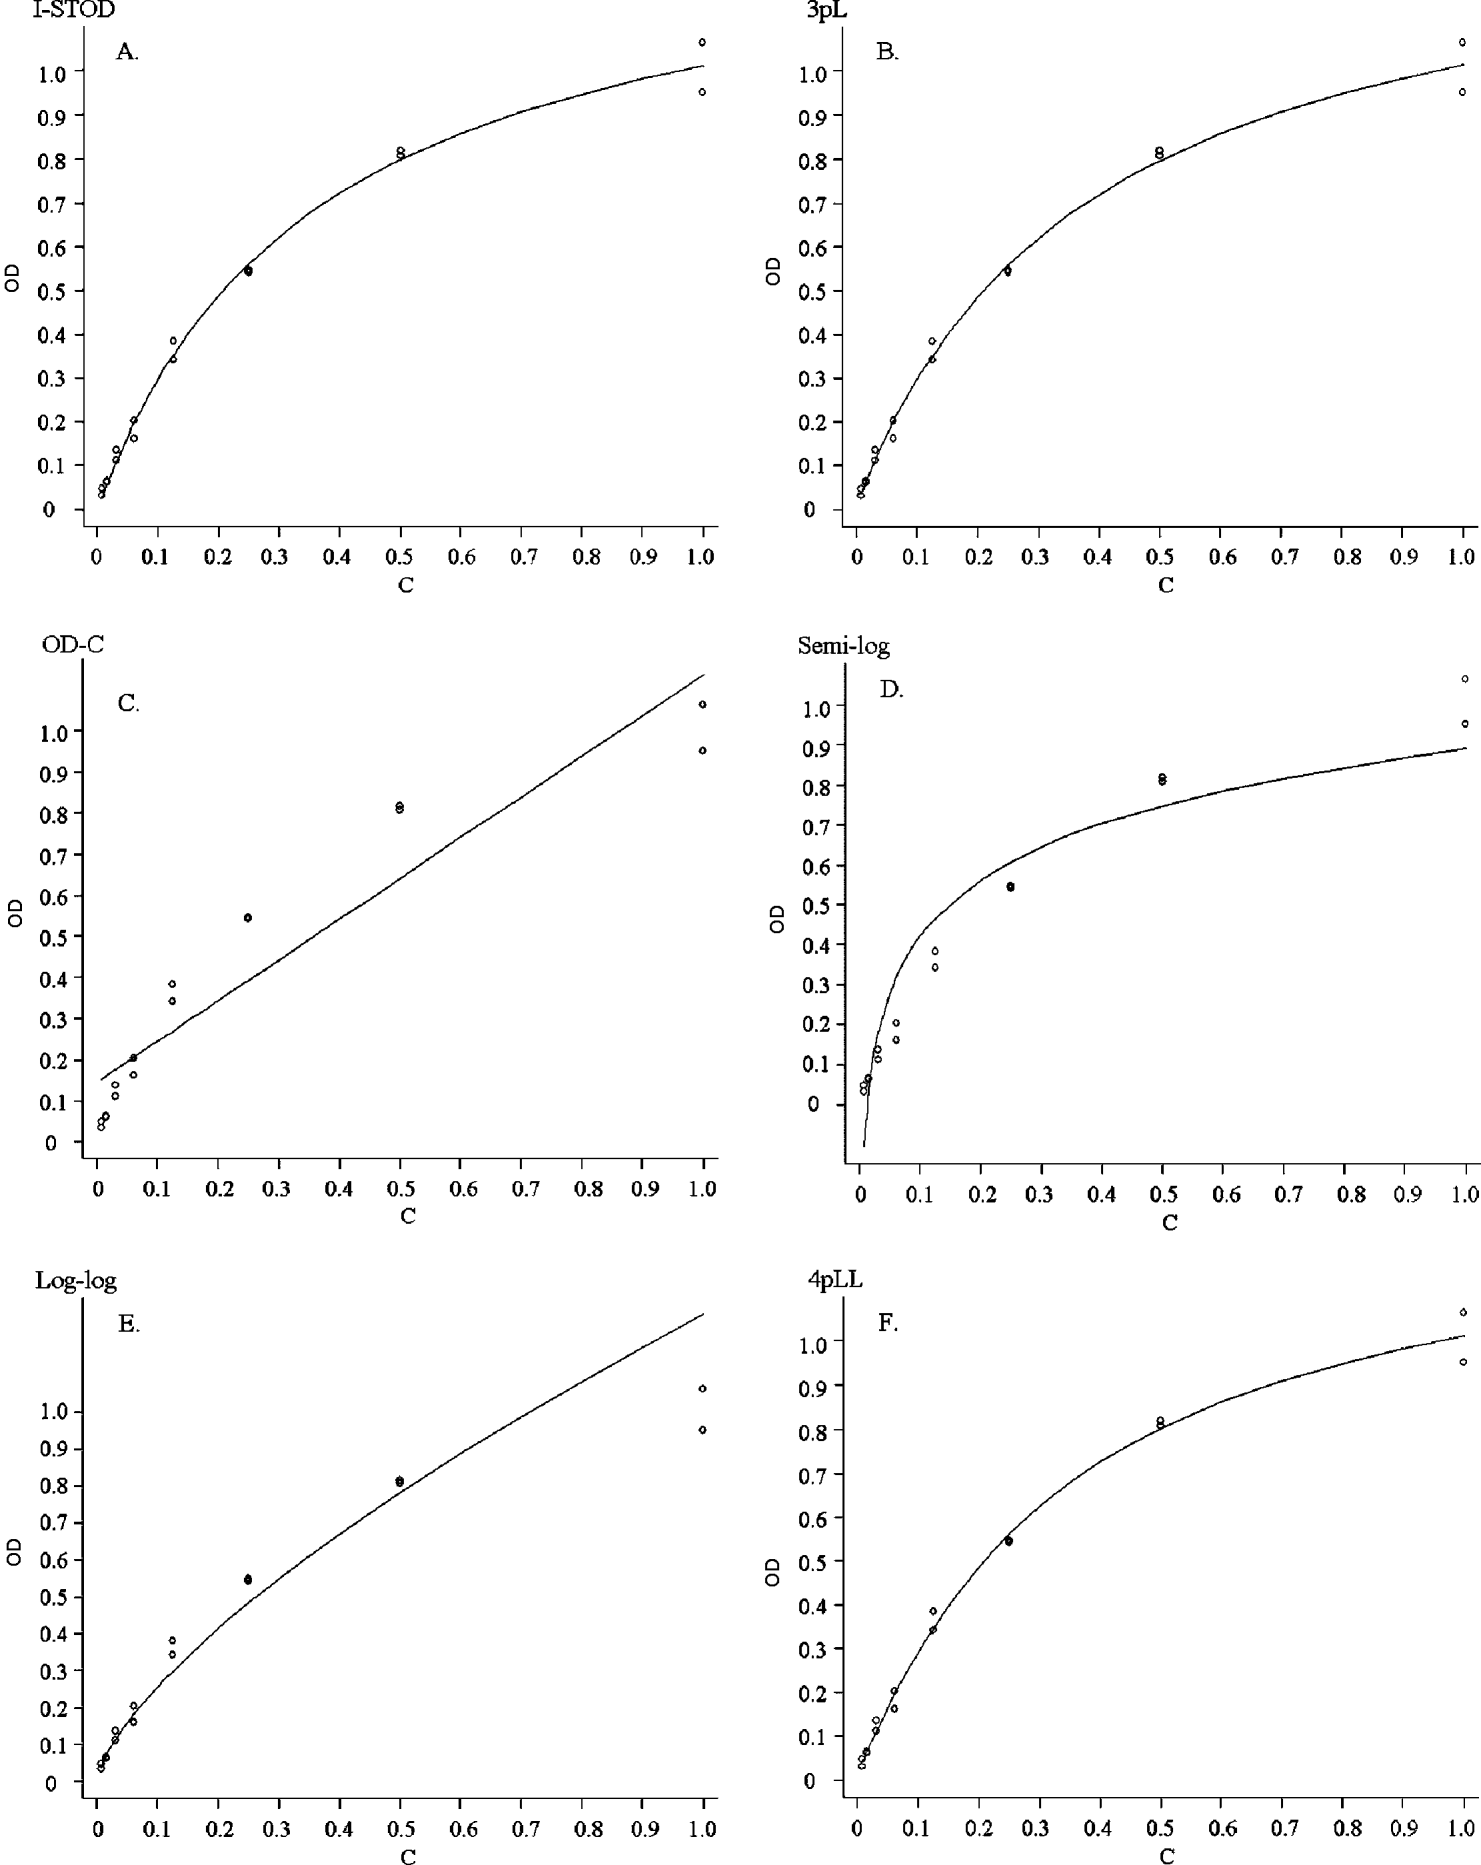
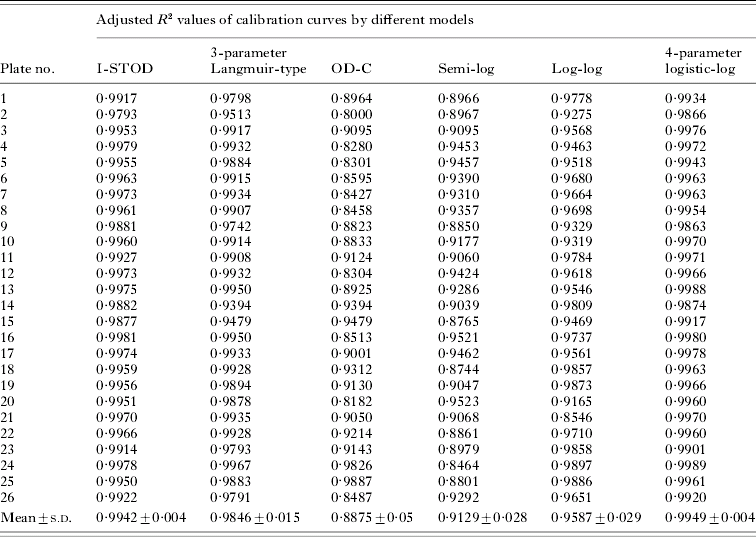
The OD values at each dilution of RS serum (in duplicate series) were used to generate calibration curves by applying the appropriate formulae (described in the Materials and Methods section) for each of the 6 different standardization methods. To quantify which of the formulae generated the best fit, we plotted all the calibration curves in OD-Concentration coordinates (Fig. 1, A–F) and then calculated the adjusted R 2 values of the calibration curves (Table 1). The curves of I-STOD and the 4-parameter logistic-log (4pLL) models achieved better adjusted R 2 values (adjusted R 2>0·99 on 22/26 plates), indicating excellent fits by these 2 methods, whereas the 3-parameter Langmuir-type model displayed inferior adjusted R 2 values compared to them. The other 3 models displayed poor fittings with the experimental data especially at the higher end of the calibration curves, as shown typically by Fig. 1C, D and E, accompanied by poorer adjusted R 2 values.
Six calibration curves in OD-Concentration coordinates fit to a typical reference data set from a serially diluted standard reference serum. The models corresponding to each curve are I-STOD (A), 3-parameter Langmuir-type (B), OD-C (C), semi-log (D), log-log (E), and 4-parameter logistic-log (F).

The adjusted R 2 values of the calibration curves by 6 different standardization models for 26 ELISA multi-well plates

The inter-plate variation is high for the values of OD, but improved by standardization with the I-STOD model
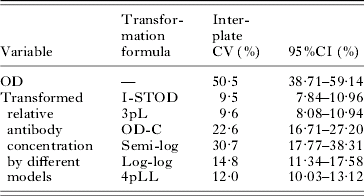
The coefficient of variation (CV) of OD values for the 5 randomly placed replicates of the quality control (QC) serum was calculated within each plate (n=5). The CV of the average values for QC sera from each plate was also calculated (n=26). The average within-plate CV of OD values was 2·0%, considered to be a satisfactory variation level. But the CV of OD values among the 26 plates was 50·5% on average (Table 2), much higher than the within-plate CV and showing that OD values among the 26 plates vary substantially. However, Table 2 also showed that the CV value calculated using the transformed antibody concentrations decreased dramatically especially by using the I-STOD method which was about 9·5%, on average, indicating that I-STOD improved the comparability of the ELISA results significantly.
Inter-plate CVs (coefficients of variation) of OD values or the transformed relative antibody concentrations by 6 different standardization models

Shewhart charts for quality control showed I-STOD generating more utilizable results
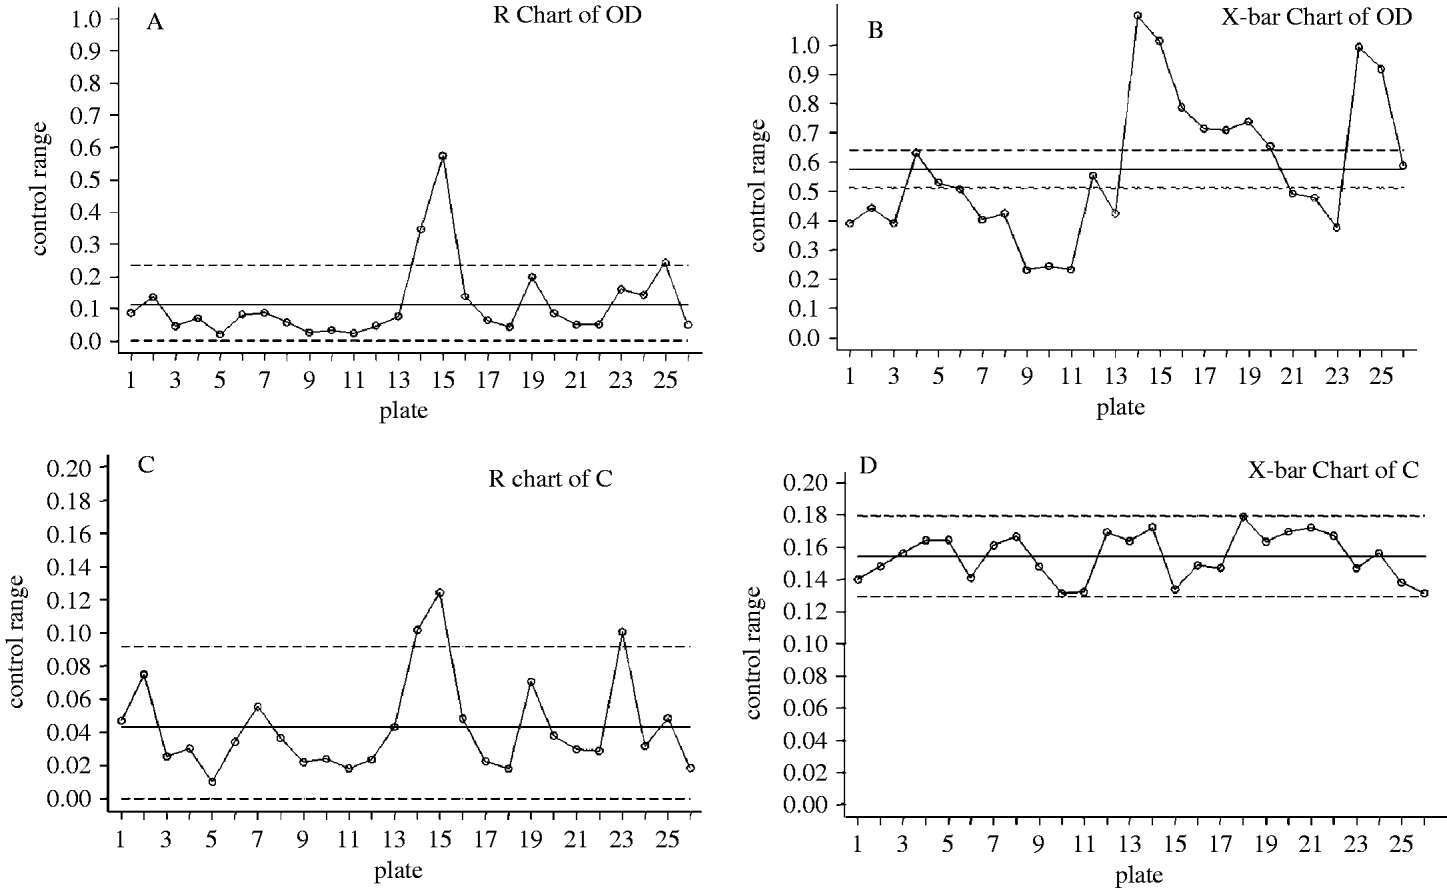
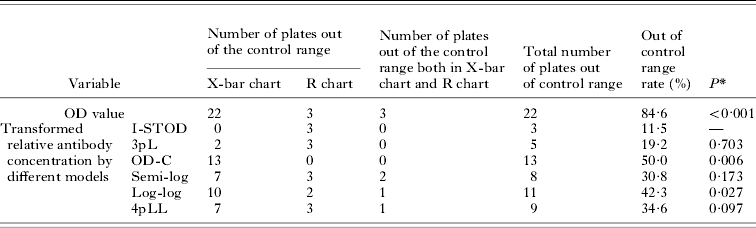
Shewhart charts for the results of ELISA, including the optical density values, and the transformed antibody concentrations standardized by the I-STOD method were plotted. The R chart of OD (Fig. 2A) shown that variations of results within plates were all within the control range except for 3, in accordance with the within-plate CV of OD values. But the inter-plate OD values varied so widely that most of them were outside the control range as shown in Fig. 2B, resulting in a total of 22 plates that were out of the control range and thus had to be discarded by quality control requirements. The number of plates outside of the control range decreased significantly when using the standardized antibody concentration transformed by either I-STOD or the other 5 methods. Table 3 shows the number of wells out of the control range using either OD or relative antibody levels. We only show here the Shewhart charts of the results standardized by I-STOD method in Fig. 2C and D, which illustrated that most of the values were within the control ranges for the inter-plate parameters after standardization, although the within-plate variation did not change. These results indicate that the standardized antibody concentrations are utilizable on most plates, while by using I-STOD, the highest number of plates (23 plates in total) were within the control range.
Shewhart control charts for OD values and the transformed antibody concentrations (C) by I-STOD standardization method on 26 multi-well plates.

Results of Shewhart control charts for OD values and the transformed relative antibody concentrations by 6 different standardization models on 26 multi-well plates

* Compared the out of control range rate of the relative antibody concentration standardized by I-STOD with that of the transformed antibody concentrations standardized by other models using Fisher's exact test.
Cluster analysis shows that the transformed antibody concentration standardized by the I-STOD method is one of the best measurements to describe the ELISA results on different plates
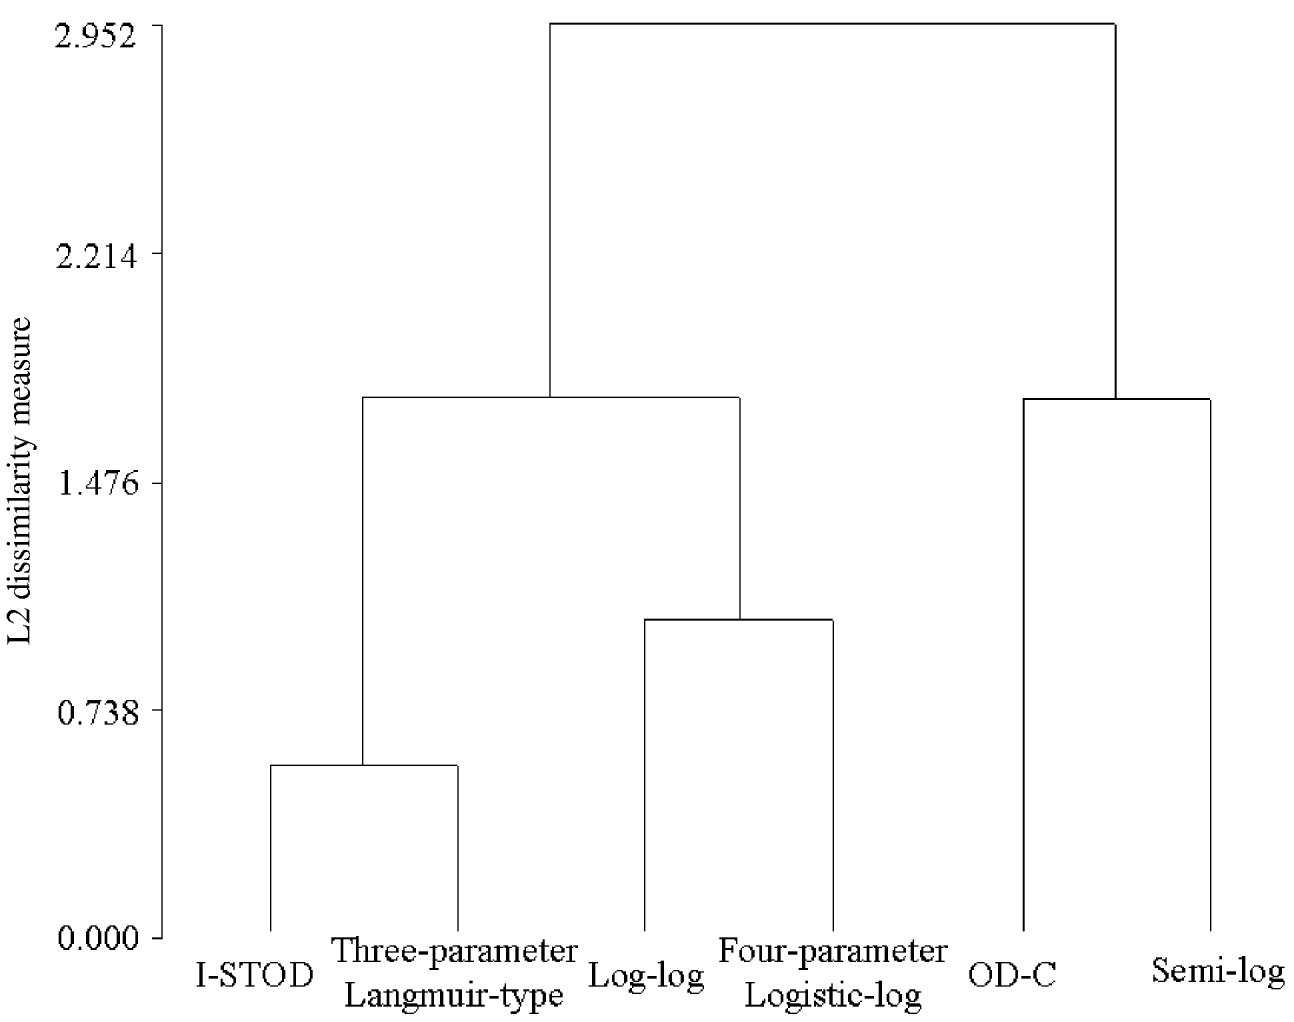
To further evaluate the effects of the 6 standardization methods above on the results of indirect-ELISA in different multi-well plates, a cluster analysis was performed. The adjusted R 2 values of the calibration curves of the standard reference data sets were used, as were the inter-plate CVs and the out of control range rates in Shewhart charts of the QC antibody concentrations standardized by these models. Results with close overall effects (higher adjusted R 2 values, and lower CV and out of control range rates) were categorized as belonging to the same cluster. Fig. 3 shows that these 6 models can be classified into 3 clusters. I-STOD and the 3-parameter Langmuir-type (3pL) models belong to the cluster with the best results in these categories, while the OD-C and semi-log models are in the third cluster with the lower average adjusted R 2 value (0·8875 and 0·9129 vs 0·9942), and the larger CV (22·6% and 30·7% vs 9·5%) and out of control rate values (50·0% and 30·8% vs 11·5%). I-STOD appears to be one of the best methods to standardize indirect-ELISA results on different plates.
Dendrogram for a cluster analysis of the efficiency of the 6 models to standardize the results of indirect-ELISA results on different multi-well plates using adjusted R 2 values of calibration curves, the inter-plate CVs and the out of control range rates in Shewhart charts.

The comparability of ELISA results across a large range of antibody concentrations was greatly improved by standardization using the I-STOD method on different plates
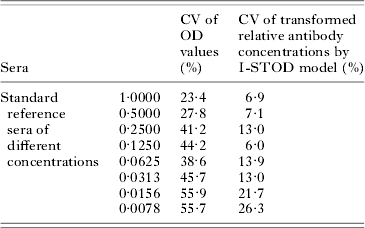
To evaluate the effect of the I-STOD method for ELISA results standardization at a wide range of antibody concentrations, we computed the coefficient of variation (CVs) of OD values for the 8 concentration points of the SR sera among the 26 plates. The results in Table 4 show that variations of OD values among the 26 plates were extremely large no matter whether the concentrations were high, medium or low, with CVs ranging from 23·4% to 55·9%. After the implementation of the I-STOD method, i.e. to transform the OD values into the relative concentration values with the calibration curves, the variations of the transformed antibody concentrations decreased largely at all levels (CVs were within 15% except for the low concentration end which was 21·7% at the concentration of 0·0156 and 26·3% at 0·0078, respectively), indicating that the I-STOD method does improve the comparability of ELISA results across a large range of antibody concentrations on different plates.
Inter-plate CV of OD values or the transformed relative antibody concentrations using I-STOD standardization model for the SR sera at different concentrations

Application of I-STOD to standardize the results on different ELISA plates
There are only 2 constants (b 1 and b 2) in the I-STOD method, which are relatively easy to calculate from the duplicated 8 points made by the SR data sets on the same plate. SR data sets can be put into Stata or any other statistical software like SAS or SPSS to generate the calibration curves and the values of b 1 and b 2 by running the specifically written procedures. Then one can calculate the antibody concentrations using the OD values from ELISA plate reader for each sample with b 1 and b 2 values according to the function of  . The scheme for calculation process is shown in Appendix III.
DISCUSSION
Several methods have been reported describing the relationship between OD value and protein concentration by ELISA. Among those methods, the semi-log model has been widely utilized, but it is empirical. The OD-C (optical density and concentration) linear model and the log-log model also lack a theoretical foundation (Plikaytis et al. Reference Plikaytis, Goldblatt, Frasch, Blondeau, Bybel, Giebink, Jonsdottir, Kayhty, Konradsen, Madore, Nahm, Schulman, Holder, Lezhava, Elie and Carlone2000). The 3-parameter Langmuir-type model is based on a sandwich-ELISA used to detect the antigen concentration in serum (Kortlandt et al. Reference Kortlandt, Endeman and Hoeke1987), but no further application has been reported. The 4-parameter logistic-log model, which was first largely applied in radioimmunoassays to quantify antigen concentration (Finney, Reference Finney1976) and then replaced by ELISA, is currently the most popular assay for protein, and sometimes for antibody quantification when a corresponding standard reference is available. Yet, the 4-parameter logistic-log model is not applicable in the situation where the curve consists of a summation of discrete sigmoidal components, or to non-monotonic curves with reversals of slope, or in cases of severe asymmetry when plotted as response against log dose (Dudley et al. Reference Dudley, Edwards, Ekins, Finney, Mckenzie, Raab, Rodbard and Rodgers1985). Overall, the methods mentioned above mainly focus on quantifying protein/antigen levels in samples in which an exact amount of a standardized sample is easily obtained. Comprehensive and applicable methods are needed to standardize antibody levels detected by indirect-ELISA and to assure comparability among different assay plates.
In our study, we constructed a mathematic model (I-STOD) for standardizing the antibody levels by indirect-ELISA. To evaluate the fitness of the I-STOD model to experimental data of indirect-ELISA assay, reference data sets were collected for each of the 26 multi-well plates. The OD-C model was the poorest in fitting the experimental data to the curve generated by the OD-C equation, with a mean R 2 value of 0·888±0·050 (mean±S.D.) compared to the I-STOD mean of 0·994±0·004 and many experimental points deviated severely from the curve. The semi-log model was the next poorest at predicting the ELISA results with an adjusted R 2 of 0·913±0·028 for its deviation from the calibration curve. Moreover, antibody concentrations show wider variations in inter-plate CV values using these two models. The CV of OD-C and semi-log calibration curves are 22·6% and 30·7%, with highly overlapping 95% CI of 16·71–27·20% and 17·77–38·31% respectively, relative to the CV (and 95% CI) of the I-STOD model, which is only 9·5% (8·08–10·94%), confirming that I-STOD is a significant improvement as a standardization method over either the OD-C or semi-log model. The log-log model showed a higher adjusted R 2 (0·9587±0·0293) compared with those of the OD-C and semi-log models, but it still displayed poor fittings with the experimental data, especially at the higher end of the calibration curves. Obviously, compared to I-STOD the other 3 models are less than optimal as standardization methods for indirect-ELISA results.
Although the calibration curve of the 4-parameter logistic-log (4pLL) model is essentially identical to I-STOD (mean adjusted R 2 were 0·995±0·004 and 0·994±0·004, respectively), the CV of I-STOD is lower (12·0% vs 9·5%) and their 95% confidence intervals barely overlap, favouring I-STOD as a simpler equation. Nevertheless, the 4pLL model involves 4 parameters to be estimated and the initial values for the parameters are usually difficult to assign, thus the iterative computing process is sometimes difficult to accomplish. The fitness of the 3-parameter Langmuir-type model ranked the third according to the adjusted R 2 values of 0·985±0·015, but the CV value of the standardized antibody concentrations is similar to I-STOD (9·6% vs 9·5%, virtually totally overlapping in 95% confidence interval), indicating that an extra parameter in this model comparing to the I-STOD model is redundant to the fitting effect. At this stage, we conclude that I-STOD is a simpler and more reproducible standardization method to improve the comparability of the results from indirect-ELISA on different multi-well plates, than the 4-parameter logistic-log model and the 3-parameter Langmuir-type model that have been used to define protein concentrations.
We also used Shewhart charts for further assessing quality control in our experiment. Shewhart control charts display the variation of the results both within and across the different plates (Appendix II), while the CV value presents the total variation of results among different plates. Thus, we used the number of plates yielding a mean or a range (R) of the OD/standardized antibody level (n=5) falling beyond the control range as another criterion for judging the variations of standardized antibody concentration within the 26 multi-well plates. The OD values of the QCs without standardization were mostly outside of the control range (22/26) calculated by the Shewhart X-bar and R chart and were therefore not acceptable. The out of control range rates of the standardized antibody concentration dramatically decreased compared with the straight OD values (P<0·001). Among them, standardized results by I-STOD attained the lowest rate (3/26) of out of the control range value although only significantly different with the OD-C and log-log model by Fisher's exact test. This shows again that I-STOD is an effective method to improve the comparability of results of indirect-ELISA.
We summarized the efficiency of the 6 models for standardizing the results of indirect-ELISA with a cluster analysis using all the 3 criteria for overall judgment, including the adjusted R 2 values of the calibration curves fitted by the standard reference data set using formulae of these models, the inter-plate CVs and the out of control range rates in Shewhart charts of the transformed antibody levels of the QCs by these models. The dendrogram shows that I-STOD and the 3-parameter Langmuir-type models are the two best methods to standardize indirect-ELISA results judged by the largest mean adjusted R 2, the smallest CV and out of control range rate of their cluster, although I-STOD appears the better one because of its larger adjusted R 2 (0·9942 vs 0·9846), smaller CV (9·5% vs 9·6%) and lower out of control rate (11·5% vs 19·2%). The log-log model and the 4-parameter logistic-log model are in an inferior cluster (the mean adjusted R 2 value, CV and out of control rate values of this cluster are 0·9768, 13·4% and 38·45, respectively). Although the 4-parameter logistic-log model generated calibration curves with the largest adjusted R 2 values among these 6 models, the CV and out of control rate are larger than that of I-STOD and the 3-parameter Langmuir-type models, indicating that its efficiency to standardize and improve the comparability of indirect-ELISA results was not the best. The semi-log and OD-C models appear even less efficient though they can also reduce the variability among duplicate samples on different multi-well plates to some extent.
The effective antibody concentration range to use the I-STOD method for ELISA results standardization was also evaluated. Large decreases of the coefficient of variation (CVs) of results for all 8 dilutions of the SR sera among 26 plates after implementation of the I-STOD standardization method demonstrated that the I-STOD method does improve the comparability of ELISA results across a large range of antibody concentrations on different plates.
Among the 6 methods, I-STOD and 3pL are the best for standardizing the results of ELISA in our experiments. I-STOD is the simpler of these 2 methods, with only 2 parameters that are straightforward to estimate (Appendix III). Though the 4pLL model has been widely used, no study has been found to directly evaluate the comparability of results on different multi-well plates transformed by it, while our experimental data show that this model is not as satisfying to effectively standardize all the results of indirect-ELISA of SR. The function of I-STOD is derived completely according to the reaction dynamics of indirect-ELISA, which provides it with a stronger theoretical background.
As shown in Appendix III, the 2 parameters in the function of I-STOD can be easily estimated with a reference data set from a serially diluted SR serum and then the OD values on different plates can be transformed into relative antibody concentrations, making the results more comparable, especially over different assay time-frames. To avoid the high dose ‘hook effect’ (where the OD at the highest concentrations falls to values less than the assay saturation level) the reference serum should be diluted appropriately to ensure that the OD values of them are not too high, generally less than 1·5. Below this level, the OD shows a positively linear correlation with the enzyme concentration (data not shown), and under this condition, the I-STOD function is more accurate. Likewise, if the OD value of the test sample is out of the range of SR, we need to do a 1:2 dilution to the sample at the higher end and run the assay again.
In conclusion, we have set up the I-STOD standardization method as a simple and powerful tool for normalizing the results of indirect-ELISA. We also showed that dramatic differences exist when using straight OD to compare antibody levels among different multi-well plate assays. Together these results underscore the importance of the indirect-ELISA OD values for both clinical and field research studies. There are data indicating that a standardization method is certainly necessary for antibody levels detected for the illustration of the clinical difference properly. I-STOD greatly improved the comparability of indirect-ELISA results on different multi-well plates. We suggest that one should combine the I-STOD method with Shewhart quality control charts to ensure the quality of indirect-ELISA results especially when doing large-scale quantitative antibody detections.
We wish to thank Academician Zhixin Wang at the Department of Biological Science and Biotechnology, Tsinghua University, for his suggestion on enzyme dynamics and Pengcheng Xun from the department of Epidemiology and Statistics, Nanjing Medical Universtiy, for his help on statistical methods. This work was supported by the National Key Technologies R&D Program for China's Tenth Five-Year Plan, Grant No. 2004BA718B05, the Preventive Medicine Project of the Jiangshu Department of Public Health (Y2003) and the National Natural Science Foundation of China, Grant No. 30671836.
APPENDIX I
I-STOD equation derivation
We derived the I-STOD (Improved STandardization method for Optical Density) equation according to the reaction dynamics of the indirect-ELISA to standardize results of the indirect-ELISA assay by transforming the optical density (OD) values into relative antibody concentrations with respect to a standard reference serum pool (SR). The derivation process is described here in detail for reference.
Let C denotes the measured concentration of Schistosoma japonicum egg-specific antibody concentration in the serum to be detected, and OD the value. Then, we can get the reaction equations as follows:Step1. A reaction of immobilized antigen Ag with antibody Ab 1 (to be detected) to produce antigen-antibody complex Ag:Ab 1, the corresponding reaction equation is:

Let R 1 denotes the initial concentration of the immobilized antigen. When the reaction attains the immunological equilibrium, the concentrations of non-bound antigen, antibody and antigen-antibody complex are [Ag], [Ab 1] and [Ag:Ab 1], respectively. The equilibrium constant of this reaction is K 1, then:


Substituting (1) and (2) into (3), then

When [Ag:Ab 1] is low,


Approximately, CR 1=(K 1+R 1+C)[Ag:Ab 1]

Step2. A reaction of antigen-antibody complex Ag:Ab 1 with an enzyme-labelled antibody Ab2E which results in antigen-antibody-enzyme labelled antibody complex Ag:Ab 1:Ab 2E.

Let R 2 denotes the initial concentration of the enzyme labelled antibody. When in the immunological equilibrium, the concentration of antigen-antibody-enzyme labelled antibody complex is [Ag:Ab 1:Ab 2E], and the equilibrium constant is K 2. Similarly, we get this formula:

Step3. A reaction of the antigen-antibody-enzyme labeled antibody complex catalyses the substrate into a detectable product.

If the initial quantities of the substrate added into every well were equal, and stop the catalysis of all wells at a same time, the concentration of the detectable product [P] is linearly correlated with [Ag:Ab 1:Ab 2E], and the coefficient is K 3.Then,

Step4. Detect the OD value of the final product using the microtiter plate reader. According to the Lambert-Beer law, then

Substituting (4), (5) and (6) into (7), then

Among this formula,


For every multi-well plate, b 1 and b 2 are constants.
APPENDIX II
The calculation formulations for Shewhart control charts
The Shewhart charts system used in the context consists of 2 charts, the X-bar () chart and the R chart. The X-bar chart is used to observe fluctuation of the mean value of a particular variable, while the R chart is to observe fluctuation of the variance of a particular variable within-assay. To generate the Shewhart charts, several preliminary calculations are required, as indicated below.
Let x 1, x 2, x 3, x 4, x 5 denote the results to be evaluated (they are D values of 5 replicates of QC and C values based on I-STOD equation using the same OD in our study) on each plate.
The following variables were calculated for the X-bar chart:
I.
5 wells, each well yields 6 values of C from the 6 different equations (A–F); is the mean value of OD or C values of the 5 replicates of control serum within-plate.II.
is the mean value of OD or C of control serum on all the 26 plates.Then, the following values were calculated for the R chart:
III.
max is the highest value of x for a plate; min is the corresponding lowest value.
IV.
V.
VI.
VII.
CL x, UCL x, LCL x are values corresponding to the center, upper and lower limit lines on chart.VIII.
IX.
X.
CL R, UCL R, LCL R are values corresponding to the center, upper and lower limit lines in R chart.


 is the mean value of OD or C of control serum on all the 26 plates.


APPENDIX III
Here we show a schema for the calculation of antibody concentrations using I-STOD. C[ ] denotes the concentration of the standard reference serum and OD[ ] is the corresponding optical density value. OD represents optical density value of detected sample while C is the transformed concentration.
A. Program for calculation with I-STOD
Step 1:
Estimation of parameters b1 and b2
Step 2:
Transformation of OD values to concentrations
B. An example of I-STOD application
Standard reference serum