Introduction
The bone-anchored hearing aid (BAHA®; Cochlear Bone Anchored Solutions, Göteborg, Sweden), first described in 1977,Reference Håkansson, Tjellström, Rosenhall and Carlsson1, Reference Tjellström, Håkansson and Granström2 is commonly offered to patients with mixed or conductive hearing loss who are unable to wear a conventional hearing aid, or who are unsuitable for middle-ear surgery. Single-sided deafness is another, more recent indication. While all patients in this study were fitted with the BAHA, we would expect the results of our study to apply to similar products, such as the Ponto® hearing aid (Oticon Medical AB, Askim, Sweden).
In this study, our goal was to determine if we could predict the subjective benefits experienced by BAHA recipients from simple, objective measures of their aided hearing levels. In particular, we examined how simple sound-field hearing thresholds with the BAHA, the most commonly used clinical audiometric test, correlated with the long-term, subjective benefits perceived by BAHA recipients. This could act as a predictive guide to patient satisfaction for clinics using similar tests.
A variety of investigative modalities are used to evaluate the objective improvements seen with BAHA use. In a clinical scenario, the most commonly used modality is sound-field threshold testing. Almost all potential BAHA recipients receive a sound-field test with the BAHA on a headband, to test the expected sound-field improvements in hearing ability. Headband studies are fairly predictive of final sound-field results with the BAHA fitted.Reference Verstraeten, Zarowski, Somers, Riff and Offeciers3 After fitting, most clinics will also perform BAHA sound-field threshold testing with the BAHA positioned at the implanted abutment. Most clinics have access to, or time to perform, only this type of testing and not more sophisticated tests. Other methods, such as the Hearing in Noise Test score,Reference Niparko, Cox and Lustig4 Real-Ear Sound Pressure Level and Real Head Acceleration Level, have also been described.Reference Hodgetts, Håkansson, Hagler and Soli5 All find significant improvements with the use of the BAHA in properly selected patients.
In terms of measuring the subjective benefits, BAHA recipients have well-documented improvements in subjective quality-of-life measurements, such as the Glasgow Benefit Inventory, the Medical Outcome Study Short-Form Health Survey, and the EQ-5D (EuroQol Group, Rotterdam, The Netherlands) and Hearing Handicap Inventory for Adults questionnaires.Reference Sánchez-Camón, Lassaletta, Castro and Gavilán6–Reference Wazen, Spitzer, Ghossaini, Kacker and Zschommler14
For the subjective benefits instrument, we chose to use the Speech, Spatial and Qualities of Hearing Scale,Reference Gatehouse and Noble15 a comprehensive, validated, 49-item questionnaire that investigates three separate domains of hearing. The first 14 items explore speech recognition under diverse conditions, with variability in the background environment and in the number of speakers. This includes common scenarios, such as group conversations, using the telephone and conversing with a television in the background. The spatial set includes 17 items that probe not only the directionality of aided hearing, but also the perceived distance and movement vector. The last 18 items address other qualities of hearing, including sound segregation, clarity and required listening effort. For example, the question ‘Do you have to concentrate very much when listening to someone or something?’ moves beyond simple volume and intelligibility, and assesses the everyday functional value of a hearing aid for an impaired listener.
In this study, we concentrated on subjects with mixed or conductive hearing loss only and excluded subjects with single-sided deafness, to ensure a more homogeneous population. While single-sided deafness BAHA patients do well with audiometric evaluation, particularly with regards to improvements in speech recognition in noise,Reference Verstraeten, Zarowski, Somers, Riff and Offeciers3 reported subjective evaluations have been more mixed than the conductive hearing loss studies. House et al. administered the Speech, Spatial and Qualities of Hearing Scale questionnaire to patients with single-sided deafness with and without a BAHA, and did not find a significant qualitative improvement.Reference House, Kutz, Chung and Fisher16 In a controlled study, Martin et al. tested 58 patients with single-sided deafness with the Speech, Spatial and Qualities of Hearing Scale, and also found no demonstrable subjective benefit.Reference Martin, Lowther, Cooper, Holder, Irving and Reid17 Both Kunst et al.Reference Kunst, Leijendeckers, Mylanus, Hol, Snik and Cremers18 and Dumper et al.Reference Dumper, Hodgetts, Liu and Brandner19 did not find significant improvement in directional hearing in patients with single-sided deafness. Hence, while both objective and subjective measurements in BAHA recipients have been investigated, their relationship is poorly understood and requires elucidation.
Our study had three main aims. In patients implanted with a BAHA for conductive hearing loss, we wished to: (1) compare objective and relatively simple measurements of hearing level with the BAHA in a sound field (as are commonly collected clinically) with subjective evaluations of its utility; (2) better understand how the individual, subjective aspects of hearing, including speech recognition and spatial perception, correlate with routine audiometric evaluation in potential BAHA recipients; and (3) compare the benefits perceived by the partners or spouses of BAHA recipients with those perceived by the recipients themselves. Parts of this particular component have already been reported.Reference McNeil, Gulliver, Morris and Bance20
Materials and methods
The Capital Health Ethics Board of Dalhousie University (Halifax, Canada) approved this study. We identified adult patients enrolled in the Nova Scotia BAHA programme from July 2002 to July 2008. Exclusion criteria included patients with single-sided deafness, children and BAHA recipients unable to complete the questionnaire due to cognitive limitations. We excluded the single-sided deafness population because the results are complex and, as noted in the introduction, this population differs from the conductive hearing loss population in the usefulness and expectations from the BAHA.
All BAHA recipients meeting the inclusion criteria received a survey that included the Speech, Spatial and Qualities of Hearing Scale. In addition, their partners were asked to complete pre- and post-BAHA-modified Hearing Handicap Inventory for Adults questionnaires, detailed results of which have been published separately.Reference Dumper, Hodgetts, Liu and Brandner19 Only those sections not previously reported are included in this article. The Hearing Handicap Inventory for Adults questionnaire is a series of 10 questions scored between 0 (no handicap) and 4 (significant handicap), with a cumulative score between 0 and 40.
In the ‘Results’ section of this article, the ‘BAHA fitted’ results indicate sound-field thresholds measured with the BAHA positioned at the implanted abutment, measured at the time of the first post-surgical fitting.
We collected a pre-BAHA pure tone average (PTA) for the fitted sound-field threshold and from standard audiograms; we also collected the air bone conduction and air conduction levels in the better and worse hearing ear.
Analysis
The Pearson's correlation coefficient was used to compare the pre-BAHA audiogram to the sound-field PTA once the BAHA had been fitted. The coefficient was also used to compare the audiometric results with the Speech, Spatial and Qualities of Hearing Scale and the screening version of the Hearing Handicap Inventory for Adults questionnaire results.
Results
Population
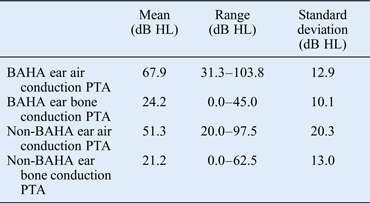
One hundred and twenty-two patients met the inclusion criteria and were sent the questionnaire. Approximately four weeks after the initial questionnaire was sent, members of the research team contacted non-responders to offer assistance in completing and returning the questionnaire. Of the 122 questionnaires sent, 78 (64 per cent) were completed and returned. Not all responders completed all sections of the questionnaire. The Speech, Spatial and Qualities of Hearing Scale questionnaire was completed satisfactorily by 58 of the 78 responders (74 per cent), and to an extent that the results could be tabulated. The pre-BAHA audiometric patient profile is summarised in Table I.
Summary of the audiometric results obtained before the BAHA was fitted

BAHA = bone-anchored hearing aid; PTA = pure tone average
Audiometric correlation
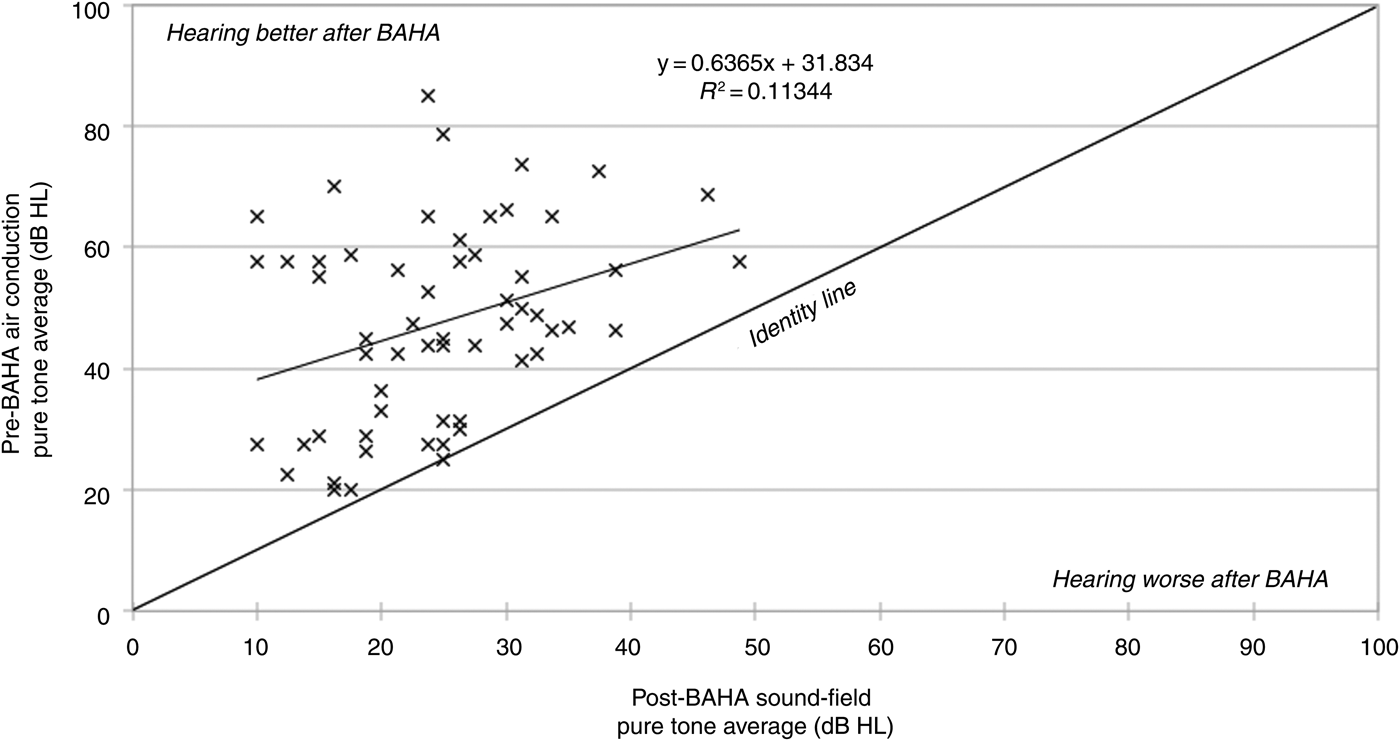
To evaluate the objective improvement in sound-field hearing ability, we compared the pre-operative, better hearing ear air conduction PTA (which presumably would determine the sound-field hearing levels) with the first, post-surgical, BAHA-fitted PTA. The Pearson's correlation coefficient was used to compare the pre-BAHA audiogram to the sound-field PTA post-BAHA fitting and to compare the audiometric results with the Speech, Spatial and Qualities of Hearing Scale and the screening version of the Hearing Handicap Inventory for Adults questionnaire results (r = 0.336, p = 0.0097). This relationship is shown in Figure 1.
Graph comparing the pre-BAHA pure tone average to the sound-field pure tone average measured after the BAHA was fitted. The identity line is the line on which no change in hearing thresholds would fall; subjects falling above this line showed improved hearing after the BAHA was fitted, while the hearing of subjects falling below this line was worse post-BAHA fitting. BAHA = bone-anchored hearing aid
The identity line is the line on which no change in hearing thresholds would fall; subjects falling above this line showed improved hearing after the BAHA was fitted, while the hearing of subjects falling below this line was worse post-BAHA fitting. Clearly, almost all BAHA recipients had a substantial improvement in their ability to detect sound in a sound field after the BAHA was fitted. The significant correlation suggested that those with the worst hearing pre-implantation showed the least improvement after the hearing aid was fitted, which may correlate with the fact that those who had the worst hearing often had mixed hearing loss, with greater loss of inner-ear function.
Correlation between audiometric results and the Speech, Spatial and Qualities of Hearing Scale
To compare the objective audiometric tests with the subjective evaluations of hearing after the BAHA was fitted, the patients' pre-operative objective and BAHA-fitted hearing thresholds were compared with the subjective Speech, Spatial and Qualities of Hearing Scale findings post-BAHA fitting. The average time between BAHA fitting and the administration of the Speech, Spatial and Qualities of Hearing Scale was 1050 (±527) days.
When comparing the pre-operative audiogram with the total Speech, Spatial and Qualities of Hearing Scale score, the PTA of the better hearing ear air curve (r = 0.30, p = 0.021) and worse hearing ear air curve (r = 0.27, p = 0.039) demonstrated a significant correlation to the Speech, Spatial and Qualities of Hearing Scale results.
A simple linear regression model was developed, comparing the pre-operative better hearing ear PTA with the post-operative Speech, Spatial and Qualities of Hearing Scale. The resulting equation was: Speech, Spatial and Qualities of Hearing Scale = 7.20 − (PTA × 0.0269). For example, a patient with a pre-operative PTA of 40 should obtain a post-operative Speech, Spatial and Qualities of Hearing Scale score of 6.12 out of 10.
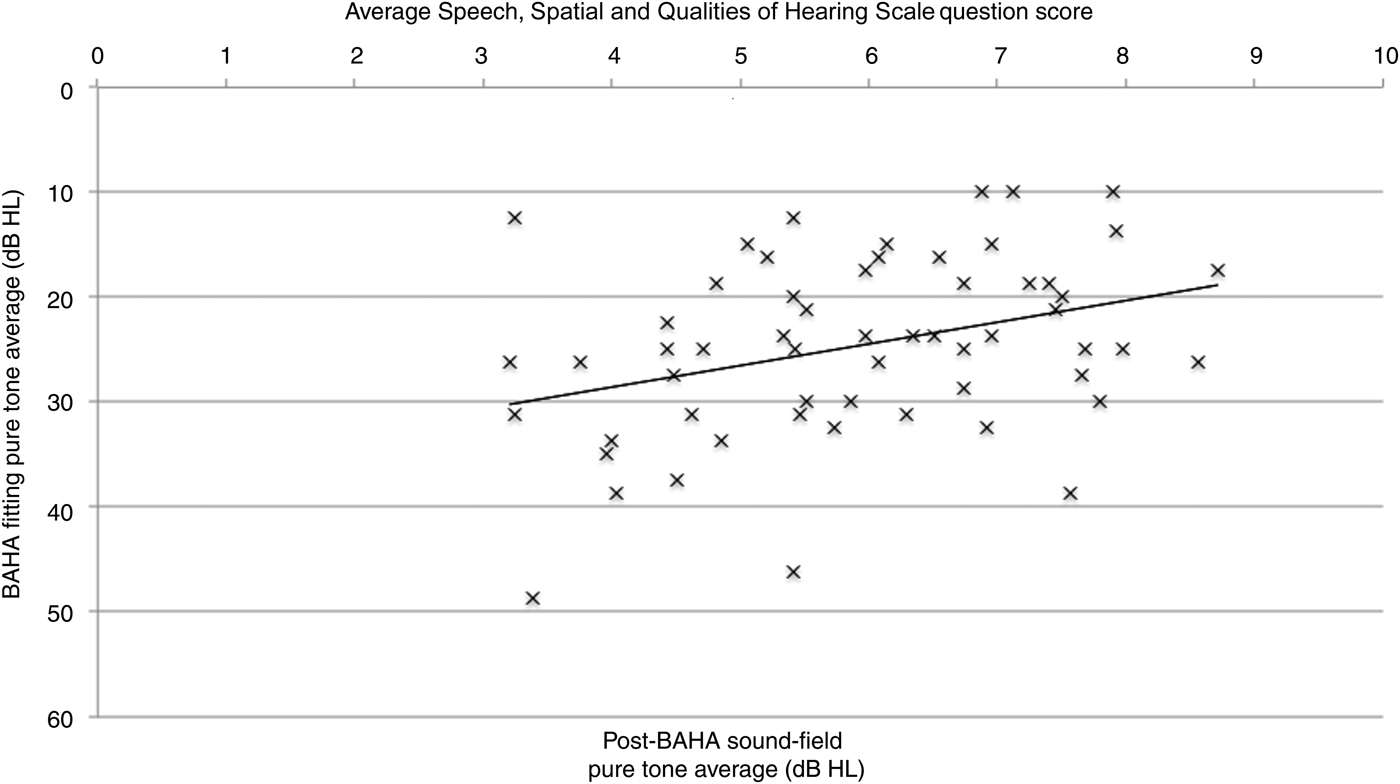
The post-operative, BAHA-fitted sound-field threshold also showed a significant, and higher, correlation with the total Speech, Spatial and Qualities of Hearing Scale score (r = 0.35, p < 0.01) (Figure 2). This implies that better hearing is associated with less subjective functional handicap.
Graph depicting the significant, and higher, correlation of the post-operative, bone-anchored hearing aid-fitted pure tone average to the Speech, Spatial and Qualities of Hearing Scale score. BAHA = bone-anchored hearing aid
As the subscales of the Speech, Spatial and Qualities of Hearing Scale measure unique aspects of hearing, they were individually compared with the sound-field PTA post-BAHA fitting. The ‘speech’ subscale was moderately, but significantly, correlated (r = 0.44, p < 0.001). However, the ‘spatial’ (r = 0.25, p = 0.061) and ‘other qualities’ (r = 0.16, p = 0.22) subscales were not significantly correlated.
Magnitude of audiometric improvement and the Speech, Spatial and Qualities of Hearing Scale
To determine if the magnitude of hearing improvement also correlated with the subjective benefit scores, the difference between pre-operative and BAHA-fitted sound-field hearing results was compared with the subjective benefit, again using the Pearson's correlation coefficient. The difference between the air conduction PTA in the better hearing ear and the final, BAHA-fitted sound-field PTA (i.e. the difference in sound-field audibility) did not significantly correlate with the Speech, Spatial and Qualities of Hearing Scale responses (r = 0.13, p = 0.35).
Comparing the Speech, Spatial and Qualities of Hearing Scale results with the hearing threshold of the non-bone-anchored hearing aid ear
Given that a small subset of BAHA recipients had reasonably good air conduction thresholds on the contralateral side, thus suggesting good, pre-BAHA sound-field thresholds, we compared this group to patients with poorer contralateral hearing to determine if this affected their subjective results with the Speech, Spatial and Qualities of Hearing Scale. This comparison was then for those whose BAHA brought more symmetrical hearing (i.e. good hearing levels on the non-implanted side also), to those who still had significant asymmetry after the BAHA was fitted.
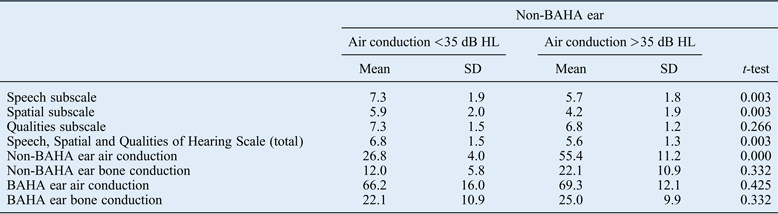
Sixteen of the 58 BAHA recipients had non-BAHA air conduction thresholds between 20.0 and 33.1 dB HL (mean = 26.8, standard deviation = 4.0), i.e. within the range of ‘social hearing’. Comparing this group with patients with contralateral air conduction thresholds >35 dB HL, the former group reported significantly better subjective outcomes in the ‘speech’ and ‘spatial’ subscales of the survey, as well as in the total Speech, Spatial and Qualities of Hearing Scale score (t-test, p < 0.005 in all comparisons). However, there was no difference found on the set of questions of the ‘qualities’ subscale (p = 0.266). Table II outlines the audiometric findings and the Speech, Spatial and Qualities of Hearing Scale results for both groups.
Comparison of the speech, spatial and qualities of hearing scale (and its subscales) with the non-BAHA ear air conduction thresholds
BAHA = bone-anchored hearing aid; SD = standard deviation
Comparing the subjective results of the bone-anchored hearing aid recipients with those of their partners
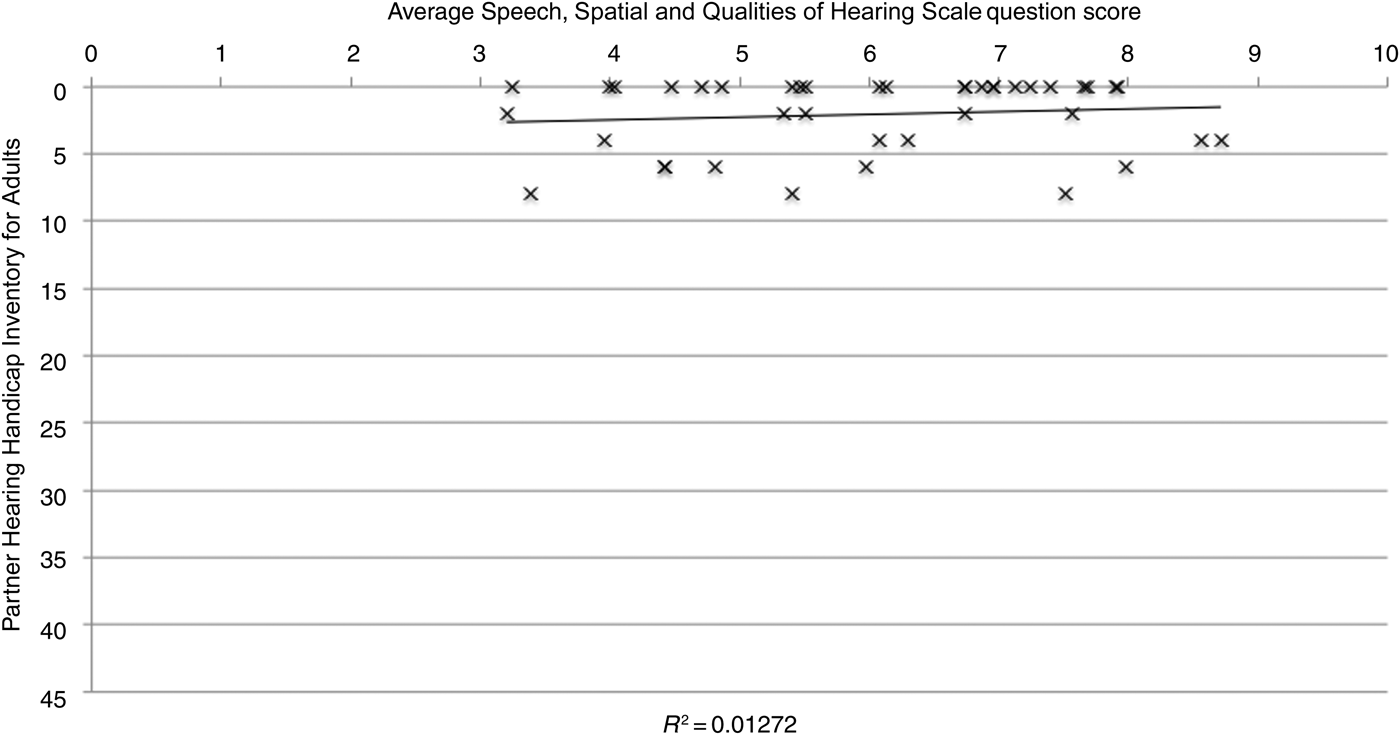
Forty-eight patients who completed the Speech, Spatial and Qualities of Hearing Scale questionnaire had partners who returned the Hearing Handicap Inventory for Adults questionnaire; 42 partners (87.5 per cent) reported a post-BAHA handicap of 10 or less, including 23 (47.9 per cent) who reported no handicap (Hearing Handicap Inventory for Adults score = 0). There was no correlation between patient (Speech, Spatial and Qualities of Hearing Scale) and partner (Hearing Handicap Inventory for Adults) qualitative evaluation (r = −0.021, p = 0.45) (Figure 3).
Graph depicting the lack of correlation between patient (Speech, Spatial and Qualities of Hearing Scale) and partner (Hearing Handicap Inventory for Adults) qualitative evaluation.
Discussion
Correlation between audiometric results and the Speech, Spatial and Qualities of Hearing Scale
Because there was a significant correlation between pre- and post-BAHA audiograms, we were not surprised to learn that the pre-BAHA audiometric findings of our patients correlated significantly with their subjective experiences post-BAHA fitting, as demonstrated by the Speech, Spatial and Qualities of Hearing Scale results. Indeed, the pre-operative better hearing ear bone conduction curve is likely to determine the sound-field audiogram once the BAHA has been fitted. Gatehouse and NobleReference Gatehouse and Noble15 demonstrated similar, albeit stronger, correlations between the Speech, Spatial and Qualities of Hearing Scale and the better (r = 0.51 vs ours at r = 0.30) and worse hearing ear (r = 0.52 vs ours at r = 0.27) PTAs in a diverse group of hearing-impaired subjects (non-BAHA users). This difference may be accounted for by the better baseline hearing of their study population; their patients' average better hearing ear PTA was 38.8 dB HL (vs ours at 47.5 dB HL), while the worse hearing ear PTA was 52.7 dB HL (vs ours at 68.5 dB HL).
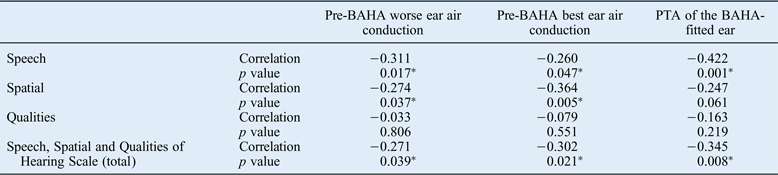
In the most important part of our study, when comparing the sound-field audiograms from the BAHA-fitted subjects with the subjective benefits, there was a significant correlation with the overall Speech, Spatial and Qualities of Hearing Scale score; however, on closer analysis, only the ‘speech’ subscale was statistically significant, while the ‘spatial’ and ‘other qualities’ subscales were not. When looking at the audiogram before the BAHA was fitted, both the better and worse hearing ear air conduction thresholds correlated significantly with both the ‘speech’ and ‘spatial’ subscales of the Speech, Spatial and Qualities of Hearing Scale as well as the total Speech, Spatial and Qualities of Hearing Scale score, but not with the ‘other qualities’ subscale (see Table III). This simply implies that the better the hearing, the less a functional handicap there is.
Comparison of the speech, spatial and qualities of hearing scale (and its subscales) with the pre-BAHA fitting air conduction thresholds and the pure tone average of the BAHA-fitted ear
Correlation: Pearson's correlation coefficient. *Two-sided p value (p < 0.05). BAHA = bone-anchored hearing aid; PTA = pure tone average
These data suggest that while speech recognition is significantly improved, at least subjectively, with the introduction of the BAHA, improvement in spatial sound recognition in patients with conductive and mixed hearing loss remains elusive. The ‘speech’ subscale focuses on understanding speech and on clarity, which may functionally be the most important for everyday life. The other subscales, including the ‘spatial hearing’ (directional or distance perception) and ‘sound quality’ subscales (clarity, naturalness and listening effort) are still very important, but do not seem to be predicted by the sound-field hearing tests.
Also, perhaps not surprisingly, patients who can be made more symmetrical in their hearing, tend to show less functional handicap on the Speech, Spatial and Qualities of Hearing Scale. This was not the main focus of our study, which looked only at a single predictor variable (the measured sound-field hearing level) – all that is tested in most clinics.
In extrapolating from our findings, since pre-implantation headband sound-field audiograms are well correlated with BAHA-fitted sound-field thresholds (e.g. the study by Verstraeten et al.Reference Verstraeten, Zarowski, Somers, Riff and Offeciers3 and our own experience), the headband sound-field PTA is likely to correlate with the post-BAHA fitting hearing handicap levels, at least for speech perception.
Magnitude of audiometric improvement and the Speech, Spatial and Qualities of Hearing Scale
Our final question regarding the relationship between audiometric findings and the Speech, Spatial and Qualities of Hearing Scale explored whether the magnitude of sound-field improvement correlated with the perceived improvement in subjective outcomes. For example, we posited that a PTA improvement from 60 to 20 dB HL may result in a measurably different experience and subjectively perceived benefits than an improvement from 40 to 20 dB HL. However, we could not demonstrate a statistically significant association, suggesting that the final sound-field threshold is more clinically relevant.
Comparing the findings from the bone-anchored hearing aid recipients and their partners
We were surprised to discover a lack of a significant correlation between patient (Speech, Spatial and Qualities of Hearing Scale) and partner (Hearing Handicap Inventory for Adults) subjective outcomes. However, in examining the Hearing Handicap Inventory for Adults data, partner perceptions skewed strongly towards no handicap. With 87.5 per cent of respondents measuring in the lowest quartile range (0–10) and almost half reporting no handicap, a significant correlation was difficult to demonstrate.
Limitations of the study
Several attempts were made to increase responder rates, with limited success. Each non-responder was called after the initial mailing of the questionnaire. The complexity and length of the questionnaire (86 questions) may have affected the response rate.
• The bone-anchored hearing aid (BAHA) has been shown to improve hearing and quality of life
• There is no previous model for predicting BAHA success based on pre-BAHA audiometry
• Pre-operative audiometry correlates well with the speech and spatial qualities of hearing
• The magnitude of sound-field improvement predicts spatial hearing improvement
The current study examined retrospective data. Additional understanding would be gained by using prospective data collection, to compare pre- and post-BAHA subjective findings. We do, however, have a fairly long-term follow up, and our data are not contaminated by any initial ‘Wow, I can hear!’ effect on the subjective benefit from when the BAHA is first fitted.
Conclusion
Our results demonstrate that both pre- and post-BAHA audiometric findings correlate moderately with the subjective hearing experience of patients. Sound-field hearing thresholds correlate significantly only with those aspects of hearing that are related to speech clarity or comprehensibility, but not with the spatial aspects (at least not with a unilateral BAHA) or quality of sound. However, those patients with better air conduction hearing levels on standard audiometry prior to BAHA fitting have less functional handicap, as expected.
Potential BAHA recipients with conductive or mixed hearing loss are likely, on average, to perceive improvements in understanding speech under a variety of conditions, but with wide variability. On the other hand, those patients who had relatively good hearing in the non-BAHA implanted ear also showed improved functional hearing for both the spatial and sound quality aspects of the Speech, Spatial and Qualities of Hearing Scale, in keeping with achieving more symmetrical hearing. This helps us guide patients' expectations based on their sound-field audiometric findings, either on a headband or on the audiogram taken when the BAHA is first fitted.