Introduction
It is increasingly recognised that experiences and health in one stage of the life course can influence health outcomes in another stage. The ‘developmental origins of health and disease’ (DOHaD) framework posits that experiences in early life can result in permanent physiological changes that impact health factors later in life.Reference Gluckman, Hanson and Buklijas1 Low birth weight has been associated with increased adult blood pressure, increased glucose intolerance and increased risk of coronary heart disease.Reference Eriksson, Forsen, Tuomilehto, Osmond and Barker2–Reference Norris, Osmond and Gigante4 Similarly, rapid growth in childhood has been associated with increased risk of coronary heart disease and higher fat-free soft tissue mass in adulthood, and growth patterns in childhood have been associated with timing and tempo of puberty.Reference Eriksson, Forsen, Tuomilehto, Osmond and Barker2,Reference Lundeen, Norris and Martorell5,Reference Prioreschi, Munthali and Kagura6
Beyond early childhood, considerable evidence suggests that increased adiposity throughout childhood and adolescence has adverse impacts on a range of adult health outcomes, including obesity, blood pressure and risk of coronary heart disease.Reference Lawlor and Smith3,Reference Munthali, Kagura, Lombard and Norris7–Reference Reilly and Kelly10 There is also evidence that pubertal factors influence adult health, as early adrenarche was found to be associated with higher risks of components of metabolic syndrome, such as type 2 diabetes, obesity and cardiovascular disease, especially among females.Reference Golub, Collman and Foster11
While links have been illustrated between early-life and childhood growth and individual health outcomes, less is known about potential links to general measures of health. Contemporaneous with the development of the DOHaD framework, a composite measure of physiological stress known as allostatic load (AL) was being developed. As originally formulated, elevated AL results from chronic heightened responses of neural and neuroendocrine systems to perceived stresses, which then results in downstream effects on other biological systems, such as cardiometabolic and immune systems, and eventually adverse disease outcomes.Reference McEwen and Stellar12 By combining measures of cardiovascular, metabolic, neuroendocrine and immune health, a composite measure of physiological health can be calculated. Higher AL scores have been associated with adverse health outcomes in older adults (70+), as well as increased mortality among middle-aged adults.Reference Castagne, Gares and Karimi13–Reference Seeman, Singer, Rowe, Horwitz and McEwen18
A recent review summarised evidence for a consistent association between lower socio-economic status (SES) and higher AL in adults, findings that have since been replicated in adolescents.Reference Dowd, Simanek and Aiello19,Reference Rainisch and Upchurch20 In women, early menarche has been shown to be associated with higher AL in early adulthood.Reference Allsworth, Weitzen and Boardman21 In a Danish cohort, birth weight was found to be inversely associated with midlife AL in females, though that study did not examine growth patterns in early life.Reference Christensen, Flensborg-Madsen, Garde, Hansen, Masters Pedersen and Mortensen22 However, these findings all come from developed, upper-income countries, and little to no research in this area has been conducted in low- or middle-income countries, where the context, particularly in early life, may be very different from upper-income countries. The aim of this study is to extend current research on links between early-life, childhood, and adolescent growth and individual health outcomes in adulthood to investigate associations with a comprehensive measure of health. In the current analysis, we examine the association between growth in early life and AL at age 22 years, as well as potential attenuation of that relationship when considering adolescent body mass index (BMI) or pubertal development trajectory, using data from the Birth to Twenty Plus (Bt20+) cohort in South Africa.
Methods
Study population
Data for this analysis come from the Bt20+ study, a birth cohort consisting of 3273 singleton infants born in the Soweto-Johannesburg area of South Africa between April and June 1990. A detailed description of the cohort, including recruitment and selection criteria, has been published previously.Reference Richter, Norris, Pettifor, Yach and Cameron23 Most of the cohort resides in an urban, relatively poor community, and absolute attrition is relatively low at approximately 35% by age 28 years, though not all participants attended each study wave. Ethics approval for this analysis came from the University of the Witwatersrand Human Research Ethics Committee (Certificate #M180933) and participants or their caregivers, as appropriate, provided written informed consent at each study visit.
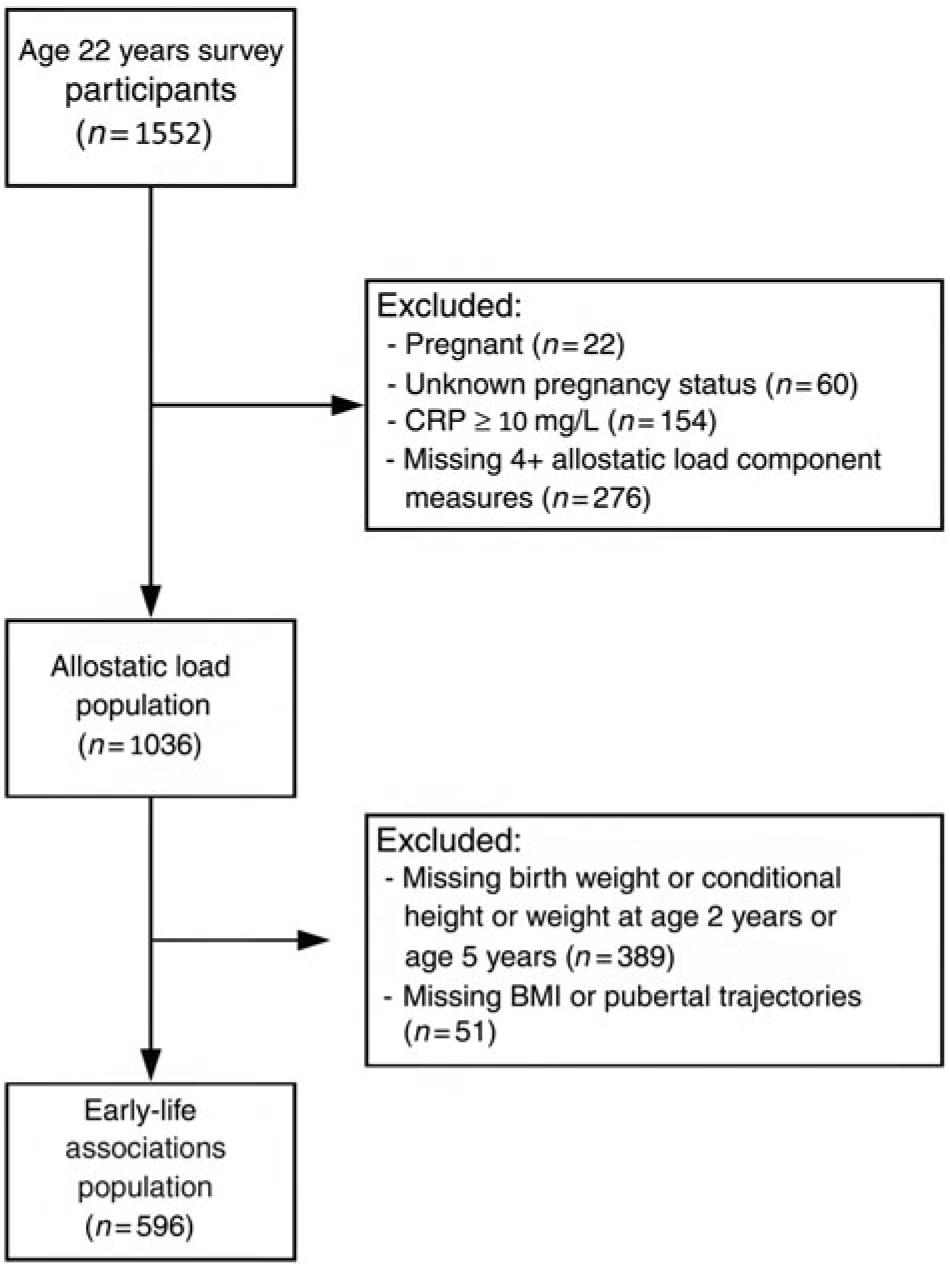
Only participants who returned for the age 22 years study visit were eligible for our analysis (n = 1552) (Fig. 1). We excluded pregnant females (n = 22) and those females whose pregnancy status was not recorded at the time of the age 22 years study visit (n = 60). For calculations of AL, we excluded participants with C-reactive protein (CRP) values ≥10 mg/L (n = 154), as such concentrations are indicative of an acute infection. Additionally, we excluded participants missing data on more than three AL components (n = 276), resulting in a final sample for AL of 1036 participants. We excluded participants missing any early-life growth measures (n = 437) or BMI/pubertal trajectory values (n = 51) for analyses involving those exposures, resulting in a final sample of 596 participants for those analyses.
CONSORT flow diagram of sample size.

Early-life exposures
Birth weight was abstracted from birth notification records. Child height to the nearest 0.1 cm and weight to the nearest 0.1 kg were recorded by trained research staff using a wall-mounted stadiometer (Holtain, UK) and digital scale, respectively, at the age 2 years and age 5 years study visits. Conditional height is calculated as a residual from a sex-specific linear model regressing current height on prior values of height and weight, and conditional weight is calculated as a residual from a sex-specific linear model regressing current weight on current height and prior values of height and weight. Observed height and weight were represented as Fisher–Yates transformed height-for-age and weight-for-age Z-scores, respectively. We calculated conditional height and weight at age 2 years and 5 years.Reference Adair, Fall and Osmond24 Using conditional height and weight measures, we can isolate growth that is faster or slower than would be expected in a particular period given a child’s earlier growth patterns and the overall growth pattern of the cohort. In essence, these variables are indicative of greater linear growth independent of prior linear growth and weight gain and greater weight gain independent of prior weight gain as well as prior linear growth and current height.
Later childhood/adolescent exposures
Sex-specific trajectories of BMI from age 5 years to 18 years were previously computed using latent class growth mixture modelling for participants with at least two BMI measurements between age 5 years and 18 years (Supplemental Fig. S1). Three trajectories were identified for males (1 – normal weight; 2 – early-onset overweight to normal; 3 – early-onset overweight to obese) and four trajectories were identified for females (1 – normal weight; 2 – early-onset obese to overweight; 3 – early-onset obese to morbidly obese; 4 – late-onset overweight).Reference Munthali, Kagura, Lombard and Norris7 Latent class growth analysis was previously used with serial Tanner sexual maturation scale measurements from age 9 years to 16 years to calculate sex-specific trajectories of pubertal development. These trajectories capture information regarding both the timing of pubertal onset and rate of progression through puberty. Three trajectories of pubic hair development were identified for both males and females, with four trajectories of breast development identified for females and four trajectories of genital development identified for males (Supplemental Fig. S2). For all trajectories, trajectory 1 represents participants with latest onset of puberty and slowest development, with increasing trajectory numbers representing successively earlier onset and faster development.Reference Lundeen, Norris and Martorell5
Outcome
We created an overall measure of AL from 11 health measures collected at the age 22 years study visit. Measures were selected to encompass multiple physiological systems and the choice of which measures to include was based on literature examples and data availability.Reference Robertson, Beveridge and Bromley16,Reference Rainisch and Upchurch20,Reference Allsworth, Weitzen and Boardman21,Reference Chyu and Upchurch25–Reference Seeman, Merkin, Crimmins, Koretz, Charette and Karlamangla29 We used systolic blood pressure (SBP), diastolic blood pressure (DBP) and resting heart rate as measures of cardiovascular health. Markers of metabolic health included BMI, waist-to-hip ratio (WHR), total cholesterol, high-density lipoprotein (HDL), triglycerides and fasting blood glucose. CRP was included as a marker of inflammation. Total score from the 28-item General Health Questionnaire (GHQ-28), in which patients assess changes in their mood, feelings and behaviours over the last 4 weeks, was included as a marker of psychological distress.Reference Goldberg, Gater and Sartorius30
Height, weight, waist size, hip size and resting heart rate were recorded by trained research staff during the age 22 years study visit, with a coefficient of variation of < 1% for repeated measures. Blood pressure was measured in triplicate with participants in a seated position using an Omron M6 (Kyoto, Japan), with the mean of the second and third measurements used for analysis. Total cholesterol, HDL, triglycerides, fasting blood glucose and CRP were measured from venous blood draws collected following an overnight fast. Plasma glucose was measured by an autoanalyser using standard enzymatic methods, blood lipids were measured by standard enzymatic methods and CRP concentrations were measured using a full-range CRP immunoturbidimetric assay (Randox Laboratories, South Africa). Quality was checked by control samples and the coefficient of variation for lab measures was <2%.
To create the AL index, we created empirical cut points for each health measure based on the sample distribution. For all measures except HDL, an observed level above the 75th percentile was regarded as high risk, and for HDL an observed level below the 25th percentile was regarded as high risk. A dichotomous indicator was created for each health measure, with a value of 1 assigned for high-risk values and a value of 0 assigned to low-risk values. The indicator variables were summed to create an overall measure of AL for each participant, ranging from 0 to 11. This summary method of calculating AL is used most frequently in the literature, and factor analyses have supported the use of a single, combined measure of AL.Reference Beckie31–Reference McCaffery, Marsland, Strohacker, Muldoon and Manuck34 Based on the distribution of the resulting AL measure, we created an indicator for ‘high AL’ using the same 75th percentile level used to classify individual health measures as high risk.
Confounders
Confounders were identified a priori based on literature-driven hypothesized relationships with both the exposure variables and the AL outcome. Gestational age, maternal age and education, parity, and household asset ownership from age 0 to 2 years (as a proxy for socio-economic status), all of which come from the original Bt20+ enrolment data, were included as confounders.
Missing data
Two hundred and sixty-five participants (26%) were missing data for one to three AL component measures, with the majority of those (239; 90%) missing a single measure. In order to include these participants in the analyses, missing values for these measures, along with missing confounder values, were imputed using multiple imputation by chained equations. Missing individual component measures, rather than the overall AL score, were imputed to utilise the observed values of the other AL component measures. Empirical cut points for each AL component, high-risk indicators and a summary measure of AL were calculated within each imputed dataset as described previously. Participants missing greater than three AL components were generally missing an entire suite of measures (e.g., all bloodwork-related measures) and were therefore excluded. Including missing confounders, 41% of participants had at least 1 value imputed, and we therefore imputed 50 datasets.Reference Graham, Olchowski and Gilreath35
For analyses of AL with early-life growth and adolescent BMI/pubertal trajectories, we excluded those participants missing any growth or trajectory measures.
Statistical analysis
We examined differences in the percentage of individuals with high-risk values for each AL component measure and the percentage of individual with high AL by sex using unadjusted pooled logistic regression across the imputed datasets. Differences in the distribution of AL score by sex were examined using unadjusted pooled Poisson regression. We examined the association between early-life growth measures and age 22 years AL score using sex-specific unadjusted and adjusted pooled Poisson regression. Potential attenuation of the association between early-life growth and age 22 years AL when BMI trajectories and/or pubertal trajectories were also modelled was assessed by adding each type of trajectory to the model both individually and in conjunction with the other trajectories and assessing any resulting change in association between early-life growth and age 22 years AL. In addition to examining the associations with the count AL measure, we examined the same associations with the indicator for high AL using sex-specific unadjusted and adjusted pooled logistic regression.
We utilised Poisson regression for the analyses with AL score because AL is a discrete, non-negative outcome. We explored the use of negative binomial models to allow for additional dispersion in the outcome variable but found no evidence of overdispersion and consequently used Poisson models.
Sensitivity analyses
To investigate potential selection effects, we compared demographics of participants included in our analyses to those who were originally enrolled in Bt20+ but were excluded from the current study. As GHQ-28 is not a measure of physiological health and has not been included in previous characterisations of AL, we compared our results to a calculation of AL that did not include GHQ-28 as a component measure. We also calculated a version of AL excluding BMI as a component measure in order to investigate if any potential associations with overall AL were a result of early-life and adolescent body size being correlated with young adult body size. In addition to the sex-specific analyses, we ran pooled analyses controlling for sex to investigate the effect of the larger sample size on variance in the model estimates. All analyses were conducted using R version 3.5.2, with multiple imputation by chained equations done using the ‘mice’ package.36,Reference van Buuren and Groothuis-Oudshoorn37
Results
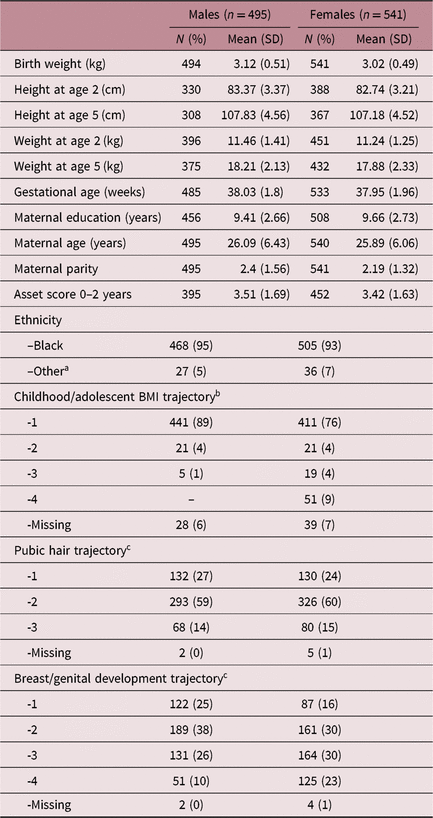
Early-life anthropometric data, maternal and household characteristics, and pubertal trajectory memberships for the included sample are displayed in Table 1. Most participants, especially among males, are in BMI trajectory 1, the ‘normal weight’ trajectory for both sexes, while there was more variation in membership in the pubertal trajectories.
Early-life anthropometric measures and maternal/household characteristics by sex, Birth to Twenty Plus cohort (n = 1036)

a ‘Other’ includes White, Coloured and Indian.
b BMI trajectory definitions: 1 – normal weight; 2 – early-onset overweight to normal weight (males) or early-onset obese to overweight (females); 3 – early-onset overweight to obese (males) or early-onset obese to morbidly obese (females); 4 – late-onset overweight (females only).
c Trajectory 1 represents children who started puberty late and progressed slowly, with higher trajectories having progressively earlier pubertal start and faster tempo.
Participants included in the AL calculation were more likely to be Black than excluded participants, which is a result of the increased emphasis on recruitment of Black participants at the age 22 years visit (Supplemental Table S1). Participants included in the analyses of associations between AL and early-life growth were more likely to have shorter gestational age, lower maternal parity, lower maternal age and higher asset score at age 0–2 years than participants who only had an AL score calculated; all factors were controlled for in the regression models (Supplemental Table S2). As BMI trajectories were only developed for Black participants, our analysis of associations between growth measures and age 22 years AL was restricted to Black participants.
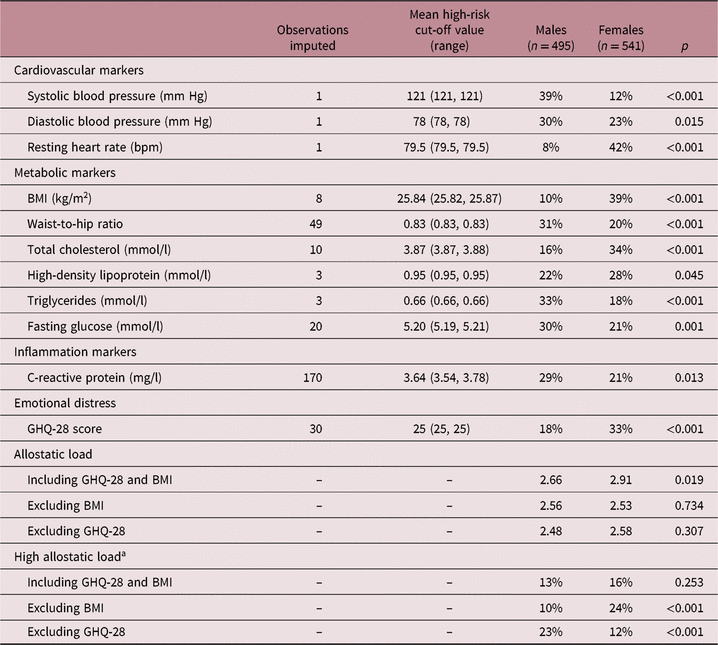
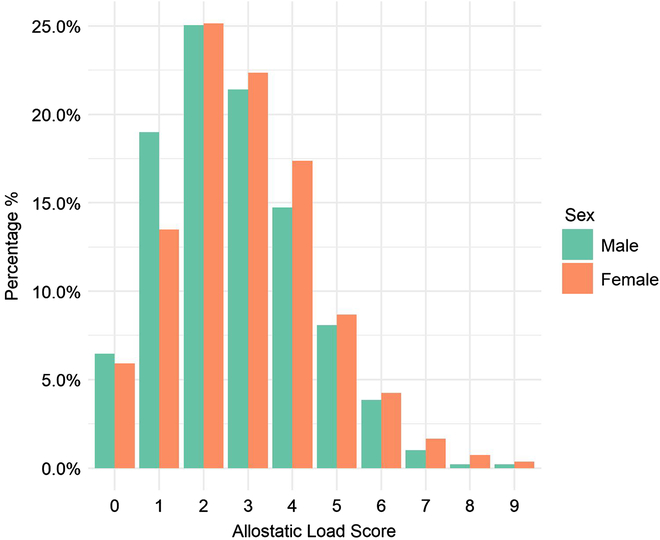
Table 2 shows the high-risk cut point values, the number of missing values imputed and the mean number of participants with elevated values of each AL component measure by sex. We found significant differences in the percentage of males and females with high-risk values for many component measures, with males being more likely to have high-risk values of SBP, DBP, WHR, triglycerides, fasting blood glucose and CRP and females more likely to have high-risk values of resting heart rate, BMI, total cholesterol, HDL and GHQ-28 score. When including GHQ-28 in the calculation of the summary AL score, females had a higher average AL score (2.91) than males (2.66), though this difference did not remain when excluding either GHQ-28 or BMI from the AL score calculation. There were no differences in the percentages of males and females with high AL when including GHQ-28. Males were more likely to be classified as high AL when GHQ-28 was excluded and females were more likely to be classified as high AL when BMI was excluded, both as a result of the change in distribution of AL scores. The distribution of AL scores by sex in a single imputed dataset is shown in Fig. 2, and distributions across the remaining imputed datasets were qualitatively similar.
Descriptive statistics of allostatic load component measures and summary values by sex, including number of observations imputed for each measure, the mean and range of high-risk cut-off value, the mean percentage of participants with component measure values in the high-risk quartile, and the mean allostatic load score, all calculated across imputations. P-values were calculated using pooled logistic regression (component measures and high allostatic load) and pooled Poisson regression (allostatic load score)

a High allostatic load is defined as a score above the 75th percentile. Cut-off values for scores including GHQ-28 and BMI were >4 for both males and females, >4 for males and >3 for females for scores excluding BMI, and >3 for males and >4 for females for scores excluding GHQ-28.
Percentage distribution of calculated age 22 years allostatic load score in the first imputation by sex, Birth to Twenty Plus cohort (n = 1036).

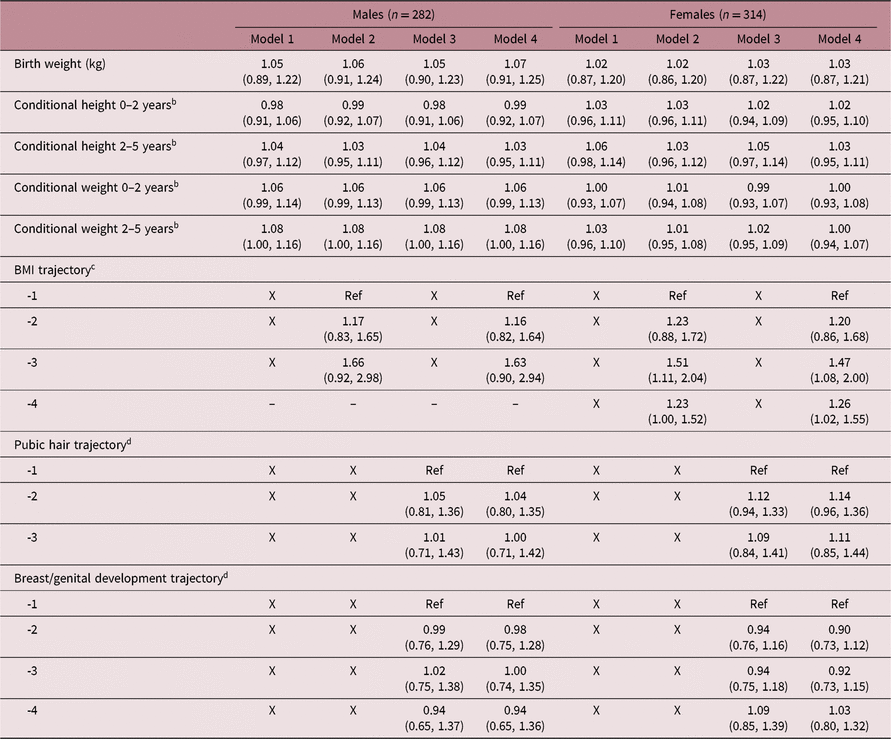
There was no consistent association between any early-life growth measure and AL at age 22 years in males or females in the adjusted analyses (Table 3). Unadjusted results are presented in Supplemental Table S3. Conditional weight gain from age 2 to 5 years appeared marginally associated with age 22 years AL in males but did not reach statistical significance. We found no significant associations between either BMI trajectory or pubertal development trajectory and age 22 years AL among males when controlling for early-life growth, while among females, BMI trajectories 3 and 4 were significantly associated with increased age 22 years AL compared to the normal BMI trajectory (Table 3, Models 2–4). These trajectories correspond to ‘early onset obese to morbidly obese’ (trajectory 3) and ‘late onset overweight’ (trajectory 4). When pooling males and females together and adjusting for sex, there remained no association between any early-life growth measure and age 22 years AL (Supplemental Table S4). Associations with the versions of AL that excluded GHQ-28 and BMI as component measures were qualitatively similar to the main results (Supplemental Tables S5 and S6).
Associations of age 22 years allostatic load with early-life growth as potentially mediated by childhood/adolescent body mass index and adolescent pubertal trajectories in the Birth to Twenty Plus cohort (n = 596). Values displayed are adjusted risk ratios (95% CI) estimated by pooled Poisson regressiona

a All models adjusted for gestational age, maternal age, maternal years of education, parity and age 0–2 years physical asset score.
b Coefficients for conditional values represent the adjusted risk ratio for a one standard deviation increase in the given residual value.
c BMI trajectory definitions: 1 – normal weight; 2 – early-onset overweight to normal weight (males) or early-onset obese to overweight (females); 3 – early-onset overweight to obese (males) or early-onset obese to morbidly obese (females); 4 – late-onset overweight (females only).
d Trajectory 1 represents children who started puberty late and progressed slowly, with higher numbered trajectories having progressively earlier pubertal start and faster tempo.
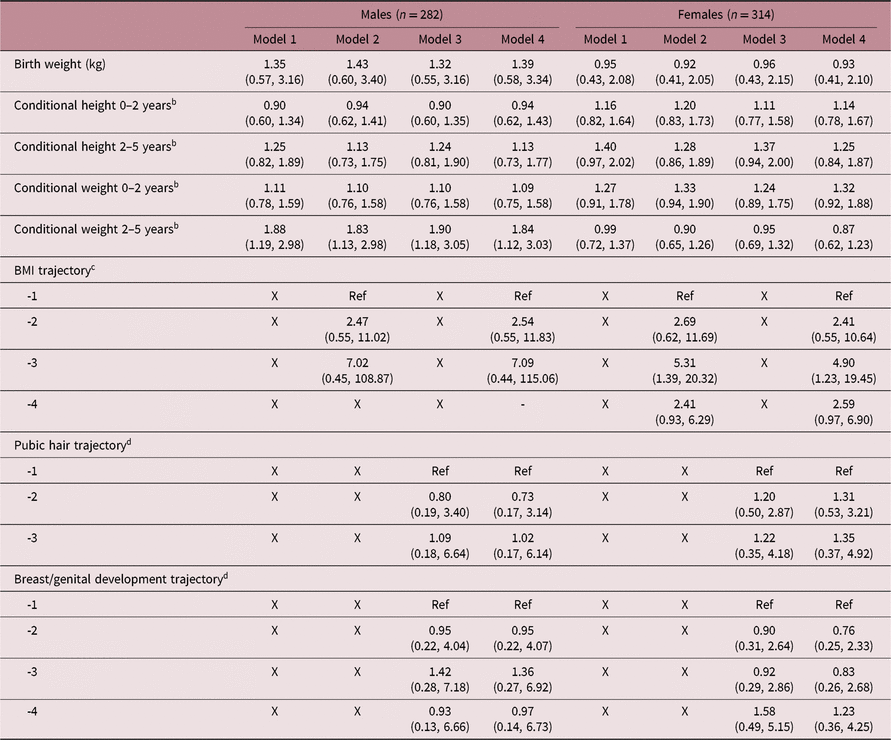
Among males, higher conditional change in weight from age 2 to 5 years was significantly associated with greater odds of high AL at age 22 years, and this relationship was not attenuated when either the BMI or pubertal trajectories were included in the model (Table 4). Among females, no early-life growth measures were associated with high AL at age 22 years, though membership in BMI trajectory 3 (‘early onset obese to morbidly obese’) was consistently associated with higher odds of high AL at age 22 years. These results were similar in unadjusted models and in the models using the version of AL excluding BMI (Supplemental Tables S7 and S8). When considering the version of AL excluding GHQ-28, conditional weight gain from age 2 to 5 years remained associated with high AL in males and conditional height gain from age 2 to 5 years was associated with high AL in females, with along with attenuation of the association when BMI trajectories are included in the model (Supplemental Table S9). When pooling males and females together and adjusting for sex, only the association of BMI trajectory 3 with high AL remained significant (Supplemental Table S10).
Sex-specific associations of high (top 25%) age 22 years allostatic load with early-life growth as potentially mediated by childhood/adolescent body mass index and adolescent pubertal trajectories in the Birth to Twenty Plus cohort (n = 596). Values displayed are adjusted odds ratios (95% CI) estimated by pooled logistic regressiona

a All models adjusted for gestational age, maternal age, maternal years of education, parity and age 0–2 years physical asset score.
b Coefficients for conditional values represent the adjusted risk ratio for a one standard deviation increase in the given residual value.
c BMI trajectory definitions: 1 – normal weight; 2 – early-onset overweight to normal weight (males) or early-onset obese to overweight (females); 3 – early-onset overweight to obese (males) or early-onset obese to morbidly obese (females); 4 – late-onset overweight (females only).
d Trajectory 1 represents children who started puberty late and progressed slowly, with higher numbered trajectories having progressively earlier pubertal start and faster tempo.
When analysed individually, all components of the AL measure were positively associated with the composite score, with the exception of HDL which was inversely associated with the composite score (Supplemental Table S11), though none of the covariates adjusted for were individually associated with the composite AL score (Supplemental Table S12).
Discussion
Our study profiled the varying components of AL among a cohort of South African young adults and illustrated hypothesised relationships between AL and growth earlier in life. We found significant differences between males and females with regard to the components of the AL score, though sex differences in the distributions of the final AL score were small. Increased weight gain from age 2 to 5 years were consistently associated with greater odds of high (top 25%) AL among males, with evidence for an association between increased height gain from age 2 to 5 years and high AL among females mediated by BMI trajectory when considering only the physical components of AL score. Unhealthy adolescent BMI trajectories were consistently associated with worse AL outcomes.
The idea of a comprehensive measure of physiological health is an appealing one. AL aims to incorporate measures related to multiple body systems and combine them into a single quantity that reflects cumulative ‘wear and tear’ on the body.Reference McEwen and Stellar12,Reference Seeman, Singer, Rowe, Horwitz and McEwen18 Such a composite risk factor sacrifices information on particular indicators, though previous research has illustrated the predictive value of AL for other morbidities and mortality in middle-aged and older adults.Reference Castagne, Gares and Karimi13–Reference Seeman, Singer, Rowe, Horwitz and McEwen18 While we found significant differences between the proportion of males and females with ‘high-risk’ values for most AL components, we found only minimal differences in the distribution of AL and no sex differences in the percentage of participants with high AL. Consistent with the AL framework, our results suggest that while males and females in our study population had similar ‘wear and tear,’ this was expressed via different indicators for each sex, and a focus on any particular indicator might give an incomplete picture of overall health. Further research will help elucidate whether AL in early adulthood will have similar predictive value for future adult health and morbidity.
Among early-life measures, only increased conditional weight gain from age 2 to 5 years among males was associated with greater odds of high AL at age 22 years. When GHQ-28 was excluded from the calculation of AL, we found an association between increased conditional height gain from age 2 to 5 years among females and greater odds of high AL, with evidence that this association was attenuated when including unhealthy childhood/adolescent BMI trajectories. These findings were supported in the analyses of continuous AL score, though the results did not reach the level of statistical significance. Previous research illustrated links between measures of early-life growth and individual components of our AL measure. Specifically, birth weight, early height growth and early BMI growth were each associated with higher blood pressure in adulthood, and greater weight gain throughout childhood has been associated with greater adult adiposity.Reference Lawlor and Smith3,Reference Sabo, Wang, Deng, Sabo and Sun38,Reference Wells, Chomtho and Fewtrell39 Studies in a series of low and middle-income countries (LMICs), including South Africa, illustrated associations between both lower birth weight and increased weight gain after age 2 years with higher adult glucose intolerance.Reference Norris, Osmond and Gigante4 Our study suggests that while increased growth from age 2 to 5 years may be associated with greater risk of multiple morbidities as expressed through high AL score, there is not a consistent association between early growth (0–2 years) and increased morbidity in early adulthood.
In adolescence, we found consistent associations between BMI trajectories corresponding to ‘early onset overweight/obese to obese/morbidly obese’ and ‘late onset obese’ and poor AL outcomes at age 22 years. These associations remained even when BMI at age 22 years was excluded from the calculation of age 22 years AL, indicating that the association between BMI trajectory and age 22 years AL is not solely driven by associations in body size across time. These results are consistent with research that has demonstrated associations between higher BMI in childhood and adolescence and increased risk of coronary heart disease, obesity, high blood pressure, diabetes and premature mortality.Reference Lawlor and Smith3,Reference Owen, Whincup and Orfei8–Reference Reilly and Kelly10
Strengths of our current research include the longitudinal nature of the data, allowing us to use measures collected in childhood and adolescence and directly link those with young adult measures in the same individual. Retention in the Bt20+ cohort is high from year to year, providing us with a relatively large sample. Unlike much of the existing literature on AL in early or middle adulthood, Bt20+ is in an LMIC environment. Using multiple imputation, we were able to utilise partial data from hundreds of participants that would have been discarded in a complete case analysis. As the cohort is still active, later rounds of data collection will allow for examinations of associations of early-life growth with AL later in life or examinations of how AL in early adulthood may predict future health outcomes.
Our study is not without limitations. Our analysis uses only a subsample of the original Bt20+ cohort, and we found significant differences in early-life economic status, maternal age, parity and gestational age between those included in the analysis and those excluded. While we attempted to control for these differences by including these values as covariates in our regression models, these differences make it more challenging to generalise from our results to the general population of Soweto-Johannesburg. We calculated AL using data from the age 22 years study wave, which is early in adulthood and potentially prior to the occurrence of the adverse health outcomes that have been documented in other DOHaD studies. However, the empirical high-risk quartile cut points for multiple components were close to their relevant clinical values, indicating that morbidities for at least some AL components are already present in our study population. The summary AL index used equally weights all components, which is unlikely to accurately reflect contributions of the different AL components to health. The summary index is a commonly used approach to calculating AL in the literature, and earlier research in older adults examining alternative AL calculation methods such as factor analysis found that simple summations performed comparably to more complex methods.Reference Seeman, Singer, Rowe, Horwitz and McEwen18 Though beyond the scope of this analysis, future work can explore alternative calculations of AL in this and other younger populations. Finally, there remains the possibility of unadjusted confounding, especially at later time points, and therefore we did not attempt to explicitly model causal relationships. Future efforts could more explicitly model causal pathways and formal mediation using approaches such as path analysis, inverse probability weighting, or g-methods.
Using prospectively collected data from a longitudinal birth cohort in urban South Africa, we found similar levels of AL in males and females at age 22 years, though the components contributing to the AL score varied by sex. While AL may be a useful tool to identify young adults at risk of future health issues, further longitudinal research is needed to determine any links between young adult AL and future health. Unhealthy childhood and adolescent BMI trajectories were associated with both increased continuous AL scores and increased likelihood of having an AL load in the top quartile of values. This highlights the potential early signs of continuing physiological risk due to higher adiposity in childhood and adolescence. While earlier DOHaD literature has illustrated relationships between aspects of early-life growth and several components of our AL measure, we only found consistent associations between conditional weight gain from age 2 to 5 years and high AL among males. These results contrast with earlier research in high-income contexts showing associations between both birth weight and early menarche with early and mid-adulthood AL, and further research can help illustrate potential reasons for these discrepancies. Our study expands the DOHaD literature by going beyond individual health markers to consider a comprehensive measure of physiological health and suggests that early-life growth is not highly associated with such an overall measure of health, though increasing BMI later in childhood and adolescence is. Future work can expand on our research by considering measures of AL at later ages and investigating associations between young adult AL and later adverse health events.
Supplementary material
To view supplementary material for this article, please visit https://doi.org/10.1017/S2040174419000667
Acknowledgements
We would like to thank the Birth to Twenty Plus participants and parents for their continued participation, as well as the Birth to Twenty Plus study staff.
Financial support
This work was funded by the Healthy Life Trajectories Initiative through the South Africa Medical Research Council grant to SN. SN is also supported by the DST-NRF Centre of Excellence in Human Development at the University of the Witwatersrand, Johannesburg, South Africa.
Conflicts of interest
None.
Ethical standards
The authors assert that all procedures contributing to this work comply with the ethical standards of the relevant national guidelines on human experimentation and with the Helsinki Declaration of 1975, as revised in 2008, and have been approved by the University of the Witwatersrand Human Research Ethics Committee (Certificate #M180933).