


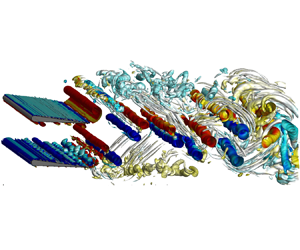





1. Introduction
Exploring the fundamental features of vortex dynamics and wake interactions is important in aviation and marine engineering sectors. Understanding of this complex unsteady fluid dynamics is crucial for enhancement of safety and productivity of air transportation (Spalart Reference Spalart1998), development of fish-like autonomous vehicles with high efficiency (Triantafyllou, Triantafyllou & Yue Reference Triantafyllou, Triantafyllou and Yue2000) and designing agile and stealth propulsion systems (Smits Reference Smits2019). These vital aspirations have prompted theoretical, experimental and numerical studies that explore the underlying flow physics. To this end, the dynamics and instabilities of counter-rotating and co-rotating vortex pairs observed in such applications constitute the basis of many fundamental studies. For example, Meunier & Leweke (Reference Meunier and Leweke2005) identify co-rotating vortices in the near wake of flapped aircraft wings in landing configuration, whereas Triantafyllou & Triantafyllou (Reference Triantafyllou and Triantafyllou1995) observed that fish employ tail-flapping to generate counter-rotating vortex pairs to facilitate their locomotion. The co-rotating vortices tend to merge into a single vortex unless their separation distance is more than a certain threshold. The underlying mechanism behind the merger was elucidated by Cerretelli & Williamson (Reference Cerretelli and Williamson2003), which bears resemblance to the ‘axisymmetrization’ principle proposed by Melander, McWilliams & Zabusky (Reference Melander, McWilliams and Zabusky1987) for elliptic vortices. While the merger predominantly occurs in a two-dimensional (2-D) plane, three-dimensionality exerts notable effects on the process, including early merging, quick expansion of the core radius and a decrease in the maximum swirl velocity of the final vortex (Meunier, Le Dizes & Leweke Reference Meunier, Le Dizes and Leweke2005). Moreover, three-dimensional (3-D) instabilities can trigger the merging process at a greater separation distance that exceeds the critical limit allowed for merger of 2-D vortices (Bristol et al. Reference Bristol, Ortega, Marcus and Savas2004). This phenomenon arises when the short-wavelength elliptic instability, developing on one of the vortex cores, steers the peripheral vorticity towards the other one and creates a vorticity bridge, connecting the cores. On the other hand, experiments conducted to examine the characteristics of the elliptic instability in pairs of counter-rotating vortices (Leweke & Williamson Reference Leweke and Williamson1998) revealed a distinct phase relationship between disturbances on the vortex cores. It indicates that the elliptic instability evolves in a coupled or ‘cooperative’ manner. Ortega, Bristol & Savas (Reference Ortega, Bristol and Savas2003) delved into the dynamics of initially 2-D, counter-rotating vortex pairs with unequal strengths to demonstrate that instabilities occurring on the weaker vortex led to the formation of loops. These encircled the stronger vortex and eventually transitioned into rings. They further noticed that the 2-D to 3-D transition unfolded considerably earlier than the onset of visible deformations in an equal-strength counter-rotating vortex pair under similar flow conditions (Ortega et al. Reference Ortega, Bristol and Savas2003). A vortex in proximity to the ground effectively creates a counter-rotating vortex pair with its mirror image, rendering it susceptible to both short- and long-wavelength instabilities (Benton & Bons Reference Benton and Bons2014). Modelling the ground, whether as a viscous boundary (employing a no-slip condition) or an inviscid boundary (employing slip with no-penetration condition), fundamentally alters the characteristics of the instabilities (Rabinovitch, Brion & Blanquart Reference Rabinovitch, Brion and Blanquart2012). Although the ground effect due to a stationary wall is well studied (Harvey & Perry Reference Harvey and Perry1971; Peace & Riley Reference Peace and Riley1983), the influence of a moving boundary requires more attention. Therefore, this study aims to investigate the foil proximity effect due to oscillating bodies by examining the nature of 3-D instabilities around two pitching foils in side-by-side (parallel) configurations.
An oscillating foil, representing a simple model for fish-like swimming or insect flight, generates distinct vortex patterns in the wake. With an increase in oscillation amplitude, these patterns undergo a sequential transformation through the following stages: Bénard–von Kármán (BvK) vortex street, reverse BvK vortex street and deflected (asymmetric) vortex street (Godoy-Diana, Aider & Wesfreid Reference Godoy-Diana, Aider and Wesfreid2008; Khalid et al. Reference Khalid, Wang, Dong and Liu2020). An additional increase in amplitude initiates 3-D instabilities within the wake, coinciding with a peak in efficiency (Deng et al. Reference Deng, Sun, Teng, Pan and Shao2016). Three-dimensionality in the wake of foils undergoing pure pitching, pure heaving and combined motions was explored by Zurman-Nasution, Ganapathisubramani & Weymouth (Reference Zurman-Nasution, Ganapathisubramani and Weymouth2020). They revealed that the transition at larger flapping amplitudes occurred when the circulation of leading-edge vortices (LEVs) exceeded a universal threshold. Thus, they overcome the damping effect of the viscous dissipation, which consequently resulted in the disintegration of vortices. In a more recent study (Verma, Khalid & Hemmati Reference Verma, Khalid and Hemmati2023), the link between the kinematics of the foils and 3-D characteristics of the wake was investigated by covering a wide range of governing parameters. Verma et al. (Reference Verma, Khalid and Hemmati2023) identified two distinct mechanisms governing the growth of secondary structures across their parametric space, as well as two principal pathways, characterizing the transition between these mechanisms. The first mechanism attributes the source of spanwise instability on the primary LEV to a strong secondary LEV, while the second involves the interaction between the primary LEV and the counter-rotating trailing-edge vortex (TEV). These studies suggest a distinct relationship between kinematics and 3-D instabilities of vortex structures of solitary oscillating foils. However, the impact of kinematic parameters for parallel foils, including the gap and phase difference between the foils, remains unexplored.
Generation of LEVs by flapping insect wings along with their remarkable ability to maintain these vortices attached on the wing surface, even at extreme angles of attack, plays a pivotal role in the production of unsteady aerodynamic forces. These characteristics allow flying insects to attain superior hovering and manoeuvring capabilities (Ellington et al. Reference Ellington, Van Den Berg, Willmott and Thomas1996; Sane Reference Sane2003). Chiereghin et al. (Reference Chiereghin, Bull, Cleaver and Gursul2020) experimentally examined 3-D features of LEVs on high-aspect-ratio heaving swept wings, identifying a spanwise instability in the LEV filament. Investigating the phenomenon quantitatively and qualitatively, Verma & Hemmati (Reference Verma and Hemmati2021) established a connection between spanwise undulation of the LEV and the elliptic instability of vortex pairs in the wake of foils, with simultaneous heaving and pitching motions. Their research yielded valuable insights into the correlation between spanwise instability and the formation of streamwise vortical structures. Utilizing experiments, numerical simulations and stability analysis, Son et al. (Reference Son, Gao, Gursul, Cantwell, Wang and Sherwin2022) later elucidated that instabilities on LEV filaments arose from distinct sources in heaving foils and high-aspect-ratio wings. In the case of foils, their observations corroborated with the findings of Verma & Hemmati (Reference Verma and Hemmati2021), where LEVs exhibited spanwise undulations while forming a pair with a counter-rotating vortex. It can be either a TEV or a secondary LEV that rolls up from the surface of the foil. Conversely, for high-aspect-ratio wings, the leg of the LEV remains attached to the wing surface, leading to the formation of helical waves on the leg. The reattachment of LEVs enhances the propulsion of aquatic swimmers as well (Borazjani & Daghooghi Reference Borazjani and Daghooghi2013; Khalid et al. Reference Khalid, Wang, Akhtar, Dong, Liu and Hemmati2021), which indicates the important role played by the LEV and its dynamics around parallel oscillating foils that emulate a two-fish school.
The presence of a solid boundary near oscillating foils leads to substantial effects on vortex dynamics around them (Quinn et al. Reference Quinn, Moored, Dewey and Smits2014) and their propulsive performance characteristics (Blevins & Lauder Reference Blevins and Lauder2013; Mivehchi et al. Reference Mivehchi, Zhong, Kurt, Quinn and Moored2021). Quinn et al. (Reference Quinn, Moored, Dewey and Smits2014) identified two distinct vortex patterns, emerging in the wake of pitching foils near the ground, based on the separation distance from the wall boundary. For moderate gap distances, vortices shed by the foil form pairs that advect away from the wall at an angle. Conversely, for extreme foil–wall distances, vortex pairs curve back towards the wall. The flow around oscillating foils near a solid boundary is akin to that of a pair of parallel foils undergoing out-of-phase oscillations at low frequencies. It can be correlated with the method of images discussed by Dewey et al. (Reference Dewey, Quinn, Boschitsch and Smits2014). Previously, we elucidated the key disparities between 2-D wake topologies of in-phase and out-of-phase pitching parallel foils (Gungor & Hemmati Reference Gungor and Hemmati2020), followed by a comprehensive classification of their vortex patterns (Gungor, Khalid & Hemmati Reference Gungor, Khalid and Hemmati2022a). Those studies, however, overlooked 3-D characteristics in the flow instabilities. Thus, the objective of this study is to examine 3-D flow dynamics and the spanwise instabilities that emerge behind parallel oscillating foils in close proximity, inspired by schooling fish. We introduce and explain the nature of a newly identified shear-layer instability due to the foil proximity effect, which constitutes the primary novelty of our work. Insights derived from this study are expected to inform the design of bio-inspired underwater locomotion systems that utilize multiple oscillating foils to achieve improved swimming stability.
2. Computational methodology
The flow around two pitching foils in a side-by-side configuration is simulated at a Reynolds number (Re) of  $8000$ by directly solving the Navier–Stokes equations. The Reynolds number is defined based on the chord length (
 $c$) as
 $Re= U_{\infty } c / \nu$, where
 $U_{\infty }$ is the free-stream flow velocity and
 $\nu$ is the kinematic viscosity of the fluid. The flow is observed to transition to full turbulence behind oscillatory propulsive systems at
 $Re = 8000$, with minimal transitional effects in the shear layer (Gazzola, Argentina & Mahadevan Reference Gazzola, Argentina and Mahadevan2014; Verma & Hemmati Reference Verma and Hemmati2021; Son et al. Reference Son, Gao, Gursul, Cantwell, Wang and Sherwin2022). Note that the experimental results of Zurman-Nasution et al. (Reference Zurman-Nasution, Ganapathisubramani and Weymouth2020) on the wake transition to three dimensions at
 $Re=5300$ remain valid, even when
 $Re$ is doubled. Here, the two foils, referred to as Foil 1 (bottom foil) and Foil 2 (top foil), have a semicircular leading edge with a radius of
 $0.05c$. The separation distance between these infinite-span teardrop foils is varied from
 $y^*=0.5c$ to
 $y^*=1.5c$ in increments of
 $0.25c$, as depicted in figure 1. They undergo pure pitching motion around the centre of their respective semicircular leading edges, where their kinematic profiles follow
 $\theta _1(t)=\theta _0\sin (2{\rm \pi} ft)$ and
 $\theta _2(t)=\theta _0\sin (2{\rm \pi} ft-\phi )$. Here,
 $\theta _0$ is the maximum pitching amplitude,
 $f$ is the pitching frequency,
 $t$ is time and
 $\phi$ is the phase difference between the foils. Both in-phase (
 $\phi =0$) and out-of-phase (
 $\phi ={\rm \pi}$) motions are considered for the amplitude-based Strouhal numbers (
 $St$) of
 $0.3$ and
 $0.5$, which yield optimal propulsion efficiency for oscillating foils (Anderson et al. Reference Anderson, Streitlien, Barrett and Triantafyllou1998) and aquatic animals (Rohr & Fish Reference Rohr and Fish2004; Eloy Reference Eloy2012; Ashraf et al. Reference Ashraf, Bradshaw, Ha, Halloy, Godoy-Diana and Thiria2017). Here, the Strouhal number is defined as
 $St={f}{A}/U_{\infty }$, where
 $A$ is the tip-to-tip oscillation amplitude for one foil. The present study employs a fixed pitching amplitude and free-stream velocity, resulting in a direct proportionality between the pitching frequency and
 $St$. In total, twenty 3-D numerical simulations have been conducted, encompassing five separation distances, two phase differences and two Strouhal numbers.
Dimensions of the computational domain with boundary conditions (not to scale). Here,  $y^*$ is the vertical separation distance between the foils.

In this study, the foil proximity effect refers to the influence on vortex dynamics around the foil due to the presence of a moving solid boundary. Particularly, this boundary represents a foil pitching in parallel to another identical foil, thereby constituting a side-by-side arrangement. The transition to three-dimensionality is not anticipated for the foils oscillating in isolation within the range of kinematic parameters examined in the current study, emphasizing the critical role of the foil proximity effect. Zurman-Nasution et al. (Reference Zurman-Nasution, Ganapathisubramani and Weymouth2020) demonstrated that pitching foils produced a 2-D wake for  $St \approx 0.3\unicode{x2013}0.6$. Deng et al. (Reference Deng, Sun, Teng, Pan and Shao2016) also estimated a comparable
 $St$ for the transition. Both studies also concurred on the observation that the wake of heaving foils exhibited a transition to three-dimensionality at a significantly lower
 $St$. Therefore, our present work addresses the primary question of how the foil proximity effect influences the vortex dynamics on the surfaces of the parallel foils.
In our previous work, we examined the wake patterns of primary vortices behind parallel foils over a range of Strouhal numbers for in-phase and out-of-phase oscillations (Gungor & Hemmati Reference Gungor and Hemmati2020), as well as intermediate phase differences (Gungor, Khalid & Hemmati Reference Gungor, Khalid and Hemmati2022b). At lower Strouhal numbers ( $St=0.15\unicode{x2013}0.3$), the wake quickly attains quasi-steady conditions, while a transitional phase occurs before the establishment of a quasi-steady wake at higher Strouhal numbers (
 $St=0.4\unicode{x2013}0.5$) (Gungor & Hemmati Reference Gungor and Hemmati2020; Gungor et al. Reference Gungor, Khalid and Hemmati2022a). However, the current study focuses solely on the flow after attaining quasi-steady conditions, disregarding transitional effects. In this context, the term ‘quasi-steady’ conditions denotes the absence of significant alterations in flow features between consecutive pitching cycles (Gungor & Hemmati Reference Gungor and Hemmati2020). In the present study, for simulations at lower Strouhal number (
 $St = 0.3$), approximately 10 pitching cycles are typically sufficient for the foils to reach quasi-steady conditions. At higher Strouhal number (
 $St=0.5$), the number of pitching cycles required to achieve a quasi-steady wake is influenced by the separation distance between the foils, as the transitional effects diminish more quickly with smaller foil gaps. Specifically, it takes
 $18$ cycles for in-phase pitching foils at
 $y^* = 0.5c$ and
 $50$ cycles at
 $y^* = 1.5c$. Similarly, out-of-phase pitching foils require
 $14$ and
 $30$ cycles to reach quasi-steady wake conditions at
 $y^* = 0.5c$ and
 $y^* = 1.5c$, respectively.
OpenFOAM, an open-source numerical platform that utilizes the finite-volume method, has been selected for directly solving the Navier–Stokes equations due to its robust capabilities in simulating similar flows (Senturk & Smits Reference Senturk and Smits2018; Bose, Gupta & Sarkar Reference Bose, Gupta and Sarkar2021; Verma & Hemmati Reference Verma and Hemmati2022). The pitching motion of the foils is modelled using the overset grid assembly (OGA) technique, which is integrated into the solver (Verma & Hemmati Reference Verma and Hemmati2020). The OGA functions by attaching an overset, where the motion is defined, to a stationary background grid, as illustrated in figure 2. The overPimpleDyMFoam solver, which integrates the functionality of OGA and PIMPLE algorithms, is employed to solve the governing equations. Second-order-accurate backward and central difference schemes are used for temporal and spatial discretizations, respectively.
Details of the OGA depicting (a) background grid and (b) overset grids.

The computational domain and mesh are generated following Verma & Hemmati (Reference Verma and Hemmati2023) and Verma et al. (Reference Verma, Khalid and Hemmati2023). The rectangular computational domain extends to  $20c$,
 $16c$ and
 ${\rm \pi} c$ in the streamwise (
 $x$), cross-flow (
 $y$) and spanwise (
 $z$) directions, respectively. The foils are positioned at a distance of
 $5c$ from the inlet. Neumann boundary conditions for both pressure and velocity are imposed at the outlet, a uniform velocity boundary condition (
 $u=U_\infty, v=w=0$) is applied at the inlet and slip boundary conditions are prescribed at the upper and lower boundaries of the domain. Surfaces of the foils are set to a no-slip wall boundary condition, while periodic boundary conditions are utilized at the side boundaries.
A fine, uniform grid is established close to the foils to adequately resolve the shear layers, with the element size gradually increasing with an expansion ratio of less than 1.03 towards the domain boundaries, as illustrated in figure 2. The spanwise length of the domain is partitioned into 64 equally spaced elements, consistent with literature on flow over infinite-span bodies (Najjar & Balachandar Reference Najjar and Balachandar1998; Hemmati, Wood & Martinuzzi Reference Hemmati, Wood and Martinuzzi2016, Reference Hemmati, Wood and Martinuzzi2018; Verma & Hemmati Reference Verma and Hemmati2021; Verma et al. Reference Verma, Khalid and Hemmati2023). Consequently, a non-homogeneous spatial grid, comprised of  $40\times 10^6$ hexahedral elements, is employed for the simulations. The dimensionless time-step size, set as
 $\Delta t^* = \Delta t U_{\infty }/c = 0.0005$, aligns with the standards established in previous numerical simulations of 3-D flow over pitching panels (Senturk & Smits Reference Senturk and Smits2018; Hemmati, Wood & Martinuzzi Reference Hemmati, Wood and Martinuzzi2019). The ratio of the grid size,
 $\varDelta = (\varDelta _x \times \varDelta _y \times \varDelta _z)^{1/3}$, to the Kolmogorov length scale,
 $\eta = (\nu ^3/\epsilon )^{0.25}$, is calculated following the literature (Yakhot, Liu & Nikitin Reference Yakhot, Liu and Nikitin2006; Saeedi, LePoudre & Wang Reference Saeedi, LePoudre and Wang2014; Zargar et al. Reference Zargar, Gungor, Tarokh and Hemmati2021) to ensure accurate capture of the smallest length scales. Here,
 $\epsilon$ denotes the rate of dissipation of turbulence kinetic energy, defined as
 $\epsilon = \nu \overline {(\partial u'_i /\partial x_j)(\partial u'_i /\partial x_j)}$, where
 $u'_i$ represents the fluctuating velocity. It is noteworthy that the grid size does not need to precisely match
 $\eta$, as studies have shown that an order of
 $\eta$, i.e.
 $\mathcal {O}(\eta )$, is sufficiently fine to capture most of the dissipation (Moin & Mahesh Reference Moin and Mahesh1998). Contours of the ratio of grid size to Kolmogorov length scale (
 $\varDelta /\eta$) in figure 3 confirm that the grid size remains consistently of the order of
 $\eta$, ensuring that the current numerical set-up adequately captures the turbulent flow characteristics around the foils.
Contours of ratio of the grid size to the Kolmogorov length scale ( $\varDelta / \eta$) at the mid-plane (
 $z/c=0$).

Sensitivity of numerical simulations to the spatial grid in the  $x$–
 $y$ plane is examined at
 $Re=8000$,
 $\phi =0$,
 $St=0.5$ and
 $y^*=0.5c$ by comparing a coarser grid (Grid 1) and a finer grid (Grid 3) in addition to the standard grid (Grid 2), whose details are explained in the previous paragraph. Grid 1 and Grid 3 have approximately
 $24\times 10^6$ and
 $50\times 10^6$ hexahedral elements, respectively. Unsteady variation of the coefficient of thrust,
 ${C_T}=F_x/0.5\rho s c U_{\infty }^2$, is plotted in figure 4(a) for two pitching cycles, exhibiting perfect agreement among the grids. Here,
 $F_x$ represents the thrust force generated by the foil,
 $\rho$ is the fluid density and
 $s$ is the span of the foil. Additionally, cycle-averaged streamwise velocity (
 $\tilde {u}/U_{\infty }$) profiles at the mid-plane (
 $z/c=0$) are compared in figures 4(b) and 4(c) at
 $x/c=2.5$ and
 $x/c=3.5$, respectively. These velocity profiles closely match, further indicating that Grid 2 has achieved spatial grid convergence necessary to resolve unsteady flow features.
Comparison of (a) unsteady variation of  $C_T$, and profiles of
 $\tilde {u}/U_{\infty }$ at the mid-plane (
 $z/c=0$) at (b)
 $x/c=2.5$ and (c)
 $x/c=3.5$ for three grids. Here,
 $P$ is the period of the pitching cycle.

Spanwise grid refinement is assessed at  $Re=8000$,
 $\phi ={\rm \pi}$,
 $St=0.5$ and
 $y^*=c$ by utilizing two additional configurations, Span 1 and Span 2, which have 48 and 56 elements across the span of the domain, respectively. These are compared with the standard configuration (Span 3) which has 64 elements. Errors in cycle-averaged streamwise velocities at
 $x/c=1.5$ and
 $y/c=0.5$ are calculated for Span 1 and Span 2 relative to Span 3, using the formulas
 $\varepsilon _{1-3} = (\tilde {u}_{Span 1} - \tilde {u}_{Span 3}) / \tilde {u}_{Span 3}$ and
 $\varepsilon _{2-3} = (\tilde {u}_{Span 2} - \tilde {u}_{Span 3}) / \tilde {u}_{Span 3}$, respectively. As depicted in figure 5, the comparison between the velocities of Span 2 and Span 3 shows minimal deviation, with a maximum
 $\varepsilon$ of
 $4\,\%$, suggesting that 64 elements in the spanwise direction are sufficient to accurately represent the flow physics.
Errors in  $\tilde {u}$ for Span 1 and Span 2 relative to Span 3 across the span of the domain at
 $x/c=1.5$ and
 $y/c=0.5$.

Simulations ran on high-power research computing infrastructure of Digital Research Alliance of Canada, utilizing 300–400 CPUs with a memory of 4 G per CPU over 900–2000 h of simulation time per case.
3. Results
Here, we examine 3-D flow features under quasi-steady conditions in the vicinity of in-phase and out-of-phase pitching parallel foils for a range of separation distances and Strouhal numbers. In this quest, we report a novel instability mechanism for the shear layers of developing TEVs. Flow instabilities are first identified and characterized, while quantitative links are presented between the growth of LEVs, roll-up of the shear layer and dislocation of vortex braids on the growing TEVs. This discussion provides a foundation to examine a unique fundamental association between foil proximity effect and vortex instabilities around parallel foils. Lastly, the influence of kinematics of the foils on the newly discovered mechanism is discussed.
3.1. Characterization of the instability
Iso-surfaces of the  $Q$-criterion, as originally defined by Hunt, Wray & Moin (Reference Hunt, Wray and Moin1988), are utilized to identify coherent flow structures in the wake. This technique is known for its robustness, and it is commonly employed in wake and flow analyses (Chiereghin et al. Reference Chiereghin, Bull, Cleaver and Gursul2020; Verma & Hemmati Reference Verma and Hemmati2021; Khalid et al. Reference Khalid, Wang, Akhtar, Dong, Liu and Hemmati2021). Figure 6 exhibits temporal progression of vortical structures around the foils during the downstroke phase of the pitching cycle, resulting in the formation of positively signed (counterclockwise-rotating) TEVs. Even at the initial stage of their formation in figure 6(a) (
 $t_1=11.375P$), spanwise undulations become apparent with the TEV growing on the bottom foil. This observation aligns with the presence of prominent oppositely signed vortical structures on the upper surface of the bottom foil, near the trailing edge. It is also consistent with our earlier study (Gungor et al. Reference Gungor, Khalid and Hemmati2022a), where we illustrated the impact of a side-by-side configuration on the LEV dynamics. For the in-phase pitching motion, neighbouring surfaces of the parallel foils (the upper surface of the bottom foil and the lower surface of the top foil) exhibit stronger LEVs compared with those of a single foil. This is evident from figure 11, which illustrates that the LEV in the case of close foil proximity (
 $y^*=0.5c$) is significantly stronger than in the case of large foil proximity (
 $y^*=1.5c$), with the latter being comparable to that of an isolated foil. The LEVs on the outer surfaces (the lower surface of the bottom foil and the upper surface of the top foil) are, however, observed to be comparatively weaker. This can explain the presence of undulations on the TEV of the bottom foil and their absence on the top foil, which coincides with the stronger vortical structures (secondary roll-ups) that more severely strain the TEVs. This is the underlying mechanism for spanwise instabilities (Kerswell Reference Kerswell2002). A quantitative assessment of the relationship between these vortical structures and the spanwise undulations, which is presented later in this section, provides additional support for this argument. As the foils complete their downstroke at
 $t_3=11.75P$ (figure 6b), shear layers in the form of braids of TEVs are fully detached from the foils. The perturbed shear layer exhibits highly 3-D features, leading to loss of coherence, which disintegrate into two parts (figure 6c). The upper part of the shear layer merges with the primary vortex tube, while the lower part is completely detached from the braid region and convected downstream (figure 6d). In contrast, the shear layer formed by the braid of the TEV at the top foil maintains its coherence and remains predominantly 2-D throughout the shedding process. It coincides with the absence of strong structures formed on the upper surface of the top foil. The mirror-image symmetric phenomenon occurs during the upstroke for the consecutive (clockwise-rotating) TEVs shedding from the top foil. The braid of the TEV exhibits distinct perturbations, while strong vortical structures are formed on the lower surface of the foil. The perturbed braid of the TEV undergoes the same deformation process as described above for the TEV shedding from the bottom foil. This supports the qualitative link witnessed between the emergence of shear-layer instability and LEV dynamics.
Temporal evolution of vortical structures ( $Q\,c^2/U_{\infty }^2=10$) around in-phase pitching foils for
 $St=0.3$ and
 $y^*=0.75c$ at (a)
 $t_1=11.375P$, (b)
 $t_2=11.625P$, (c)
 $t_3=11.75P$ and (d)
 $t_4=12P$. Iso-surfaces are coloured using normalized spanwise vorticity (
 $\omega _z^*=\omega \,c /U_{\infty }=-30$ for blue and
 $\omega _z^* =30$ for red).

To quantify the spanwise instability characteristics, the wavelength of the undulations on the TEV is calculated. Figure 7 shows contours of streamwise vorticity plotted on planes that cut through the centre of secondary roll-ups on upper surfaces of the foils and newly developing TEVs. Undulations in the TEV shed from the bottom foil lead to the formation of aligned streamwise vortex pairs along the spanwise direction for  $y/c\approx -0.2$ at
 $x/c=1.07$. Wavelength of the spanwise instability, denoted by
 $\lambda _z$ in figure 7, is defined as the distance between two consecutive similarly signed vortices. The average wavelength of the instability is
 $\lambda _z/c=0.37$, indicating a short-wavelength mode. This is consistent with the Floquet stability analysis of Deng & Caulfield (Reference Deng and Caulfield2015), who observed that vortices in the wake of pitching foils are unstable to short-wavelength perturbations at
 $\lambda _z/c=0.21$. Conversely, no significant alignment is observed for the TEV shed from the top foil (
 $y/c \approx 0.55$) because of its mostly 2-D structure. Likewise, streamwise vortex alignment is markedly evident at
 $x/c=0.97$ for
 $y/c \approx -0.25$, corresponding to the secondary roll-up on the upper surface of the bottom foil. In contrast, it is nearly undetectable on the upper surface of the top foil (
 $y/c \approx 0.5$), where a distinct secondary roll-up is absent. Figure 8 presents streamwise vorticity profiles for the secondary roll-ups and TEVs around the bottom (Foil 1) and top (Foil 2) foils, exploring their connection. It quantifies the spanwise undulations of the vortical structures around the bottom foil, which exhibit significantly larger amplitudes compared with those around the top foil. A more profound insight that can be drawn from this figure is the elucidation of interplay between the secondary roll-up and the TEV of the bottom foil. Short-wavelength instabilities develop in counter-rotating vortex pairs due to mutually induced strain between the vortices (Leweke & Williamson Reference Leweke and Williamson1998). These perturbations exhibit a distinct phase relationship, which can be attributed to the effects of vortex perturbations on the strain induced on the other vortex, and their mutual interaction (Leweke & Williamson Reference Leweke and Williamson1998). Correspondingly, vorticity profiles of the TEV and secondary roll-up for the bottom foil display a near-perfect out-of-phase relationship, a pattern not observed for the upper foil. This provides quantitative evidence demonstrating the critical role of secondary roll-ups in inducing short-wavelength spanwise instability of the TEV and its braid. Furthermore, this finding links the foil proximity effect to the observed instability, given that the formation of secondary roll-ups is closely tied to foil proximity, as detailed in § 3.2 through qualitative and quantitative analyses.
Iso-surfaces of  $Q$-criterion (
 $Qc^2/U_{\infty }^2=10$) around in-phase pitching foils, along with contours of streamwise vorticity (
 $\omega _x^*=\omega _x \, c /U_{\infty }$) for
 $St=0.3$ and
 $y^*=0.75c$ at
 $t=11.375P$. Vorticity contours are plotted on the planes cutting through the secondary roll-ups and newly shedding TEVs at
 $x/c=0.97$ and
 $x/c=1.07$, respectively. Iso-surfaces are coloured using normalized spanwise vorticity (
 $\omega _z^*=\omega _z \, c /U_{\infty }=-30$ for blue and
 $\omega _z^* =30$ for red).

Profiles of streamwise vorticity ( $\omega _z^*=\omega \, c /U_{\infty }$) for
 $St=0.3$ and
 $y^*=0.75c$ at
 $t=12.375P$ along lines intersecting the secondary roll-ups and TEVs as depicted in figure 7.

The connection between the shear-layer instability induced by the foil proximity effect and the formation and growth of LEVs and secondary roll-ups is further quantitatively evaluated and linked with qualitative wake visualizations in figure 9. A combination of spanwise vorticity contours ( $\omega ^*_z$) and profiles of span-averaged chordwise pressure gradients (
 ${\rm d}p_w/{{\rm d}\kern0.7pt x}$) are presented here. Temporal evolution of vortex topology in the vicinity of the foils at the mid-plane (
 $z/c=0)$ for a complete pitching cycle delivers a clear depiction of the alteration mechanism of the LEV in figure 9(a–d). Variations in span-averaged pressure gradients on the upper surfaces of both foils are tracked over the same pitching cycle to provide a quantitative assessment of this process (figure 9e–h). A rapid variation of the pressure gradient on the surface is associated with the presence of a large-scale vortex core, as suggested by Obabko & Cassel (Reference Obabko and Cassel2002). This method is also used by Verma et al. (Reference Verma, Khalid and Hemmati2023) to identify LEV structures forming on the surfaces of oscillating foils in correspondence with transition mechanisms that govern the growth of secondary streamwise structures. While the variation of the pressure gradient is influenced by the combined effect of all surrounding vortices (Menon & Mittal Reference Menon and Mittal2021), the primary contribution is expected to originate from these surrounding vortices. At the beginning of the downstroke (figure 9a), LEVs start forming on the upper surfaces of the foils. That formed on the bottom foil (
 ${\rm LEV}_{bot}^1$) is considerably stronger compared with that formed on the top foil (
 ${\rm LEV}_{top}^1$). This is evident from the deviation of the maximum pressure gradients in figure 9(e), which corresponds to these particular LEVs. By the time both foils reach their middle position parallel to free stream at
 $t_2=11.5P$, a secondary vortex roll-up is visible on the bottom foil near its trailing edge. It coincides with emergence of the newly discovered ‘double neck’ on the braid of
 ${\rm TEV}_{bot}^1$ prior to its detachment from the foil (figure 9c). On the contrary, the top foil exhibits no sign of a secondary roll-up with only a ‘single neck’ appearing in the shear layer of
 ${\rm TEV}_{top}^1$. Quantitative data also confirm the presence of a secondary roll-up on the bottom foil during the downstroke (figure 9f), while it is absent on the top foil. This phenomenon further reinforces the argument that this newly identified instability in the TEV braid is linked to the formation of secondary roll-ups. At the time of complete detachment of TEVs from the foils (figure 9d), the single neck of
 ${\rm TEV}_{top}^1$ is drawn into the stronger co-rotating TEV (
 ${\rm TEV}_{top}^1$), resulting in their merger. The first neck of
 ${\rm TEV}_{bot}^1$ undergoes very similar dynamics, eventually merging with
 ${\rm TEV}_{bot}^1$. Contrarily, the second neck of
 ${\rm TEV}_{bot}^1$ is not absorbed into the primary vortex. Instead, it separates from the braid region and convects downstream. An identical process occurs on the lower surfaces of the foils during the upstroke phase of the pitching cycle due to the inherent symmetry of the phenomenon, although it is not marked on the figures for simplicity.
Time evolution of (a–d) contours of spanwise vorticity ( $\omega _z^*=\omega \, c /U_{\infty }$) around in-phase pitching foils at the mid-plane (
 $z/c=0$), and (e–h) profiles of span-averaged pressure gradient (
 ${\rm d}p_w/{{\rm d}\kern0.7pt x}$) on upper surfaces of the foils for
 $St=0.3$ and
 $y^*=0.75c$. Time instants are at (a,e)
 $t_1=11.25P$, (b,f)
 $t_2=11.5P$, (c,g)
 $t_3=11.75P$ and (d,h)
 $t_4=12P$.

3.2. Influence of the foil proximity effect
We now expand on the pivotal role of the foil proximity effect (quantified by spacing between the foils) to further explore dynamics of the shear-layer instability. Figure 10 displays iso-surfaces of the  $Q$-criterion, along with contours of
 $\omega _z^*$ on the mid-plane (
 $z/c=0$) at
 $St=0.3$. Three distinct cases representing extreme (
 $y^*=0.5c$), moderate (
 $y^*=c$) and low (
 $y^*=1.5c$) foil proximity effect are selected. The results clearly illustrate the transition from a 2-D wake to a 3-D wake as the separation distance between foils decreases (right-hand column of figure 10). This wake three-dimensionality aligns well with the presence of the secondary roll-up and double-neck structure at the lowermost position of the foils (
 $t=11.75P$). The wake behind the pitching foils at
 $y^*=1.5c$ (figure 10a) is predominantly 2-D, where especially the bottom foil experiences neither double necking nor secondary roll-up. In the case of moderate foil proximity effect (
 $y^*=c$), both double necking and the roll-up of a secondary vortex are qualitatively visible (figure 10b). Two-dimensionality of the wake is disturbed with development of the shear-layer instability. This process subsequently promotes the detachment of the shear layer from the braid region and its transformation into the streamwise vortex filaments, surrounding the vortex rollers at the mid-wake (
 $x/c \approx 6$). It also coincides with the growth of spanwise undulations on the counterclockwise-rotating TEVs shed from the bottom foil, and clockwise-rotating TEVs shed from the top foil. The necks within the double-neck structure and the secondary roll-up on the surface evidently manifest under extreme foil proximity effect at
 $y^*=0.5c$ (figure 10c). Their sizes become comparable to that of the shed TEV and the primary LEV, respectively. The detached necks mostly preserve their coherence even in the mid-wake, unlike moderate foil proximity effects (figure 10b), where the detached necks deform and lose coherence due to the influence of the TEV. This phenomenon is attributed to the change in the strength of primary rollers and the detached necks. A larger imbalance in the strengths of a pair of counter-rotating vortices promotes the transformation of a weaker vortex into vortex filaments (Ryan, Butler & Sheard Reference Ryan, Butler and Sheard2012). This is apparent in the ratio between the circulations of TEVs (
 $\varGamma _0^*$) and second necks (
 $\varGamma _2^*$), yielding
 $\varGamma _0^*/\varGamma _2^*=1.98$ and
 $\varGamma _0^*/\varGamma _2^*=5.13$ for the extreme and moderate foil proximity effect cases, respectively.
Iso-surfaces of  $Q$-criterion (
 $Q\,c^2/U_{\infty }^2=1.5$) in the wake of in-phase pitching foils at
 $St=0.3$, along with contours of spanwise vorticity (
 $\omega _z^*=\omega \, c /U_{\infty }$) at the mid-plane (
 $z/c=0$) at the lowermost position (
 $t=11.75P$) for (a)
 $y^*=1.5c$, (b)
 $y^*=c$ and (c)
 $y^*=0.5c$. Circulation (
 $\varGamma ^*=\varGamma /U_{\infty }c$) calculations for TEVs and necks are performed within the depicted square regions following Khalid et al. (Reference Khalid, Wang, Dong and Liu2020).

Figure 11 quantitatively compares span-averaged pressure gradients on the upper surfaces of the lower foils at different spacings between the two foils. The amplitude of pressure gradient variation, which is linked to the secondary roll-up, is most pronounced under extreme foil proximity effect conditions ( $y^*=0.5c$) and consistently diminishes with widening foil spacing. At
 $y^*=1.5c$, the foil proximity effect features nearly vanish, apparent with the absence of double necking and wake three-dimensionality (figure 10c). A similar trend is observed for LEVs, reaffirming the consistency of wake features associated with the foil proximity effect. Furthermore, a remarkable insight derived from this visualization is the chordwise shift of both LEVs and secondary roll-ups towards the trailing edge with shrinking separation between the foils. This observation further strengthens our argument that the secondary roll-up plays a vital role in perturbing the shear layer, through braid of oppositely signed TEVs.
Profiles of span-averaged chordwise pressure gradient ( ${\rm d}p_w/{{\rm d}\kern0.7pt x}$) along upper surfaces of Foil 2 for
 $St=0.3$ at
 $t=11.75P$ for various cases of foil proximity effect.

3.3. Effect of kinematics of the foils
We proceed with an investigation of the role of oscillation frequency on physical aspects of the shear-layer instability. Increasing  $St$ can potentially lead to the formation of secondary vortical structures or alter the governing mechanism for their growth (Verma et al. Reference Verma, Khalid and Hemmati2023). Nevertheless, primary characteristics of the shear-layer instability at lower Strouhal number (
 $St=0.3$), as discussed in § 3.1, align with those observed at
 $St=0.5$. The case of strong foil proximity effect (
 $y^*=0.75c$) is selected to elucidate the impact of
 $St$. The temporal evolution of vortex topology around the foils at
 $St=0.5$ and
 $y^*=0.75c$ closely resembles that at
 $St=0.3$. Therefore, it is not included here for brevity. Instead, it is provided as a movie, animating a complete pitching cycle, in the electronic supplementary material. The key difference is the more pronounced foil proximity effect at the higher
 $St$, which coincides with the emergence of more prominent structures detaching from the braid region (see supplementary movie 1 available at https://doi.org/10.1017/jfm.2024.897).
Since vortex instabilities result from a resonance between Kelvin modes within the core of vortex filaments and the underlying strain field, their linear growth rate is directly proportional to the strain field (Kerswell Reference Kerswell2002). Hence, we use the strain rate as a tool to elucidate the correspondence between  $St$ and the shear-layer separation instability. Hemmati et al. (Reference Hemmati, Wood and Martinuzzi2019) further reported that
 $Q$ was proportional to the source term in the Poisson equation, which could provide a connection between the vortex core location and the strain rate via
 $Q=({1}/{2 \rho })\nabla ^2 p=|R|^2-|S|^2$. Here,
 $|R|^2$ and
 $|S|^2$ represent the square of rotation and strain rate tensors, respectively. Menon & Mittal (Reference Menon and Mittal2021) also discussed the existing strain-dominated (
 $Q<0$) regions, encircling the rotation-dominated core of vortices (
 $Q>0$). These considerably impact the vortex dynamics. Figure 12 demonstrates the contours of
 $|S|^2$ around the bottom foil (figure 12b,d) and the top foil (figure 12a,c) at
 $St=0.3$ (figure 12a,b) and
 $0.5$ (figure 12c,d) for
 $y^*=0.75$ in the middle of the downstroke phase. For both cases, the upper surface of the top foil and the lower surface of the bottom foil exhibit only a thin layer of a high-strain region, which coincides with the presence of the weaker LEVs on these surfaces. Contrarily, wider regions of high strain rate are observed on the upper surfaces of the bottom foil near the trailing edge, coinciding with the development of secondary roll-ups. It is also evident from these snapshots that the strain rate is more intense above the upper surface of the bottom foil and along the shear layer of its newly developing TEV braid at the higher Strouhal number. This explains the detachment of more prominent structures. These findings are further supported by the quantitative data illustrated in figure 12(e), which presents the profiles of
 $|S|^2$ along a vertical line, starting from the upper surfaces of both foils (
 $y_s$) at
 $x/c = 0.85$ identified in figure 12(a–d). Notably, profiles of
 $|S|^2$ are wider for the bottom foil compared with those for the top foil for both Strouhal numbers, whereas the peaks of
 $|S|^2$ at
 $St=0.5$ considerably surpass those at
 $St=0.3$. It is important to note that these patterns remain consistent across various streamwise locations along the foil chord, near the trailing edge, which are not displayed here.
Contours of  $|S|^2$ around Foil 1 (b,d) and Foil 2 (a,c) at
 $St=0.3$ (a,b) and
 $St=0.5$ (c,d), along with (e) profiles of
 $|S|^2$ with respect to vertical distance (
 $y_s$) measured from the foil surfaces at
 $x/c=0.85$ (marked on the contour plots) for in-phase pitching motion and
 $y^*=0.75c$. The computation of
 $|S|^2$ is performed over the 3-D flow data, and the results are plotted at the mid-plane (
 $z/c=0$) for time instants
 $t=11.5P$ and
 $t=21.5P$ for
 $St=0.3$ and
 $0.5$, respectively.

The phase difference between the foils represents another crucial kinematic parameter that significantly influences the vortex topology around the foils and the corresponding 3-D instabilities. While the paper predominantly addresses the foil-proximity-effect-induced shear-layer instability in the context of in-phase pitching foils, it is noteworthy to emphasize that this instability also manifests during the out-of-phase motion, as depicted in figure 13. This corresponds to the case of  $St=0.3$ and
 $y^*=0.75c$. A notable feature of out-of-phase pitching foils is that they simultaneously experience instability because of the mirror-image symmetry of their kinematics. The influence of the foil proximity effect on the LEV dynamics is precisely opposite for in-phase and out-of-phase motions. For the out-of-phase motion, LEVs forming on the outer surfaces of the foils are markedly stronger than those on the neighbouring surfaces, constituting a crucial nuance from the in-phase motion. However, characteristics of the instability, including the formation of double necks on the braids of TEVs, and the growth of secondary roll-ups with opposite circulation compared with the double necks remain essentially the same for the out-of-phase motion as we observe for the case of in-phase motion. This consistency provides additional evidence for the association between the newly discovered shear-layer instability and the alteration mechanism of the LEVs. This observation can be further leveraged to estimate the 3-D wake characteristics of parallel pitching foils with various kinematic settings. For instance, 2-D coherent wake structures around parallel pitching foils undergoing intermediate phase differences resemble those of either in-phase or out-of-phase cases, depending on the phase difference (Gungor et al. Reference Gungor, Khalid and Hemmati2022b). Consequently, it can be inferred that their 3-D wake characteristics would similarly align with those of either in-phase or out-of-phase cases, considering that the 3-D instabilities are shown to originate from the interactions of 2-D coherent structures, namely LEVs (secondary roll-ups) and TEVs, along with their braids.
Iso-surfaces of  $Q$-criterion (
 $Q\,c^2/U_{\infty }^2=10$) in the wake of out-of-phase pitching foils, along with contours of spanwise vorticity (
 $\omega _z^*=\omega \, c /U_{\infty }$) at the mid-plane (
 $z/c=0$) for
 $St=0.3$ and
 $y^*=0.75c$ at
 $t=12.25P$.

4. Conclusions
Three-dimensional instabilities around pitching foils in side-by-side configurations are numerically evaluated at  $Re=8000$. The foil proximity effect, defined in terms of the influence of a neighbouring foil on vortex dynamics, plays a crucial role in the emergence of 3-D structures and a newly discovered shear-layer instability. During the downstroke of the in-phase pitching motion, a TEV, shed from the bottom foil, experiences spanwise undulations while its braid (representative of a shear layer) exhibits perturbations. This leads to the formation of secondary spanwise structures that detach from the shear layer and convect downstream. A mirrored phenomenon occurs for the upper foil during the upstroke motion. These phenomena are associated with the development of secondary roll-ups on the upper and lower surfaces of the bottom and top foils near their trailing edges, respectively.
The foil proximity effect has a consistent impact on the newly identified instability, characterized by the emergence of a double-neck structure within the shedding TEVs. Double necks become more pronounced with intensified foil proximity effect. The secondary roll-up becomes stronger, and it moves closer to the trailing edge. Under low foil proximity effect, the wake predominantly exhibits 2-D features, coinciding with the absence of double necks and secondary roll-up. Increasing the Strouhal number also has a significant influence on the wake three-dimensionality, leading to the detachment of more prominent structures from the shear layer. This impact coincides with the production of a higher-strain-rate region around the trailing edge and on the shear layer. Despite distinct implications of the foil proximity effect on the vortex dynamics around in-phase and out-of-phase pitching foils, the intrinsic attributes of the instability undergo no fundamental alteration.
Supplementary movie
Supplementary movie is available at https://doi.org/10.1017/jfm.2024.897.
Declaration of interests
The authors report no conflict of interest.


 Open access

