Graphene is a two-dimensional atomic layer of sp Reference Novoselov, Geim, Morozov, Jiang, Katsnelson, Grigorieva, Dubonos and Firsov2-bonded carbon in a honeycomb lattice.Reference Geim and Novoselov1–Reference Novoselov, Geim, Morozov, Jiang, Zhang, Dubonos, Grigorieva and Firsov3 Seminal work exploring its unusual physics in 2004 Spurred substantial research activity, revealing exceptional properties for graphene, including high carrier mobilities,Reference Bolotin, Sikes, Jiang, Klima, Fudenberg, Hone, Kim and Stormer4, Reference Castro Neto, Guinea, Peres, Novoselov and Geim5 mechanical strength,Reference Lee, Wei, Kysar and Hone6 optical transparency,Reference Nair, Blake, Grigorenko, Novoselov, Booth, Stauber, Peres and Geim7 and thermal conductivity.Reference Cai, Moore, Zhu, Li, Chen, Shi and Ruoff8 While this combination of properties suggests great promise for graphene in electronic applications, its lack of a bandgap and chemical inertness present challenges that need to be addressed before graphene is widely employed in integrated circuits.Reference Ruoff9, Reference Geim10 Surface functionalization of graphene is a potential solution, as chemical methods can modulate the band structure, tune doping levels, and provide tailored chemical reactivity that can seed the deposition and growth of other materials (e.g., dielectrics and metals) with precisely controlled interfaces.
Many of the initial efforts to functionalize graphene have drawn from previously known chemistries involving graphite, fullerenes, and carbon nanotubes. While these forms of carbon have been extensively studied and offer many promising directions for the chemical functionalization of graphene,Reference Niyogi, Bekyarova, Itkis, McWilliams, Hamon and Haddon11–Reference Bahr and Tour13 several important differences exist between graphene and other carbon allotropes that can influence its chemical reactivity. For example, in contrast to graphite, suspended graphene has both surfaces available for reaction, while supported graphene can be structurally and/or electronically influenced by the underlying substrate. In addition, graphene lacks the high curvature of fullerenes and carbon nanotubes, which tends to reduce its chemical reactivity. For these reasons, graphene surface functionalization presents unique challenges and opportunities that make it a fertile area of materials research.
As a two-dimensional material that is compatible with traditional planar fabrication techniques, lithographic patterning of graphene is also being pursued as a method for engineering its electronic properties.Reference Han, Ozyilmaz, Zhang and Kim14 In particular, researchers are actively exploring nanolithography as a method for creating semiconducting graphene nanoribbons (GNRs) with an electronic bandgap inversely proportional to width.Reference Son, Cohen and Louie15, Reference Son, Cohen and Louie16 While GNRs have been produced by lithographicReference Han, Ozyilmaz, Zhang and Kim14, Reference Masubuchi, Ono, Yoshida, Hirakawa and Machida17 or chemical methods,Reference Jiao, Wang, Diankov, Wang and Dai18–Reference Li, Wang, Zhang, Lee and Dai20 the development of reliable methods for producing high yields of GNRs with a controlled bandgap remains an open challenge. Furthermore, since the electronic properties of a GNR depend sensitively on the geometry and passivation of its edges,Reference Ritter and Lyding21 lithographic and/or chemical strategies require improved precision at or near the atomic scale.
In this article, we review recent work from our laboratory that is addressing the aforementioned issues via organic chemical functionalization of graphene. In an effort to characterize, understand, and manipulate the surface chemistry of graphene at the molecular level, this research employs ultrahigh vacuum scanning tunneling microscopy (UHV STM) due to its established atomic-scale spatial resolution capabilities. Different organic functionalization chemistries are categorized by the nature of the chemical bonding with the graphene surface (i.e., noncovalent versus covalent). For noncovalent organic monolayers, the intermolecular interactions play an important and sometimes dominant role in driving the molecular assembly compared to the molecule-substrate interactions. In addition, the relatively weak molecule-substrate interactions imply that the outstanding electronic properties of graphene remain essentially unperturbed while the noncovalent organic monolayer provides tailorable surface chemical reactivity. On the other hand, covalent organic adsorbates can induce substantial local perturbation to the electronic structure of the underlying graphene substrate, which presents opportunities for manipulating electronic properties for device applications. Beyond structural and electronic characterization, UHV STM is also utilized to nanopattern organic molecules on graphene at the sub-5 nm length scale. In this manner, fundamental studies and prototype device fabrication are being actively pursued for graphene-based heteromolecular nanostructures.
Experimental methods
UHV STM possesses two primary advantages for studying chemically functionalized graphene: (1) STM imaging allows the spatial ordering and electronic character of the functionalized surface to be directly observed with molecular spatial resolution; (2) the UHV environment effectively eliminates the competitive adsorption of contaminants that would otherwise alter or obscure the functionalized surface. Our work was conducted with a home-built UHV STM systemReference Foley, Yoder, Guisinger and Hersam22 that is operated at room temperature. For the noncovalent functionalization chemistries, the molecules are deposited onto graphene in UHV via gas phase thermal evaporation and imaged with STM without breaking vacuum. On the other hand, covalent functionalization is prepared through solution-phase reactions at atmospheric pressure. The covalently modified substrates are then introduced into the UHV chamber, where the surfaces are cleaned by thermal outgassing preceding STM imaging. These approaches have been refined in our laboratory over the past decade on chemically functionalized silicon surfaces,Reference Baluch, Guisinger, Basu, Foley and Hersam23–Reference Yoder, Guisinger, Hersam, Jorn, Kaun and Seideman45 and routinely enable molecular resolution imaging, spectroscopy, and nanopatterning.
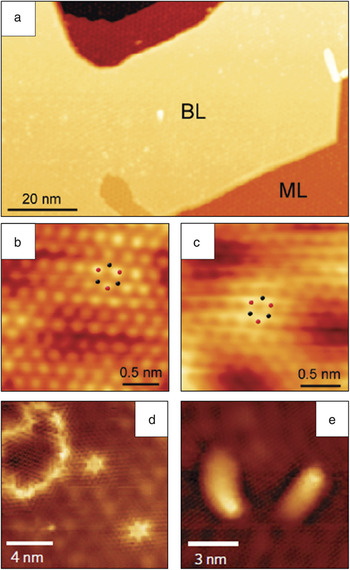
The form of graphene used in our studies is epitaxial graphene grown on SiC(0001) wafers. Epitaxial graphene is compatible with standard wafer-scale fabrication techniques, making it a leading candidate for electronic applications.Reference Berger, Song, Li, Li, Ogbazghi, Feng, Dai, Marchenkov, Conrad, First and de Heer46–Reference Lin, Dimitrakopoulos, Jenkins, Farmer, Chiu, Grill and Avouris49 Furthermore, epitaxial graphene is readily compatible with UHV sample preparation and STM imaging. Epitaxial graphene is formed by annealing SiC(0001) substrates at high temperature (above 1300°C) under UHV conditions, leading to the depletion of Si from the surface and subsequent graphitization.Reference Hass, de Heer and Conrad50 The graphene sheets grow over atomic steps on the SiC substrate in a carpet-like mannerReference Lauffer, Emtsev, Graupner, Seyller, Ley, Reshanov and Weber51 with large atomically flat terraces that are well-suited for molecular resolution studies with STM. Representative STM images of the pristine epitaxial graphene surface are shown in Figure 1. The UHV-prepared epitaxial graphene samples typically possess a mixture of monolayer and bilayer graphene domains, as seen in Figure 1a.Reference Hossain, Walsh and Hersam52–Reference Wang and Hersam54 The monolayer (Figure 1c) and bilayer (Figure 1b) regions can be readily distinguished by STM imaging,Reference Lauffer, Emtsev, Graupner, Seyller, Ley, Reshanov and Weber51 which allows the influence of graphene layer thickness on chemical reactivity to be locally studied. Various zero-dimensional, one-dimensional, and two-dimensional defects are also observable (Figure 1d and 1e). It should be noted that epitaxial graphene possesses high stability and chemical inertness, which allows it to be exchanged between vacuum and ambient conditions for additional processing and characterization.Reference Hossain, Walsh and Hersam52, Reference Wang and Hersam53, Reference Kellar, Alaboson, Wang and Hersam55
Scanning tunneling microscopy (STM) images of pristine epitaxial graphene on SiC(0001). (a) Large-area STM image showing bilayer (BL) and monolayer (ML) regions (V s = –2.6 V, I t = 0.05 nA). (b) Atomically resolved STM image of bilayer graphene, with every other atom visible due to AB stacking (V s = –0.25 V, I t = 0.1 nA). (c) Atomically resolved STM image of monolayer graphene (V s = –0.25 V, I t = 0.1 nA). The dots in (b) and (c) indicate the locations of carbon atoms in the graphene lattice. (d) STM image of two zero-dimensional defects and one two-dimensional defect (V s = 0.25 V, I t = 0.02 nA). (e) STM image of two one-dimensional defects (V s = –0.3 V, I t = 0.05 nA). Adapted from Hossain et al. (a–c)Reference Hossain, Walsh and Hersam52 and Wang and Hersam (d–e).Reference Wang and Hersam53V s, sample bias; I t, tunneling current.

Noncovalent organic functionalization of graphene
A wide range of materials and molecules can interact noncovalently with graphene, including small inorganic molecules,Reference Schedin, Geim, Morozov, Hill, Blake, Katsnelson and Novoselov56, Reference Wang, Li, Zhang, Yoon, Weber, Wang, Guo and Dai57 large aromatic molecules,Reference Dong, Fu, Fang, Shi, Chen and Li58–Reference Chen, Chen, Qi, Gao and Wee61 polymers,Reference Stankovich, Dikin, Dommett, Kohlhaas, Zimney, Stach, Piner, Nguyen and Ruoff62 metals,Reference Zhou, Gweon, Fedorov, First, de Heer, Lee, Guinea, Neto and Lanzara63–Reference Kessler, Girit, Zettl and Bouchiat65 and metal oxides.Reference Lin, Dimitrakopoulos, Jenkins, Farmer, Chiu, Grill and Avouris49, Reference Farmer, Chiu, Lin, Jenkins, Xia and Avouris66–Reference Wang, Tabakman and Dai72 In general, these noncovalent interactions are sufficiently weak to preserve the electronic band structure of the underlying graphene, although some organic molecules can act as molecular dopants.Reference Chen, Chen, Qi, Gao and Wee61 Noncovalent chemistries also underlie many efforts to disperse graphene in solution.Reference Green and Hersam73–Reference Liang, Wu, Feng and Mullen75 The growth of metal oxide layers, which has important applications as dielectric layers in electronic devices and as photocatalysts, has been demonstrated on graphene by thermal oxidation of sputtered thin metal filmsReference Pirkle, Wallace and Colombo70, Reference Robinson, LaBella, Trumbull, Weng, Cavelero, Daniels, Hughes, Hollander, Fanton and Snyder71 and by atomic layer deposition (ALD) on an organic seeding layer.Reference Lin, Dimitrakopoulos, Jenkins, Farmer, Chiu, Grill and Avouris49, Reference Wang, Tabakman and Dai72
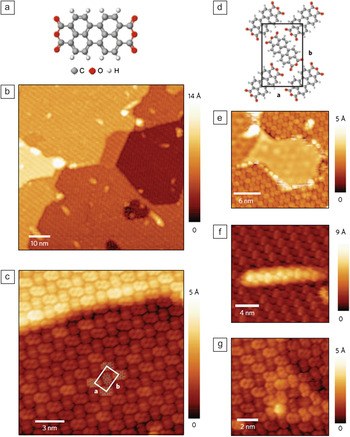
In our laboratory, the formation of noncovalent organic monolayers on epitaxial graphene has been studied at the molecular scale with UHV STM using the molecular semiconductor 3,4,9,10-perylene-tetracarboxylic dianhydride (PTCDA).Reference Wang and Hersam53 A related molecule, 3,4,9,10-perylene-tetracarboxylic acid (PTCA), was previously shown to seed the uniform growth of aluminum oxide, which is a dielectric material that grows irregularly on bare graphene due to graphene’s hydrophobicity and chemical inertness.Reference Wang, Tabakman and Dai72 In this previous work, the role of PTCA as an effective functional seed layer was demonstrated, but the nature of the molecular interactions with graphene were not studied. The molecular structure of PTCDA is shown in Figure 2a, and STM images of the PTCDA monolayer formed on epitaxial graphene following thermal evaporation are shown in Figure 2b–2c and 2e–2g. The self-assembled PTCDA monolayer is well-ordered and uniform, with typical domain sizes spanning hundreds of nanometers. The molecules form a herringbone arrangement, as seen in Figure 2c, similar to the herringbone arrangement adopted by PTCDA on other inert substrates such as highly oriented pyrolytic graphite (HOPG) and metal surfaces,Reference Eremtchenko, Schaefer and Tautz76–Reference Hoshino, Isoda, Kurata and Kobayashi78 and also similar to the (102) plane of the PTCDA bulk crystal structure.Reference Forrest79 The herringbone unit cell is schematically illustrated in Figure 2d.
3,4,9,10-perylene-tetracarboxylic dianhydride (PTCDA) monolayer ordering on epitaxial graphene. (a) Molecular structure of PTCDA (C: grey, O: red, H: white). (b) Large-area scanning tunneling microscopy (STM) image of the PTCDA monolayer on epitaxial graphene. The same PTCDA domain covers several underlying substrate terraces. (c) Molecularly resolved STM image of the PTCDA monolayer, which continuously follows the graphene sheet over the SiC step edge. One unit cell is indicated by the white outline; a and b are unit vectors. (d) Schematic model of the PTCDA herringbone monolayer unit cell, indicated by the black outline and unit vectors a and b. (e–g) STM images of PTCDA interacting with different types of surface defects: step edge where the graphene is not continuous (e), one-dimensional defect (f), and zero-dimensional point defect (g). For all STM images, V s = –2.0 V; I t = 0.05 nA. Adapted from Wang and Hersam.Reference Wang and Hersam53V s, sample bias; I t, tunneling current.

The PTCDA monolayer is also insensitive to surface defects such as underlying SiC step edges (Figure 2c), one-dimensional defects (Figure 2f), and point defects (Figure 2g). In these cases, the graphene sheet is still continuous, and the PTCDA monolayer continuously follows the unbroken graphene sheet. However, if the underlying SiC step edges are accompanied by a break in the graphene sheet (Figure 2e), then the PTCDA monolayer is also disrupted. The orientation of PTCDA monolayers on epitaxial graphene does not appear to be correlated with the symmetry of the underlying substrate, since adjacent domains of PTCDA possess relative ordering at arbitrary angles,Reference Wang and Hersam53 unlike the behavior of PTCDA on HOPG, which has domains rotated at multiples of 60° to each other.Reference Huang, Chen, Gao, Chen and Wee80, Reference Kendrick, Kahn and Forrest81 These observations indicate that PTCDA on graphene possesses relatively weak molecule-substrate interactions (e.g., π–π* interactions) and relatively strong intermolecular interactions (e.g., hydrogen bonding and quadrupolar interactions between nearest neighbor molecules).Reference Eremtchenko, Schaefer and Tautz76, Reference Rochefort and Wuest82, Reference Tian, Xu and Wang83 The insensitivity of the PTCDA monolayer to graphene surface defects makes it an ideal seeding layer for highly uniform ALD growth of high-k dielectric thin films.Reference Alaboson, Wang, Emery, Lipson, Bedzyk, Elam, Pellin and Hersam84
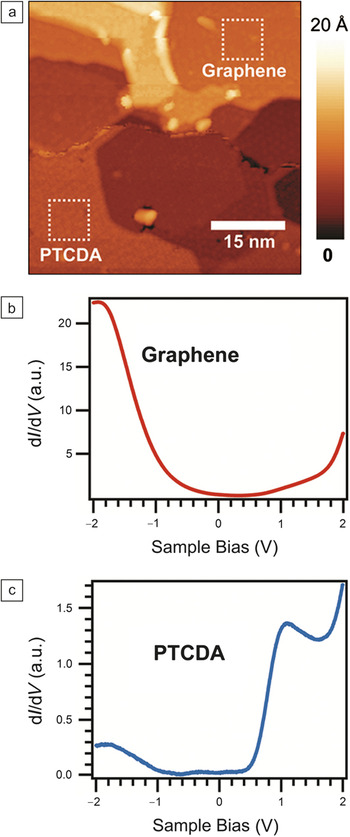
Scanning tunneling spectroscopy (STS) allows study of the electronic properties of the PTCDA monolayer on epitaxial graphene, as shown in Figure 3. The differential tunneling conductance, which is the derivative of the tunneling current with respect to applied sample bias voltage (dI/dV), is a probe of the electronic density of states. In Figure 3, dI/dV spectra were measured as a function of sample bias voltage over clean graphene (Figure 3b) and PTCDA-covered regions (Figure 3c) in the sample regions shown in Figure 3a.Reference Wang and Hersam53 The PTCDA spectrum shows two prominent peaks at about 1.1 V and –1.8 V, which are attributed to the lowest unoccupied molecular orbital (LUMO) and highest occupied molecular orbital (HOMO) of the PTCDA molecule, respectively.Reference Wang and Hersam53 The measured positions of the LUMO and HOMO levels are consistent with weak electronic coupling between the PTCDA and graphene, which suggests that the electronic properties of the underlying graphene remain intact following noncovalent functionalization.
Scanning tunneling spectroscopy of noncovalently functionalized epitaxial graphene. (a) Scanning tunneling microscopy image of the sample area where differential tunneling conductance (dI/dV) spectra were measured. An island of 3,4,9,10-perylene-tetracarboxylic dianhydride (PTCDA) is present in the lower half of the image, while the upper half of the image is pristine graphene. (b) Spatially averaged dI/dV spectrum of clean graphene measured over the upper square of (a). (c) Spatially averaged dI/dV spectrum of PTCDA measured over the lower square of (a). Adapted from Wang and Hersam.Reference Wang and Hersam53

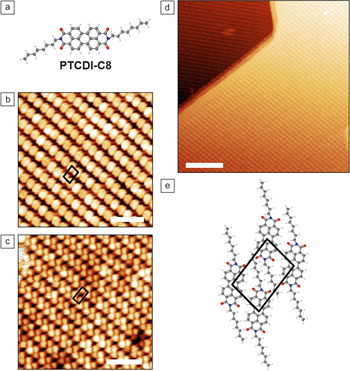
To further investigate the relative importance of molecule-substrate and intermolecular interactions in the formation of noncovalent monolayers on graphene, we studied a related derivative molecule of PTCDA, N,N′-dioctyl-3,4,9,10-perylene-tetracarboxylic diimide (PTCDI-C8), whose molecular structure is shown in Figure 4a. This molecule has the same aromatic backbone as PTCDA, but differs from PTCDA by the substitution of two oxygen atoms with nitrogen coupled to an eight-carbon alkyl chain at each end of the molecule. STM images of the PTCDI-C8 monolayer are shown in Figure 4b–d. It is immediately clear from the STM images that the alkyl tails on PTCDI-C8 have altered the ordering within the PTCDI-C8 monolayer from the herringbone phase observed for PTCDA to a rectangular striped phase. A schematic of the proposed unit cell is shown in Figure 4e, where the aromatic backbone of the PTCDI-C8 molecule lies flat on graphene via π–π* interactions in the same manner as PTCDA, and the alkyl tails protrude away from the surface, consistent with a previous study of PTCDI-alkyl molecules.Reference Kaneda, Stawasz, Sampson and Parkinson85 The observed difference in ordering geometry indicates a change in the directionality and strength of the intermolecular bonding.
N,N'-dioctyl-3,4,9,10-perylene-tetracarboxylic dianhydride (PTCDI-C8) monolayer ordering on epitaxial graphene. (a) Molecular structure of N,N'-dioctyl-3,4,9,10-perylene-tetracarboxylic diimide (PTCDI-C8) (C: grey, H: white, O: red, N: blue). (b) Scanning tunneling microscopy (STM) image of PTCDI-C8 monolayer showing filled states (V s = –1.0 V, I t = 0.05 nA, scale bar = 5 nm). (c) STM image of PTCDI-C8 monolayer showing empty states (V s = +1.0 V, I t = 0.05 nA, scale bar = 5 nm). (d) Large-area STM image of PTCDI-C8 showing long-range ordering over two substrate terraces (V s = –2.0 V, I t = 0.05 nA, scale bar = 20 nm). (e) Schematic model of the PTCDI-C8 monolayer unit cell. The black outlines in (b), (c), and (e) indicate the PTCDI-C8 unit cell. Adapted from Wang and Hersam.Reference Wang and Hersam54V s, sample bias; I t, tunneling current.

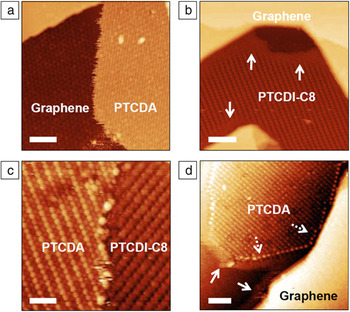
Further insight into the intermolecular bonding in these noncovalent monolayers can be gained by studying submonolayer coverages of PTCDA and PTCDI-C8. In Figure 5a and 5b, PTCDA and PTCDI-C8, respectively, form distinct islands on epitaxial graphene at submonolayer coverage.Reference Wang and Hersam53, Reference Wang and Hersam54 The PTCDA islands (Figure 5a) possess distinct edges that sharply distinguish the molecules from the graphene, although some instability during STM imaging is visible. On the other hand, the PTCDI-C8 island edge (Figure 5b) appears hazy and indistinct, with the molecules appearing to fade into the graphene background (solid arrows). This difference in edge appearance can likely be explained by the PTCDI-C8 molecules possessing weaker intermolecular interactions, and thus a greater degree of molecular diffusion is observed at island boundaries.
3,4,9,10-perylene-tetracarboxylic dianhydride (PTCDA) and N,N'-dioctyl-3,4,9,10-perylene-tetracarboxylic diimide (PTCDI-C8) interactions. (a) Scanning tunneling microscopy (STM) image of a submonolayer island of PTCDA (right side of image) on clean graphene (left side of image). The PTCDA island boundary is disordered but distinct (V s = –2.0 V, I t = 0.05 nA, scale bar = 10 nm). (b) STM image of a submonolayer coverage of PTCDI-C8, where the PTCDI-C8 domain edge appears to fade into the graphene background, as indicated by arrows (V s = –2.0 V, I t = 0.05 nA, scale bar = 10 nm). (c) Well-defined boundary between PTCDA monolayer (left side) and PTCDI-C8 monolayer (right side) on the same graphene terrace. This sample was prepared by depositing PTCDI-C8 onto a surface with a submonolayer coverage of PTCDA (V s = –2.0 V, I t = 0.05 nA, scale bar = 5 nm). (d) At the initial stages of PTCDI-C8 deposition onto graphene covered by a submonolayer coverage of PTCDA, the PTCDI-C8 molecules accumulate at edges such as PTCDA island edges and substrate step edges (solid arrows). The interaction of PTCDI-C8 with PTCDA also stabilizes the PTCDA edge and results in a series of apparent protrusions (dashed arrows) (V s = –1.5 V, I t = 0.04 nA, scale bar = 10 nm). Adapted from Wang and Hersam.Reference Wang and Hersam54V s, sample bias; I t, tunneling current.

The STM images in Figure 5c and 5d show the result of sequential depositions of ∼0.5 monolayers (ML) PTCDA and ∼0.5 ML PTCDI-C8. The two molecules form separate domains, with the PTCDA first forming islands and then PTCDI-C8 filling in the remaining graphene areas. Figure 5c shows a typical domain boundary between PTCDA and PTCDI-C8 domains, occurring on the same graphene terrace. The tendency for PTCDI-C8 to fill in the graphene areas not covered by PTCDA rather than depositing on top of the PTCDA is consistent with strong in-plane intermolecular interactions relative to molecule-substrate interactions. Similarly, it has been reported that PTCDA forms a full monolayer before growth of a second layer.Reference Huang, Chen, Gao, Chen and Wee80 X-ray reflectivity measurements of the vertical structure of PTCDA layers on epitaxial graphene provide further support for these observations.Reference Emery, Wang, Zarrouati, Fenter, Hersam and Bedzyk86
Figure 5d shows the initial stage of PTCDI-C8 growth on a surface with ∼0.5 ML PTCDA. The PTCDI-C8 molecules have begun to nucleate at the edges of existing PTCDA islands and at graphene/SiC step edges, appearing as a bright, hazy band (solid arrows).Reference Wang and Hersam54 Furthermore, the PTCDI-C8 molecules at the edges of the PTCDA island stabilize the domain boundary and result in a series of apparent protrusions at the interface (dashed arrows). Due to this interaction and stabilization, the boundaries between PTCDA and PTCDI-C8 have also rearranged into a lower-energy linear configuration.
Covalent organic functionalization of graphene
Several methods for covalently functionalizing graphene have been demonstrated. For example, graphene oxide (GO), produced by treating graphite with strong oxidizing agents,Reference Hummers and Offeman87 is among the most widely studied covalent chemistries.Reference Dreyer, Park, Bielawski and Ruoff88 The GO oxidation reaction produces a variety of oxygen-containing functional groups on the graphene surface, including carbonyls, hydroxyls, phenols, and epoxides. While this functionalization allows large volumes of solution-processable material to be produced, GO is electrically insulating and highly defective. Although GO can be reduced by treatment with various physical and chemical methods to form reduced GO (r-GO), many defects remain in r-GO, thus preventing full recovery of the electronic properties of pristine graphene. Nevertheless, GO and r-GO have been used in many applications, such as polymer nanocomposites, graphene oxide paper, transparent conductors, and photovoltaics.Reference Compton and Nguyen89
Covalent modification of graphene with hydrogen changes the sp 2 hybridization to sp 3 and strongly modifies its electronic properties.Reference Elias, Nair, Mohiuddin, Morozov, Blake, Halsall, Ferrari, Boukhvalov, Katsnelson, Geim and Novoselov90–Reference Sessi, Guest, Bode and Guisinger93 STM studies of hydrogen covalently bonded to epitaxial graphene have revealed that the hydrogen coverage is not closely packed and possesses poor ordering.Reference Guisinger, Rutter, Crain, First and Stroscio91 The patterning of hydrogen-modified graphene by STM nanolithography results in recovery of the pristine graphene electronic structure.Reference Sessi, Guest, Bode and Guisinger93
Another emerging covalent chemistry on graphene is the attachment of aryl moieties.Reference Hossain, Walsh and Hersam52, Reference Bekyarova, Itkis, Ramesh, Berger, Sprinkle, de Heer and Haddon94, Reference Niyogi, Bekyarova, Itkis, Zhang, Shepperd, Hicks, Sprinkle, Berger, Lau, de Heer, Conrad and Haddon95 The reduction of aryl diazonium salts at the graphene surface results in covalently attached aryl groups that have been shown to increase the resistivity of the graphene sheet.Reference Bekyarova, Itkis, Ramesh, Berger, Sprinkle, de Heer and Haddon94, Reference Fan, Nouchi, Yin and Tanigaki96 Other covalent modifications of graphene include the attachment of nitrenes,Reference Choi, Kim, Kim, Lee and Kim97 organic free radicals,Reference Choi, Lee, Kim, Kim and Kim98 and dipolar ylides.Reference Quintana, Spyrou, Grzelczak, Browne, Rudolf and Prato99
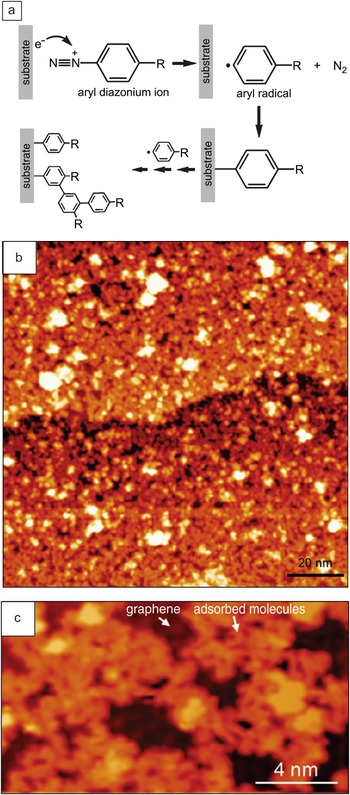
In our laboratory, we have studied the covalent functionalization of epitaxial graphene at the molecular scale with UHV STM following reaction with 4-nitrophenyldiazonium (4-NPD) tetrafluoroborate.Reference Hossain, Walsh and Hersam52 This covalent molecular grafting is performed in a room-temperature solution-phase reaction followed by annealing of the chemically modified sample in UHV at 500°C to remove physisorbed contamination prior to STM imaging.Reference Hossain, Walsh and Hersam52 As shown in the reaction scheme in Figure 6a, the aryl diazonium reduction process begins with the diazonium cation accepting an electron from the graphene surface to form an aryl radical and release of a nitrogen molecule. This radical can then attach covalently to the graphene surface or to existing aryl groups, leading to the formation of aryl oligomer chains.
Previous studies of aryl-modified graphene have not used molecular spatial resolution techniques, so the molecular ordering could not be directly probed. Some reports have suggested that the 4-NPD attachment leads to a closely packed monolayer of vertically oriented aryl groups.Reference Bekyarova, Itkis, Ramesh, Berger, Sprinkle, de Heer and Haddon94, Reference Bekyarova, Itkis, Ramesh and Haddon100 However, through molecularly resolved UHV STM imaging, we observe that the resulting 4-NPD adlayer is sparsely packed due to the presence of aryl oligomers that sterically hinder a more closely packed functionalization.Reference Hossain, Walsh and Hersam52
Aryl diazonium functionalization of epitaxial graphene. (a) Scheme illustrating the reduction of aryl diazonium salts by accepting an electron from the substrate, then releasing a nitrogen molecule and forming an aryl radical. The aryl radical can either covalently attach to the substrate surface or to an existing surface aryl to form oligomers. The “R” group in the schematic can be a variety of organic functional groups. (b) Large-area scanning tunneling microscopy (STM) image of 4-nitrophenyldiazonium (4-NPD) functionalized epitaxial graphene (V s = +2.0 V, I t = 0.05 nA). (c) High-resolution STM image of the 4-NPD functionalized surface, showing regions of unreacted graphene and inhomogeneous oligomer structures (V s = –2.0 V, I t = 0.05 nA). Adapted from Hossain et al.Reference Hossain, Walsh and Hersam52V s, sample bias; I t, tunneling current.

The aryl-modified graphene surface is shown in the representative STM images in Figure 6b and 6c. An atomically flat but inhomogeneous layer of adsorbed molecules is observed (i.e., the molecules are not densely packed, and small patches of unreacted graphene are present). In the high-resolution STM image in Figure 6c, the adsorbed molecules form irregularly shaped chain-like features. These chains resemble the pseudorandom walk configurations of organic chain reactions on silicon surfacesReference Eves, Sun, Lopinski and Zuilhof101 and suggest the formation of aryl oligomers. Following the scheme in Figure 6a, the initial step in the reaction is the direct covalent attachment of an aryl radical to the graphene surface. However, following this step, additional radicals may either attach to the surface or to other aryl groups that are already attached to the surface.Reference Hossain, Walsh and Hersam52 These oligomer chains then lay physisorbed on the graphene surface in an irregular conformation, or possibly protrude away from the surface, leading to the larger features in the STM images in Figure 6b and 6c. The presence of existing aryl groups and aryl oligomers sterically hinder the direct attachment of further aryl groups, resulting in an adlayer that is not densely packed. Since these surface features are stable after annealing at 500°C, they are presumed to be strongly anchored to the graphene surface by at least one covalent attachment site.Reference Hossain, Walsh and Hersam52
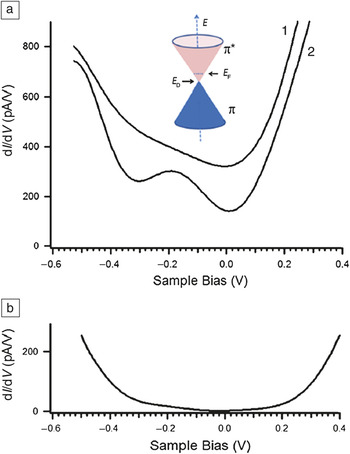
The electronic characteristics of aryl-modified graphene have been measured using STS. The dI/dV spectra from (1) functionalized and (2) pristine regions are shown in Figure 7a. The spectrum of clean graphene (2) shows a minimum at zero sample bias corresponding to the Fermi energy, and a local minimum at –0.3 V corresponding to the Dirac point, where the conduction band and valence band of graphene meet and the density of states vanishes. In contrast, the spectrum of the modified graphene (1) shows only the minimum at zero bias. From hundreds of measured spectra, ∼70% of the dI/dV curves are similar to the spectrum in (1), and ∼25% resemble the pristine spectrum in (2). The remaining ∼5% of spectra have an appearance similar to Figure 7b, where dI/dV approaches zero at zero bias and has a minimum gap opening of ∼0.35 eV.Reference Hossain, Walsh and Hersam52
Scanning tunneling spectroscopy of covalently functionalized epitaxial graphene. (a) Representative differential tunneling conductance (dI/dV) spectra of (1) 4-nitrophenyldiazonium (4-NPD) functionalized epitaxial graphene and (2) unfunctionalized epitaxial graphene, offset –250 pA/V from (1) for clarity. Inset: Band structure of pristine graphene showing the Fermi energy (E F) and Dirac point (E D). (b) Example of an infrequently observed dI/dV spectrum showing the opening of a bandgap on 4-NPD modified graphene. For all spectra, the feedback set point was 0.3 V sample bias and 0.1 nA tunneling current. Adapted from Hossain et al.Reference Hossain, Walsh and Hersam52

This distribution of dI/dV spectra can be explained by considering the inhomogeneous and loosely packed adlayer. The spectrum shown in Figure 7a (1) corresponds to points where an aryl oligomer chain is physisorbed and weakly influences the graphene; spectrum shown in Figure 7a (2) indicates points where the graphene remains unreacted; and spectrum shown in Figure 7b occurs at covalent attachment sites where the sp 2 hybridization has been disrupted, and a bandgap has been opened.Reference Hossain, Walsh and Hersam52 More recently, electrical characterization of graphene devices that have been chemically modified by aryl diazonium attachment have shown increasing resistivity and loss of the Dirac point with an increasing degree of covalent functionalization, consistent with our observation of localized electronic changes at the attachment sites.Reference Fan, Nouchi, Yin and Tanigaki96
UHV STM nanopatterning of organically functionalized graphene
Direct lithographic patterning of graphene has been pursued by researchers using several approaches, including electron beam lithography,Reference Han, Ozyilmaz, Zhang and Kim14 block copolymer templated dry etching,Reference Bai, Zhong, Jiang, Huang and Duan102, Reference Kim, Safron, Han, Arnold and Gopalan103 and scanning probe lithography.Reference Masubuchi, Ono, Yoshida, Hirakawa and Machida17, Reference Weng, Zhang, Chen and Rokhinson104–Reference Alaboson, Wang, Kellar, Park, Elam, Pellin and Hersam106 Many of these efforts were aimed at engineering the quantum confinement of graphene to open a bandgap. However, these early attempts have lacked sufficient spatial resolution to yield atomically well-defined edges that are likely necessary for reproducible and uniform electronic properties.
In our work, we have explored an alternative approach by performing UHV STM nanopatterning of organic adlayers on graphene.Reference Hossain, Walsh and Hersam52, Reference Wang and Hersam54 Rather than directly patterning the graphene sheet itself, we selectively and controllably desorb the molecules that form the organic functionalization layer. Previously, extensive work has been done on the selective desorption of atoms and molecules from semiconductor surfaces.Reference Walsh and Hersam38, Reference Yoder, Guisinger, Hersam, Jorn, Kaun and Seideman45 For chemically functionalized graphene, patterning the organic adlayer offers an analogous approach for controlling the nanoscale characteristics of graphene and is a potential route toward engineering quantum confinement. For example, the patterning of hydrogen-modified graphene using STM nanolithography has shown promise in this direction.Reference Sessi, Guest, Bode and Guisinger93
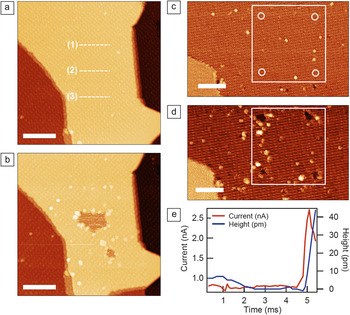
In our laboratory, nanopatterning of PTCDA monolayers on epitaxial graphene has recently been demonstrated as shown in Figure 8.Reference Wang and Hersam54 In Figure 8a and 8b, nanopatterning was accomplished by applying an increased sample bias voltage (–3.6 V) and tunneling current (0.5 nA) while scanning the tip along the paths indicated by the dashed lines shown in the STM image in Figure 8a at 23 nm/s tip speed.Reference Wang and Hersam54 This procedure results in inconsistent nanopatterning, as shown in the STM in Figure 8b, which was taken after the patterning procedure. Along line (1), the procedure resulted in no desorption of PTCDA; along line (2) a 10–15 nm wide patch of PTCDA was desorbed to reveal bare graphene; and line (3) resulted in a small sub-5 nm dot of PTCDA being desorbed. The control and reproducibility of PTCDA nanopatterning was greatly improved by employing feedback-controlled lithography (FCL),Reference Basu, Guisinger, Greene and Hersam24, Reference Walsh and Hersam38, Reference Yoder, Fakonas and Hersam44, Reference Yoder, Guisinger, Hersam, Jorn, Kaun and Seideman45, Reference Hersam, Guisinger and Lyding107 in which a sharp change in the tunneling current that results from a successful desorption event triggers a secondary feedback loop to terminate the nanopatterning. Using FCL, inconsistent desorption that might occur as a result of changes in tip-sample junction or molecule–molecule interactions is actively minimized, resulting in highly reproducible nanopatterning.
Nanopatterning of noncovalently functionalized graphene. (a–b) Nanolithography by patterning horizontal lines without a secondary feedback loop. (a) Initial scanning tunneling microscopy (STM) image of a clean 3,4,9,10-perylene-tetracarboxylic dianhydride (PTCDA) monolayer. The dashed lines (1), (2), and (3) indicate the paths that the tip took while the nanopatterning conditions were applied (i.e., increasing the sample bias and tunneling current). (b) STM image of the resulting surface after nanolithography was performed along the paths indicated in (a). After performing the nanolithography (–3.6 V sample bias, 0.5 nA tunneling current, 23 nm/s tip velocity), the resulting patterns possess poor consistency. (Imaging conditions for (a) and (b): V s = –2.0 V, I t = 0.04 nA, scale bars = 20 nm.) (c–e) Nanolithography by feedback-controlled lithography (FCL). (c) Initial STM image of the clean PTCDA monolayer, with the locations of four FCL dots indicated by circles. (d) The resulting FCL dots after patterning (–4.0 V sample bias, 0.3 nA tunneling current). (Imaging conditions for (c) and (d): V s = –1.85 V, I t = 0.04 nA, scale bars = 15 nm.) (e) Time traces of the tunneling current (red) and tip height (blue) during a typical FCL patterning event. A spike in the tunneling current occurs upon PTCDA desorption and causes a tip retraction, followed by the secondary feedback loop terminating the patterning conditions. Adapted from Wang and Hersam.Reference Wang and Hersam54V s, sample bias; I t, tunneling current.

In Figure 8c and 8d, four dots in a square array were formed by FCL at –4.0 V sample bias, 0.3 nA tunneling current, and 13% threshold change in tunneling current. Time traces of the tunneling current and tip height during a typical FCL patterning event are displayed in Figure 8e, showing the sharp changes that occur upon successful desorption and subsequent termination of the patterning conditions. Systematic exploration of the nanopatterning phase space revealed that PTCDA desorption depends mostly on the applied sample bias, with a desorption threshold at –4.0 ± 0.5 V.Reference Wang and Hersam54
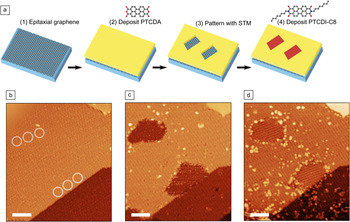
The nanopatterned PTCDA monolayer has subsequently been used as a chemical resist or template as shown in Figure 9. In particular, the procedure for forming heteromolecular nanostructures on graphene is illustrated schematically in Figure 9a, while STM images showing the experimental realization of this process are displayed in Figure 9b–9d. Initially, two nanopatterns were formed on a PTCDA monolayer by a series of FCL dots. PTCDI-C8 was then thermally deposited in situ onto the nanopatterns and was observed to completely fill the patterns with ordered nanoscale domains of PTCDI-C8 constrained by the PTCDA template. In the process of forming the heteromolecular patterns, we note that the shape of the two patterns became more isotropic and symmetric after PTCDI-C8 deposition. This effect results from a combination of the tendency for PTCDI-C8 to stabilize and rearrange the PTCDA edges, as was previously observed (Figure 5d), and radiative sample heating during thermal deposition of PTCDI-C8 that leads to increased molecular surface diffusion.
Heteromolecular nanopatterns on graphene. (a) Schematic illustrating the process of forming heteromolecular nanopatterns. The clean epitaxial graphene surface (1) is noncovalently functionalized by a monolayer of 3,4,9,10-perylene-tetracarboxylic dianhydride (PTCDA) (2). Scanning tunneling microscopy (STM) nanopatterning is then used to create patterns in the PTCDA monolayer, revealing clean graphene (3). Finally, a second molecule, PTCDI-C8, is selectively deposited onto the patterned regions (4). (b) STM image of the starting PTCDA monolayer (corresponding to step 2). The circles indicate the locations of the feedback-controlled lithography (FCL) dots used to make the patterns. The FCL patterning conditions were –4.6 V sample bias and 0.5 nA tunneling current. (c) STM image after FCL patterning (step 3). (d) STM image following deposition of PTCDI-C8, which forms ordered monolayers inside the patterned regions (step 4). For all STM images, V s = –1.8 V, I t = 0.02 nA, and scale bars are 10 nm. Adapted from Wang and Hersam.Reference Wang and Hersam54V s, sample bias; I t, tunneling current.

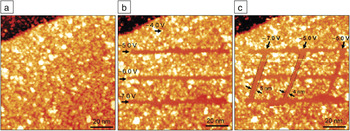
We have also explored STM-induced nanopatterning of aryl-modified graphene, as shown in Figure 10.Reference Hossain, Walsh and Hersam52 The initial covalently modified surface of Figure 10a was patterned by applying elevated tunneling conditions (1.0 nA tunneling current and –4.0 V to –7.0 V sample bias) while moving the tip at a constant speed of 10 nm/s, resulting in the horizontal lines in Figure 10b. Additional vertical lines were patterned at similar conditions as seen in Figure 10c. The molecules are cleanly desorbed under these conditions, revealing clean graphene nanoribbons with widths at or below ∼5 nm. Additional nanopatterning trials revealed that the desorption threshold occurs at a sample bias of –5.0 V and a tunneling current of 1.0 nA. Since nanopatterning is not observed to occur at positive sample bias, the desorption mechanism likely involves inelastic scattering of tunneling holes via a σ hole resonance.Reference Stokbro, Thirstrup, Sakurai, Quaade, Hu, Perez-Murano and Grey108 The patterning line width is observed to be essentially independent of the nanopatterning conditions above threshold, as lines ∼5 nm wide are consistently achieved. Furthermore, it appears that the line roughness is limited by the inhomogeneous nature of the 4-NPD adlayer rather than the nanopatterning itself.
Nanopatterning of covalent functionalization. (a) Scanning tunneling microscopy (STM) image of the initial aryl-functionalized epitaxial graphene surface. (b) Three horizontal lines were patterned by STM nanolithography at applied sample voltages of –5.0 V, –6.0 V, and –7.0 V. The line at –4.0 V was below the desorption threshold and did not result in patterning. The tunneling current was 1.0 nA, and the tip velocity was 10 nm/s for all lines. (c) Three vertical lines patterned using similar nanolithography conditions. Sub-5 nm line widths are indicated. (Imaging conditions for all images: V s = +1.85 V, I t = 0.06 nA.) Adapted from Hossain et al.Reference Hossain, Walsh and Hersam52V s, sample bias; I t, tunneling current.

Both theoretical and experimental reports have indicated the existence of a bandgap in graphene nanoribbons with widths below 10 nm due to quantum confinement.Reference Han, Ozyilmaz, Zhang and Kim14 However, dI/dV spectra taken within the nanopatterned ribbons did not reveal this phenomenon.Reference Hossain, Walsh and Hersam52 The relatively sparse concentration of covalent attachment sites for 4-NPD implies weak electronic contrast between the functionalized and patterned graphene regions, apparently leading to insufficient quantum confinement for bandgap formation.
Conclusions, prospects, and challenges
We have shown that ultrahigh vacuum scanning tunneling microscopy (UHV STM) is a powerful tool for characterizing and manipulating organically functionalized graphene at the molecular scale. Noncovalent functionalization schemes have been demonstrated using large planar molecules with extended π-electron systems that interact with graphene by π–π* stacking and form well-ordered monolayers. Using the molecules PTCDA and PTCDI-C8, intermolecular interactions between adjacent molecules have been found to influence the geometry of the molecular ordering as well as the stability of the monolayer. Noncovalent monolayers on graphene do not strongly perturb the electronic properties of graphene and can thus be used as highly uniform and conformal adhesion layers for subsequent chemistries. Covalent functionalization with the aryl diazonium salt 4-NPD has also been studied by UHV STM and scanning tunneling spectroscopy (STS), resulting in an inhomogeneous layer of covalently bound molecules and oligomers that locally induce the opening of a bandgap in graphene.
The controlled desorption of both covalent and noncovalent functionalizations by UHV STM nanolithography has also been explored. PTCDA and 4-NPD were desorbed by applying elevated negative sample biases and increased tunneling currents. For PTCDA, inconsistencies in patterning resolution were overcome with feedback-controlled lithography. The resulting PTCDA patterns were then used as chemical resists for the deposition of PTCDI-C8. For 4-NPD, STM nanolithography resulted in clean patterns that are only limited by the inhomogeneity of the original aryl attachment. Both PTCDA and 4-NPD nanopatterns revealed pristine graphene domains at the sub-5 nm scale.
In the rapidly developing field of graphene chemistry, UHV STM is expected to play an important and unique role in molecularly resolved characterization. The spatial organization of chemically functionalized graphene will be directly revealed via STM, while STS will allow the electronic density of states to be spatially mapped. Future challenges for the field lie in identifying new chemistries, both covalent and noncovalent (and combinations thereof), that can stably functionalize and/or passivate graphene, controllably modulate the electronic properties of graphene, and alter its interaction with the external environment. Ultimately, this fundamental insight will inform ongoing efforts to realize and optimize a variety of graphene-based technologies, including nanoelectronics, optoelectronics, biological and chemical sensors, and energy conversion and storage devices.
Acknowledgments
This work was supported by the National Science Foundation (Award Numbers EEC-0647560 and DMR-0520513), the Office of Naval Research (Award Number N00014-09-1-0180), and the Department of Energy (Award Number DE-SC0001785).
 Qing Hua Wang is currently a postdoctoral research associate in chemical engineering at the Massachusetts Institute of Technology. She received her BASc degree in Engineering Science at the University of Toronto in 2005, and her PhD degree in Materials Science and Engineering at Northwestern University in 2010. Her research interests include self-assembled nanostructures, graphene, chemical functionalization of surfaces, and scanning probe microscopy. Wang can be reached at the Department of Chemical Engineering, Massachusetts Institute of Technology, Cambridge, MA 02139, USA; and email qhwang@mit.edu.
 Mark C. Hersam is currently a professor of Materials Science and Engineering, Chemistry, and Medicine at Northwestern University. He earned a BS degree in electrical engineering from the University of Illinois at Urbana-Champaign (UIUC) in 1996, an M.Phil. in physics from the University of Cambridge in 1997, and a PhD degree in electrical engineering from UIUC in 2000. In 1999, he performed research at the IBM T.J. Watson Research Laboratory under the support of an IBM Distinguished Fellowship. His research interests include single molecule chemistry, nanofabrication, scanning probe microscopy, semiconductor surfaces, and carbon nanomaterials. Hersam has received numerous awards and was directly promoted from assistant professor to full professor with tenure in 2006. In 2007, Hersam co-founded NanoIntegris, which is a startup company focused on supplying high-performance carbon nanomaterials. He is chair of the AVS Nanometer-Scale Science and Technology Division and associate editor of ACS Nano. Hersam can be reached at the Materials Science and Engineering Department, Northwestern University, Evanston, IL 60208-3108 USA; tel. 847-491-2696; and email m-hersam@northwestern.edu.