1 Introduction
A shock train is a complex system of shock and compression waves that decelerates a supersonic flow in a duct. If the duct is sufficiently long, the shock train is followed by a mixing region where a heterogeneous supersonic–subsonic velocity distribution causes additional static pressure rise. The entire region from the beginning of the shock train to the end of the mixing region is called the pseudoshock. In high-speed air-breathing engines, such as dual-mode scramjets, the pseudoshock is housed in a short duct called the isolator. Its role is to decelerate the incoming supersonic flow and provide the necessary static pressure rise for efficient combustion downstream.
Pseudoshocks have been studied extensively ever since Crocco (Reference Crocco and Emmons1958) pointed out that the supersonic-to-subsonic transition in ducted flows is a gradual flow diffusion process, not a single normal shock as predicted by inviscid theory. In particular, much has been learned about the steady-state pseudoshock, including its complex dependence on the isolator geometry and boundary conditions (i.e. the approach flow conditions just upstream of the shock train and the downstream combustor conditions). These dependencies are important to understand because they directly influence the isolator performance. For example, increasing the pressure ratio (defined as the ratio of back pressure to the approach flow pressure) makes the compression system longer by pushing the shock train upstream (Waltrup & Billig Reference Waltrup and Billig1973). The additional static pressure gain is beneficial for the combustion process, but the longer pseudoshock requires a longer (and heavier) isolator. Excessive heat release in the combustor may also generate a pressure rise that is too large for the pseudoshock to accommodate, causing the shock train to propagate upstream into the inlet in a transient process known as engine unstart. In extreme cases, the shock train is disgorged from the inlet, leading to a loss of engine thrust and increased aerodynamic loads (Rodi, Emami & Trexler Reference Rodi, Emami and Trexler1996; Wagner et al. Reference Wagner, Yuceil, Valdivia, Clemens and Dolling2009).
Several other parameters influence the steady-state pseudoshock in addition to the pressure ratio. The approach Mach number is a critical parameter, with high Mach number flows producing long shock trains composed of oblique shock waves and low Mach number flows producing short shock trains composed of normal shocks (Ikui, Matsuo & Nagai Reference Ikui, Matsuo and Nagai1974a ; Carroll & Dutton Reference Carroll and Dutton1990). The degree of flow confinement just upstream of the shock train (defined as the ratio of a boundary layer spatial scale to duct half height) has a secondary effect on the pseudoshock (Nill & Mattick Reference Nill and Mattick1996; Sun et al. Reference Sun, Sugiyama, Mizobata and Fukuda2003). A computational study by Fiévet et al. (Reference Fiévet, Koo, Raman and Auslender2017) shows that reducing the boundary layer thickness leads to stronger shocks, fewer shocks in the train and a downstream displacement of the leading shock. Other studies emphasize the importance of the isolator geometry. Low aspect ratio isolators produce more three-dimensional shock structures with a high degree of symmetry (Handa, Masuda & Matsuo Reference Handa, Masuda and Matsuo2005; Hunt & Gamba Reference Hunt and Gamba2018). These highly confined flows have prominent corner effects that lead to a more gradual compression process (Cox-Stouffer & Hagenmaier Reference Cox-Stouffer and Hagenmaier2001; Geerts & Yu Reference Geerts and Yu2016). In computational studies, the three-dimensionality and side wall effects are important factors that influence the accuracy of models (Morgan, Duraisamy & Lele Reference Morgan, Duraisamy and Lele2014).
Overall, the steady-state shock train is complex and it depends on a multitude of parameters, many of which have been summarized by Matsuo, Miyazato & Kim (Reference Matsuo, Miyazato and Kim1999) and Gnani, Zare-Behtash & Kontis (Reference Gnani, Zare-Behtash and Kontis2016). These dependencies are used to develop one-dimensional empirical and analytical models for predicting isolator performance (Ikui, Matsuo & Sasaguchi Reference Ikui, Matsuo and Sasaguchi1981; Smart Reference Smart2015). One of the most widely used empirical models, proposed by Waltrup & Billig (Reference Waltrup and Billig1973), uses the approach flow properties to describe the pressure distribution along the length of the pseudoshock as follows:
 $$\begin{eqnarray}\frac{x(M_{a}^{2}-1)Re_{\unicode[STIX]{x1D703}}^{1/4}}{\sqrt{D\unicode[STIX]{x1D703}}}=50\left(\frac{p}{p_{a}}-1\right)+170\left(\frac{p}{p_{a}}-1\right)^{2},\end{eqnarray}$$
where
 $M_{a}$
is the approach Mach number,
 $Re_{\unicode[STIX]{x1D703}}$
is the approach Reynolds number,
 $\unicode[STIX]{x1D703}$
is the momentum thickness of the approach boundary layer,
 $D$
is the duct diameter,
 $p_{a}$
is the approach flow pressure and
 $p$
is the pressure at a streamwise distance
 $x$
from the shock train foot. The Waltrup & Billig (Reference Waltrup and Billig1973) model is particularly impactful because it shows that the pseudoshock is self-similar in some sense, and although the flow field is complex and not fully understood, its properties scale with the isolator dimensions and the approach flow conditions. Aspects of this scaling argument are also used in the current work.
More recently, research has shown how the isolator operability range is impacted by transient pseudoshock processes induced by changing the isolator boundary conditions. There is a particular focus on understanding, detecting and preventing engine unstart due to its devastating effects on engine performance (Wagner et al. Reference Wagner, Yuceil, Valdivia, Clemens and Dolling2009; Srikant et al. Reference Srikant, Wagner, Valdivia, Akella and Clemens2010; Do et al. Reference Do, Im, Mungal and Cappelli2011; Koo & Raman Reference Koo and Raman2012; Valdivia et al. Reference Valdivia, Yuceil, Wagner, Clemens and Dolling2014). Wagner et al. (Reference Wagner, Yuceil, Valdivia, Clemens and Dolling2009), Wagner, Yuceil & Clemens (Reference Wagner, Yuceil and Clemens2010) demonstrated that separation bubbles at the foot of the shock train control the unstart progression, with the shock train propagating upstream through the isolator at an average rate of 0.035 times the free-stream flow velocity. The shock system propagates faster in regions with high adverse pressure gradients.
Another transient process, called the forced shock train dynamics, occurs when the shock train responds to changes in the isolator boundary conditions that are relatively small and do not induce unstart. As Fiévet et al. (Reference Fiévet, Koo, Raman and Auslender2017) describes, this motion is non-trivial and depends on the excitation frequency. For high frequencies, the shock system behaves like an anharmonic oscillator and two physical processes contribute to a resonance phenomenon: (i) there is a phase lag between the shock train’s foot and tail; and (ii) shock strength varies with location, thus fewer shocks are present as the shock train moves downstream. More studies are emerging on this topic because these changes happen in many practical situations as the vehicle follows its flight trajectory (Su, Ji & Chen Reference Su, Ji and Chen2016; Xiong et al. Reference Xiong, Fan, Wang and Tao2018).
The subject of the current work is a distinctly different transient process that we call shock train inherent unsteadiness, which are self-excited fluctuations of the shock train about its time-averaged position even with constant bulk inflow and outflow isolator conditions. Few studies have examined this transient phenomenon, sometimes referred to as self-excited oscillation, leaving the topic mostly unexplored. To date, the mechanism that causes the inherently unsteady motion is unclear and cannot be reliably predicted or modelled. Thus, it is not obvious how to mitigate the unsteadiness. The unsteady movement of the shock train is of practical importance because it may feed instabilities to the combustor and induce pressure fluctuations that generate noise and intense fluctuating wall loads. Large fluctuation amplitudes may also reduce the operating margin of the engine by causing premature engine unstart. Quantifying and understanding the unsteady shock motion is useful for improving predictive modelling tools, developing strategies to reduce unsteadiness and validating computational work.
Despite a general lack of understanding, the existence of shock train inherent unsteadiness is widely noted in the literature. Some experimental studies of shock trains in constant area isolators report shock displacements reaching up to a duct height (Ikui et al. Reference Ikui, Matsuo, Nagai and Honjo1974b ; Lindstrom et al. Reference Lindstrom, Davis, Williams and Tam2009). In computational studies, inherent unsteadiness is widely recognized as an expensive, complicating factor that makes accurate, time-resolved simulations difficult to achieve (Gawehn et al. Reference Gawehn, Gulhan, Al-Hasan and Schnerr2010). This is in part because the underlying fundamental flow physics that govern the process are not well understood, and therefore not easily modelled. To date, only three principal theories have been presented to explain the unsteady shock motion. These studies examine a shock train in a constant area isolator model and attribute the unsteadiness to perturbations (i.e. fluid phenomena) that interact with the shock system as they travel through the flow. However, the theories are clearly distinguished from one another because they propose different regions of the flow field where perturbations are generated.
Ikui et al. (Reference Ikui, Matsuo, Nagai and Honjo1974b ) were among the first to present a theory on shock train inherent unsteadiness. Using schlieren photography, they observe the leading shock fluctuating before the second shock in the train. They also measure wall static pressure fluctuations in the flow upstream of the shock train. Given this experimental data and a one-dimensional viscous adiabatic flow model for a single normal shock, they conjecture that the shock train unsteadiness is due to the interaction of the leading shock with small perturbations in the upstream supersonic flow. However, the authors do not show a direct correlation between upstream pressure fluctuations and shock motion.
Yamane et al. (Reference Yamane, Kondo, Tomita and Sakae1984a ) conjecture that the shock train fluctuations are caused by a downstream acoustic resonance. This is based on experimental work using a variable length blowdown wind tunnel, where the shock train exhibits large position displacements when the isolator duct is short. The shock position displacements decrease for long ducts that are choked at the exit, suggesting that the system is isolated from the downstream influence. In their follow-up study (Yamane, Takahashi & Saito Reference Yamane, Takahashi and Saito1984b ), cross-correlations of pressure measurements show both downstream and upstream propagating perturbations. Given the speed of these perturbations, the authors hypothesize that pressure waves are generated downstream and travel upstream through the boundary layer, later inducing the downstream perturbation that is convected with the flow. This theory has emerging evidence of multiple perturbation pathways, but the connection to the downstream acoustic resonance does not fully explain the observed unsteadiness because the shock train still exhibits unsteady fluctuations in a choked duct.
Sugiyama et al. (Reference Sugiyama, Takeda, Zhang, Okuda and Yamagishi1988) suggest that the source of unsteadiness is within the shock train. Using schlieren images, they find that the boundary layer thickness under the first shock is weakly correlated with the shock position. The authors describe an aerodynamic ‘throat’ effect where the low-momentum boundary layers act as a converging–diverging nozzle. This is a new and plausible theory but with insufficient evidence because the cross-correlation between boundary layer thickness and shock position is weak (the maximum cross-correlation amplitude is less than 0.2). The authors also fail to explain why the boundary layer thickness is changing. A few investigations have noted that the shock train may sometimes switch between a symmetric and an asymmetric structure, which impacts the boundary layer shape and supports the hypothesis that shock train unsteadiness is caused by a local phenomenon (Gawehn et al. Reference Gawehn, Gulhan, Al-Hasan and Schnerr2010; Xiong et al. Reference Xiong, Wang, Fan and Wang2017). However, this phenomenon only occurs in select facilities.
In this work, a comprehensive theory explaining the shock train inherent unsteadiness is constructed by combining some of the previous theory with new experimental observations. Advanced diagnostic and analysis tools are used to describe this new theory in terms of the complex, frequency-dependent system of perturbations that interact with the shock train. The foundation of our theory is constructed from cross-spectral analysis on high-speed pressure and shock position measurements. Cross-spectral analysis is a well-established signal-analysis tool used to investigate the relationship between simultaneously recorded signals and has been applied to a variety of topics. In our application, cross-spectral analysis is particularly powerful for identifying and investigating multiple perturbations characterized by specific frequency ranges. Cross-spectral analysis also provides detailed information on the perturbation history, including where it originates, the direction it travels and how it influences the shock motion. Oil flow visualization and PIV are then used to confirm what fluid phenomena generate the perturbations. By gathering the above information, we are able to track the evolution of the unsteady shock train and develop a strong cause-and-effect relationship between the perturbation sources and the shock motion. Thus, a fundamental understanding of the shock train inherent unsteadiness is established.
2 Experimental set-up
2.1 Direct-connect isolator model
The current experiments are performed in a low aspect ratio direct-connect isolator model at the University of Michigan. The isolator is a component of a suction type wind tunnel facility illustrated schematically in figure 1. Room air passes through an intake and a flow conditioning section before it is expanded through a one-sided converging–diverging nozzle to produce a nominal free-stream Mach number of 2.0 in the isolator. As demonstrated by the figure, the origin of the right-handed coordinate system is located at the nozzle throat, on the lower right corner of the cross-section as one looks downstream. The
 $x$
,
 $y$
and
 $z$
coordinate directions are oriented in the direction of the bulk fluid flow, normal to the side wall and normal to the bottom wall, respectively. The low aspect ratio isolator begins approximately
 $5.1H$
downstream of the nozzle throat and has a constant, rectangular cross-section measuring 57.2 mm in width (
 $W$
) and 69.3 mm in height (
 $H$
).
Downstream of the isolator is a diffuser leading to a butterfly valve and then a vacuum chamber. This butterfly valve is referred to as the control valve of the isolator. By partially closing the control valve, the downstream area for airflow is reduced leading to an increase in the downstream pressure, called the diffuser pressure. The elevated diffuser pressure essentially replicates the pressure condition that would exist in the combustor of a real engine. As a result, a shock train is produced in the isolator. Further closing the control valve will increase the diffuser pressure and cause the shock train to move upstream in the isolator. In this study, the valve angle is constant for the entire duration of the run and is monitored using a high-resolution optical incremental encoder.
Capacitance manometers (MKS 626C Baratron), located on the centreline of the top wall, are used to monitor the boundary conditions of the isolator including (i) the inflow pressure at the beginning of the isolator,
 $p_{in}$
, (ii) the back pressure at the end of the isolator and (iii) the diffuser pressure just upstream of the control valve. The manometers have an accuracy of 0.25 % of the reading and a response time of 20 ms. Once the angle of the control valve is set, the inflow and diffuser pressure measurements exhibit minimal fluctuations (less than 1 % of their respective time-averaged values) and verify that the bulk inflow and outflow conditions of the isolator are constant. The back pressure exhibits higher fluctuations (up to 5 % of its time-averaged value) due to turbulence generated in the pseudoshock mixing region, but it has a sensitive linear relationship with the shock train location (Hunt & Gamba Reference Hunt and Gamba2018).
Schematic diagram of the direct-connect isolator facility (side view).

Fourteen runs are used to formulate the results of this work. The experimental conditions are approximately constant from run to run, and thus the shock train is positioned at a consistent location in the isolator that is optimal for diagnostic testing. Given the location of the shock train from schlieren imaging (see § 2.2), the approach conditions are defined as the flow conditions just upstream of the leading shock foot. Refer to our previous work (Hunt & Gamba Reference Hunt and Gamba2018) for a detailed discussion on how these conditions are quantified. Table 1 summarizes the experimental conditions of this study, including the measurement uncertainty and the run-to-run range.
Summary of important experimental conditions.

a Uncertainty estimated from error propagation rule.
b Uncertainty based on measurement accuracy.
2.2 High-speed schlieren imaging
Schlieren imaging is used to visualize the temporal evolution of the shock train. Borosilicate glass side walls provide optical access along the entire length of the isolator and a
 $z$
-type schlieren set-up with a horizontal knife edge captures vertical density gradients in the flow. A high brightness LED (Luminus SBR-70) is used as a continuous light source. Images are recorded at a rate of 10 kHz using a Phantom v711 camera with an exposure time of
 $1~\unicode[STIX]{x03BC}\text{s}$
. The image resolution is
 $800\times 240$
px. The camera field of view covers approximately
 $0.9H$
in the
 $z$
-direction and
 $3.4H$
in the
 $x$
-direction.
An example instantaneous schlieren image of the shock train is shown in figure 2. The vertical axis is labelled in terms of
 $z/H$
, the distance from the bottom wall normalized by the tunnel height. Similarly, the top horizontal axis is labelled in terms of
 $x/H$
, the non-dimensional distance from the wind tunnel throat. This coordinate system is used to describe the pseudoshock position in the isolator and to define the approach conditions. For comparison, the bottom horizontal axis is labelled in terms of
 $x^{\ast }$
, the relative distance from the time-averaged location of the leading shock foot, i.e.
 $x^{\ast }=x-x_{f}$
. For illustration purposes, the instantaneous schlieren image shown in the figure is selected so that the instantaneous and time-averaged shock foot locations are approximately equal. Generally, the instantaneous shock foot location fluctuates around
 $x^{\ast }=0$
due to the inherent unsteadiness of the system. Also, note that
 $x^{\ast }$
is normalized by the pseudoshock length,
 $L$
, which is defined in this work as the distance from the leading shock foot to the location of the control valve and is equal to approximately
 $21.15H$
. For the current experimental set-up, the defined pseudoshock length includes the entire shock train (contained in the isolator), the portion of the mixing region in the isolator, and the portion of the mixing region that develops into the diffuser. Alternatively,
 $L$
can be described as the distance from the shock foot in the isolator to the downstream choke point. The
 $x^{\ast }/L$
coordinate system is useful for describing the location of measurements relative to the overall pseudoshock structure and is used frequently throughout this work.
The instantaneous streamwise locations of 10 shock train morphological features are marked in figure 2:
 $x_{1c}$
, the location of the leading shock Mach stem;
 $x_{1l}$
and
 $x_{1r}$
, the location where the leading and trailing legs of the first shock lambda foot intersect the bottom wall boundary layer, respectively;
 $x_{2t}$
and
 $x_{2b}$
, the location where the second shock intersects the top and bottom wall boundary layer, respectively;
 $x_{2c}$
, the location where the left- and right-running components of the second shock intersect;
 $x_{3t}$
and
 $x_{3b}$
, the location where the third shock intersects the top and bottom wall boundary layer, respectively;
 $x_{4t}$
and
 $x_{4b}$
, the location where the fourth shock intersects the top and bottom wall boundary layer, respectively. By locating these 10 morphological features in each schlieren image, the time history of the shock position fluctuations,
 $x_{i}^{\prime }$
with
 $i\in \{1c,1l,1r,2c,2b,2t,3b,3t,4b,4t\}$
, are obtained and used for analysis.
Instantaneous schlieren image demonstrating the morphological features of the shock train that are tracked in time.

2.3 High-speed pressure measurements
High-speed wall static pressure measurements are taken with five high-sensitivity absolute pressure transducers (Kulite XCS-062) in order to track the development of perturbations. The Kulite transducers have a pressure range of 103 kPa and a diaphragm resonance frequency of approximately 200 kHz. The signals are amplified, low pass filtered at 50 kHz, then sampled at 200–500 kHz. All five transducers are simultaneously sampled, which allows the time delay between fluctuations measured by different transducers to be accurately quantified.
Each pressure transducer has a diameter of
 $0.02H$
and is inserted into cylindrical housing with a diameter of
 $0.11H$
. The transducers are then flush mounted in the aluminium side or bottom wall of the isolator. Thus, simultaneous side and bottom wall pressure measurements are possible. Alternatively, glass side walls are used for simultaneous schlieren imaging and bottom wall pressure measurements. The aluminium bottom wall contains 46 pressure ports: 40 pressure ports spaced
 $0.16H$
apart along
 $y=W/2$
and six pressure ports spaced
 $0.47H$
apart along
 $y=0.89W$
. This streamwise transducer spacing corresponds to 0.7 % and 2.2 % of the pseudoshock length,
 $L$
, for the centreline and corner ports, respectively. The aluminium side wall contains 20 pressure ports: 10 pressure ports spaced
 $0.31H$
apart along
 $z=0.09H$
and 10 pressure ports spaced
 $0.31H$
apart along
 $z=0.60H$
. The
 $0.31H$
transducer spacing corresponds to 1.5 % of
 $L$
. The five Kulite transducers are positioned at any arbitrary combination of the 66 port choices and the remaining ports are filled with blank housings.
2.4 Oil flow visualization
Oil flow visualization is used to gain insight into the flow structure on the walls of the isolator. For this diagnostic, the bottom wall and the
 $y=0$
side wall of the isolator are replaced with aluminium pieces that have been painted black. For each test, a thin base coat of Xiameter PMX-200 silicone oil is applied to these walls. Then, a mixture of oil and titanium dioxide is spattered over the base coat. When the wind tunnel is started and the valve is partially closed, the oil is pulled in the direction of the flow field generated by the shock train. Glass is used for the
 $y=W$
side wall for optical access. Two cameras recording at 100 Hz are used to simultaneously image the oil pattern development on the painted walls. The procedure was repeated for oil viscosities ranging from 20 to 350 cSt and the observed flow pattern was found to be independent of the oil viscosity used.
2.5 Two-component particle image velocimetry
Two-component PIV is used to quantify the streamwise (
 $u$
) and vertical (
 $w$
) flow velocities on an
 $x$
–
 $z$
plane in the isolator. Figure 3 schematically illustrates the experimental set-up for this diagnostic. A portable Laskin nozzle aerosol generator (ATI Model TDA-4B) is used to seed the flow with polydispersed submicrometre particles composed of poly-alpha-olefin oil with a density of
 $819~\text{kg}~\text{m}^{-3}$
. The particle diameter is approximately
 $0.7~\unicode[STIX]{x03BC}\text{m}$
, which corresponds to a Stokes number of 0.16 for the flow conditions in the isolator. According to Samimy & Lele (Reference Samimy and Lele1991), this Stokes number is low enough that the particles are expected to track the large-scale motions of the compressible flow. The particle tracking error is most significant in regions with large velocity gradients. Based on the particle relaxation distance, the uncertainty in locating the shock front and separation contours is estimated to be
 $0.03H$
. This relatively small uncertainty does not impact the results discussed later on.
Double-pulse illumination of the particles is provided by a pair of low-repetition-rate frequency-doubled Nd:YAG lasers. Each laser produces a 532 nm beam with a pulse duration of approximately 10 ns and a pulse energy of 150–200 mJ. The time delay between pulses from the two lasers is 600–1800 ns depending on the run conditions. For each run, this time delay is measured with a fast response photodiode (Thorlabs DT10A, 1 ns response time) and a digital oscilloscope (LeCroy Waverunner 6030, 350 MHz). Both laser beams are sent through a combination of cylindrical lenses to generate a laser sheet that illuminates a long streamwise section of the isolator. With reference to figure 3, lens L1 is a plano-convex lens that reduces the laser sheet thickness. Lens L2 is a plano-concave lens that expands the beam into a diverging sheet. Directly after lens L2 is a flat mirror that directs the diverging laser sheet through a glass insert in the bottom wall of the isolator. The particles illuminated by the laser sheet are imaged using four interline transfer charge-coupled device cameras (SensiCam PCO) recording at 3.33 Hz. The cameras have a resolution of 1280
 $\times$
1024 pixels and are arranged side-by-side to obtain measurements across a wide field of view.
Schematic diagram of the PIV experimental set-up (top view).

LaVision DaVis 8 software is used to process the data. Two-component velocity fields are reduced from the particle images using a multipass scheme. The interrogation window for each pass has Gaussian weighting and 75 % overlap. The final
 $32\times 32$
pixel window size corresponds to a projected physical size of approximately
 $0.022H\times 0.022H$
and results in vector spacing of
 $0.005H\times 0.005H$
. Post-processing within multiple passes includes deleting a vector if its correlation value is less than 0.8 or the first-to-second correlation peak ratio is less than 1.1. In addition, groups with less than five vectors are removed. Valid vectors are found more than 95 % of the time. Missing or rejected vectors are interpolated using the method by Garcia (Reference Garcia2010). No additional smoothing is applied after interpolation. The estimated uncertainty of the
 $u$
- and
 $w$
-velocity components is 24.5 and
 $13.3~\text{m}~\text{s}^{-1}$
, respectively. These uncertainties correspond to 2.7 %–4.9 % of the approach flow velocity.
Finally, the post-processed velocity fields from the four cameras are stitched together. The resulting field of view extends approximately
 $3.10H$
in the
 $x$
-direction and
 $0.68H$
in the
 $z$
-direction, starting just
 $0.03H$
above the bottom wall. The region closest to the bottom wall is excluded from the field of view due to the interference of diffuse surface reflections. In this work, the velocity fields of two
 $x$
–
 $z$
planes are presented. Measurement plane CL is located at
 $y=W/2$
and measurement plane SW is located at
 $y=0.16W$
(i.e. near the side wall). The labels ‘CL’ and ‘SW’ stand for ‘centreline’ and ‘side wall’, respectively. Figure 4 schematically illustrates the location and orientation of these measurement planes in the isolator.
Schematic diagram illustrating the PIV measurement plane locations.

3 Orderly response of shock waves in the train
In this section, the frequency content of the shock position fluctuations is first presented to characterize the motion of different morphological features. Then, the order in which shocks fluctuate is determined using cross-spectral analysis. Thus, the shock system inherent unsteadiness is described in terms of the shock motion temporal evolution in relation to the other shocks. While perturbations are not identified in this section, the information presented here describes the shock system response to perturbations.
3.1 Frequency content of the shock motion and the definition of characteristic frequency
The power spectral density of each shock position fluctuation time trace,
 $PSD(x_{i}^{\prime })$
, is plotted as a function of frequency,
 $f$
, in figure 5. For clarity, panels (a) through (d) of the figure show the results for shocks 1, 2, 3 and 4, respectively. Each curve represents the average spectrum across all 14 runs conducted under similar conditions. The shaded regions in panel (a) of the figure are examples of the run-to-run range, which is defined at each frequency using the local maximum and minimum values within the dataset of 14 runs. These examples demonstrate that the results, including minor modes at high frequencies, are very repeatable.
The data in figure 5 are presented in non-dimensional form. The frequency,
 $f$
, is normalized by a characteristic frequency defined as follows:
 $$\begin{eqnarray}f_{c}=u_{a}/L,\end{eqnarray}$$
where
 $u_{a}$
is the approach velocity and
 $L$
is the length of the pseudoshock. Similarly, the power spectral density is normalized by
 $f_{c}$
and the shock position variance,
 $\unicode[STIX]{x1D70E}^{2}(x_{i})$
. For this work,
 $f_{c}$
is approximately equal to 337 Hz. In the definition of
 $f_{c}$
, the pseudoshock length is chosen as a characteristic scale because it describes the overall state of the system. Recall from § 1 that a given diffuser pressure is associated with a specific pseudoshock length such that the approach flow conditions can be processed by the shock system to match the downstream boundary condition. Thus,
 $L$
represents the relationship between the upstream and the downstream boundary conditions. The free-stream approach velocity is chosen as a characteristic scale in (3.1) because numerous studies in the literature emphasize that this quantity influences the rates of many relevant fluid processes (e.g. boundary layer growth, vortex shedding, etc.). In particular, there is a similar large-scale, low-frequency unsteadiness observed in many single shock wave boundary layer interactions (SBLI), such as those induced by compression ramps, reflected shocks and blunt-fin interactions, that has been found to depend on the free-stream flow velocity (Dussauge, Dupont & Debieve Reference Dussauge, Dupont and Debieve2006; Clemens & Narayanaswamy Reference Clemens and Narayanaswamy2014). Based on the above reasoning, the characteristic frequency is first introduced in figure 5 to motivate the discussion on how to best scale the shock train inherent unsteadiness properties. As the results used to develop the inherent unsteadiness theory are discussed, the fluid phenomena that cause the unsteadiness become better understood and it is clear that a scaling argument based on
 $L$
and
 $u_{a}$
is a logical choice. The scaling argument is then revisited in § 7.
Normalized power spectral density of shock position fluctuations for the 10 morphological features marked in figure 2.

Consider the frequency content of the leading shock position fluctuations shown in figure 5(a). The leading shock Mach stem fluctuations,
 $x_{1c}^{\prime }$
, are relatively broadband with the majority of the power confined to low frequencies. There are no significant local modes that would indicate a preferred frequency in the shock motion. In comparison, the fluctuations exhibited by legs of the leading shock lambda foot,
 $x_{11}^{\prime }$
and
 $x_{1r}^{\prime }$
, have more content at frequencies above
 $1f_{c}$
. Additionally, a local mode is emerging in these spectra at approximately
 $4f_{c}$
, indicating that this specific frequency is more prominent in the shock motion. Many studies in the literature have noted the dominant low-frequency motion of the shock train. Some studies observe preferred modes but the frequency ranges of these modes are inconsistent from one study to the next (Yamane et al.
Reference Yamane, Kondo, Tomita and Sakae1984a
; Sugiyama et al.
Reference Sugiyama, Takeda, Zhang, Okuda and Yamagishi1988; Lindstrom et al.
Reference Lindstrom, Davis, Williams and Tam2009). Differences in the flow conditions and isolator geometry may contribute to the variation in the shock position fluctuation content. The above discussion on power spectra also demonstrates that different parts of a shock may exhibit different fluctuation content which can contribute to the scatter in observations from different studies.
Next, consider the frequency content of the second shock position fluctuations. Similar to the leading shock Mach stem, the spectra of
 $x_{2c}^{\prime }$
and
 $x_{2b}^{\prime }$
have no significant local modes. However, the motion of the second shock morphological feature near the top wall boundary layer,
 $x_{2t}^{\prime }$
, exhibits two preferred modes at approximately
 $5f_{c}$
and
 $9f_{c}$
(see labels in figure 5
b). Once again, the morphological features belonging to the same shock exhibit different frequency content. This indicates that the shock feet respond independently to modes fed to them by the boundary layer. For example, the modes exhibited by
 $x_{2t}^{\prime }$
are attributed to the top wall boundary layer. Due to the one-sided nature of the converging–diverging nozzle used in these experiments, the bottom wall boundary layer is different, and thus
 $x_{2b}^{\prime }$
exhibits different frequency content. The power spectra of shocks 1 and 2 also suggest that some information fed to the shock feet from the boundary layer does not reach the centre of the core flow. Thus, specific modes do not appear in the spectrum of
 $x_{1c}^{\prime }$
or
 $x_{2c}^{\prime }$
.
Finally, consider the frequency content of the third and fourth shock position fluctuations. In addition to a new
 $1.5f_{c}$
mode, the
 $5f_{c}$
and
 $9f_{c}$
modes (mentioned in the above paragraph) persist through these downstream shock fluctuation power spectra with varying magnitudes. Similar to the upstream shocks, the morphological features of the third and fourth shocks are physically close to the boundary layer. Thus, the existence of high-frequency modes further enforces the postulate that the boundary layer influences the local shock dynamics. With this in mind, note that the frequency content of
 $x_{3t}^{\prime }$
and
 $x_{3b}^{\prime }$
are very similar. In subsequent analysis (see § 4.3), it becomes clear that information propagates from one wall to the next wall through the boundary layer. The communication increases in the downstream region of the shock train where the boundary layers are thick, which explains why the top and bottom features of the third shock have similar power spectra. The same argument is used to explain why
 $x_{4t}^{\prime }$
and
 $x_{4b}^{\prime }$
have similar frequency content.
3.2 Cross-spectral analysis of shock position time traces
Cross-spectral analysis is used to evaluate the temporal evolution of the various shock wave positions in relation to one another. By definition, the cross-spectrum of two discrete signals is equal to the discrete-time Fourier transform of the cross-correlation function (Hardin Reference Hardin1986). In general, the cross-spectrum is a complex function. The normalized magnitude of the cross-spectrum, called the coherence spectrum, is used to identify significant frequency-domain correlation between the two time series. The phase delay, defined as the argument of the complex cross-spectrum, is used to quantify the frequency-dependent narrowband time delay. Together, the coherence spectrum and narrowband time delay provide a frequency-dependent evaluation of the correlation between two time-varying signals. In this subsection, the cross-spectrum is computed using the position fluctuation time traces of two shock morphological features,
 $x_{i}^{\prime }$
and
 $x_{j}^{\prime }$
, thus it is referred to as the
 $x_{i}-x_{j}$
cross-spectrum. Cross-spectrum calculations are made using the Welch averaging method with a Hamming window and 50 % overlap, resulting in a spectral resolution of 25 Hz. The coherence describes how well correlated the two signals are and the narrowband time delay is used to determine which shock feature fluctuates first. Thus, the order in which shocks fluctuate is identified.
 $x_{i}-x_{j}$
cross-spectra computed using position fluctuations of the leading shock morphological features: (a) coherence; (b) narrowband time delay.

As an example, the fluctuations of the leading shock morphological features (
 $x_{1c}$
,
 $x_{1l}$
, and
 $x_{1r}$
) are compared. The coherence spectra,
 $Co(x_{i}^{\prime },x_{j}^{\prime })$
, are plotted as a function of the normalized frequency,
 $f/f_{c}$
, in figure 6(a). The coherence is highest for low frequencies meaning that the low-frequency fluctuations of all three leading shock features are well correlated with each other. The fluctuations of the leading leg,
 $x_{1l}$
, are also particularly well correlated with the other shock motions in the
 $2f_{c}$
–
 $5f_{c}$
frequency range as evidenced by the local peak in coherence (see label in figure). Note that this mode is in the same frequency range as the mode found in the power spectra of the shock position time traces presented in figure 5. The power spectra show that there is an elevated amount of the energy in the shock motion at these specific frequencies, while the high level of coherence shows that the shock motions at these frequencies are well correlated. Compared to the leading leg of the lambda foot, the trailing leg motion stays correlated with the Mach stem motion across a wider range of frequencies (up to
 $10f_{c}$
). Beyond
 $10f_{c}$
, the fluctuations in all three shock features are uncorrelated as the coherence drops to zero.
Using figure 6(a), a coherence cutoff value of 0.1 is defined, below which the two signals are assumed to be uncorrelated. For all frequencies with a coherence above 0.1, the corresponding narrowband time delays derived from the
 $x_{i}-x_{j}$
cross-spectra are plotted in figure 6(b). Once again, the frequency is normalized by the characteristic frequency,
 $f_{c}$
. The narrowband time delay,
 $\unicode[STIX]{x1D70F}(x_{i}^{\prime },x_{j}^{\prime })$
, is normalized by the characteristic time scale defined as the reciprocal of the characteristic frequency:
 $$\begin{eqnarray}t_{c}=L/u_{a}=1/f_{c}.\end{eqnarray}$$
For the current set of experimental conditions,
 $t_{c}$
is equal to 2.9 ms. This time scale represents the time it takes a fluid element in the free-stream flow to travel a distance equal to the characteristic length. When normalized in this way, the magnitude of the time delay in figure 6(b) describes the time between shock motions relative to the free-stream flow-through time. The sign of the time delay indicates which morphological feature fluctuates first. Note that the narrowband time delay has an uncertainty of
 $0.03t_{c}$
based on the schlieren image acquisition rate. Accounting for the measurement uncertainty, it is apparent that the time delays are approximately zero for frequencies below
 $1.5f_{c}$
, which implies that
 $x_{1c}$
,
 $x_{1l}$
, and
 $x_{1r}$
fluctuate simultaneously. Hence, the leading shock can be considered to move as a rigid body at low frequencies. For frequencies above
 $1.5f_{c}$
,
 $\unicode[STIX]{x1D70F}(x_{1l}^{\prime },x_{1c}^{\prime })$
is negative meaning the lambda foot leading leg fluctuates before the Mach stem. In addition,
 $\unicode[STIX]{x1D70F}(x_{1c}^{\prime },x_{1r}^{\prime })$
is negative for
 $f>1.5f_{c}$
meaning that the lambda foot trailing leg fluctuates after the Mach stem. Thus, for high frequencies, the instantaneous shape of the leading shock is deformed as the shock moves.
The order in which consecutive shocks fluctuate is determined by computing the cross-spectrum of
 $x_{i}^{\prime }$
and
 $x_{i+1}^{\prime }$
. The resulting coherence spectra are shown in figure 7. Panel (a) of the figure shows the coherence between the leading shock Mach stem position and the positions of the three features on the second shock; i.e.
 $Co(x_{1c}^{\prime },x_{2t}^{\prime })$
,
 $Co(x_{1c}^{\prime },x_{2c}^{\prime })$
and
 $Co(x_{1c}^{\prime },x_{2b}^{\prime })$
. In all of these cases, the coherence spectrum is highest at low frequencies and drops to zero by
 $10f_{c}$
meaning that the frequency content of the unsteady motion is well correlated for frequencies below approximately
 $10f_{c}$
and uncorrelated for frequencies above
 $10f_{c}$
. The coherence spectra involving
 $x_{2t}^{\prime }$
and
 $x_{2b}^{\prime }$
have a minor peak at
 $4f_{c}$
. Thus, the
 $4f_{c}$
fluctuations of the leading shock features (discussed earlier) are also shared with the features of the second shock.
Figure 7(b) shows the coherence spectra for the downstream sets of consecutive shocks. The coherence calculated using
 $x_{3b}^{\prime }$
and
 $x_{4b}^{\prime }$
are nearly identical to the coherence calculated using
 $x_{3t}^{\prime }$
and
 $x_{4t}^{\prime }$
, respectively. Thus, these curves are not included in the plot for clarity. Notice that local peaks centred at
 $1.5f_{c}$
,
 $6f_{c}$
, and
 $9f_{c}$
start to emerge in some of the coherence spectra plotted in figure 7(b). These modes are specific to particular regions of the flow field and are at the same frequencies as the modes found in the power spectra of the shock position time traces. For example, recall that
 $x_{2t}$
and
 $x_{3t}$
have a strong fluctuation component at approximately
 $9f_{c}$
that is evident in the shock position power spectra of figure 5. Figure 7(b) demonstrates that this mode is well correlated between shocks
 $x_{2t}$
and
 $x_{3t}$
. The
 $9f_{c}$
mode is not observed in the motion of the leading shock, which suggests that some forcing is generated locally in the top wall boundary layer that feeds information to shocks two and three. The mode dissipates by shock 4 as demonstrated by the low coherence between the
 $9f_{c}$
fluctuations of shocks 3 and 4. Similar arguments apply to the
 $1.5f_{c}$
and
 $6f_{c}$
modes.
 $x_{i}-x_{j}$
coherence spectra calculated using the position fluctuations of two consecutive shock morphological features.

Figure 8 shows the corresponding normalized time delays (computed from the cross-spectra of consecutive shock features) as a function of normalized frequency. Once again, a coherence cutoff of 0.1 is chosen, below which the two signals are assumed to be uncorrelated. For clarity, panel (a) of the figure shows the narrowband time delays computed using morphological features defined from the first and second shocks. Panel (b) of the figure shows the same quantity computed between the downstream consecutive shocks. For the lowest measurable frequencies (
 $f<0.1f_{c}$
), the time delays approach zero, indicating that the upstream and downstream shocks are displaced at approximately the same time. Thus, the entire shock train moves as a rigid body for the lowest range of frequencies. As frequency increases above
 $0.1f_{c}$
, the narrowband time delay transitions to large negative values meaning that the upstream shock fluctuates before the downstream shock. In other words, shocks respond to a perturbation sequentially with the upstream shock responding before the downstream shocks.
 $x_{i}-x_{j}$
cross-spectral narrowband time delay calculated using the position fluctuations of two consecutive shock morphological features.

In addition to the delay between consecutive shock motions, figure 8 also shows that different morphological features of the same shock may fluctuate asynchronously. For example, consider the
 $1.0f_{c}$
component of motion in figure 8(a). At this frequency, the core, top, and bottom points of the second shock are displaced
 $0.13t_{c}$
,
 $0.20t_{c}$
and
 $0.23t_{c}$
after the leading shock Mach stem displacement, respectively. That is, the central portion of the shock responds faster than regions close to the wall. By considering time delays at other frequencies in figure 8(a), it is clear that the order in which the second shock morphological features respond is frequency dependent. Similar observations are made for shocks 3 and 4. In figure 8(b), only the time delays calculated using
 $x_{3t}^{\prime }$
and
 $x_{4t}^{\prime }$
are plotted for clarity. The narrowband time delays calculated using
 $x_{3b}^{\prime }$
and
 $x_{4b}^{\prime }$
follow the same trend as
 $x_{3t}^{\prime }$
and
 $x_{4t}^{\prime }$
, respectively, but have slightly different magnitudes. The difference in response time suggests that the instantaneous shape of these downstream shocks become deformed during the motion. This is similar to the deformation of the leading shock for frequencies above
 $1.5f_{c}$
that was discussed earlier.
4 Identification of perturbations using pressure fluctuations
High-speed wall pressure measurements are analysed in this section to identify the spatio-temporal properties of potential perturbations that affect the shock train motion. To this end, the wall pressure frequency content along the length of the shock train is presented and cross-spectral analysis computed using pairs of wall pressure fluctuation measurements is discussed.
Pressure fluctuation power spectra throughout the shock train. Pressures measured along the: (a) side wall at
 $z=0.60H$
; (b) side wall at
 $z=0.09H$
; (c) bottom wall
 $y=W/2$
centreline; (d) bottom wall at
 $y=0.89W$
.

4.1 Frequency content of the wall static pressure
Figure 9 illustrates the pressure fluctuation power spectra,
 $PSD(p^{\prime })$
, in the form of a contour map. The contour map is constructed using the fluctuation component of wall static pressure,
 $p^{\prime }$
, measured at varied normalized axial distances away from the time-averaged leading shock foot location,
 $x^{\ast }/L$
. Similar to the results presented in the previous section, the frequency,
 $f$
, is normalized by the characteristic frequency,
 $f_{c}$
. The magnitude of the power spectra is normalized by
 $f_{c}$
and the variance of the pressure fluctuation,
 $\unicode[STIX]{x1D70E}^{2}(p)$
. For panels (a) through (d) of the figure, the pressures are measured along the side wall at
 $z=0.60H$
, along the side wall at
 $z=0.09H$
, along the bottom wall centreline (
 $y=W/2$
), and along the bottom wall at
 $y=0.89W$
, respectively. The diagram at the top of the figure illustrates the pressure measurement locations relative to a schlieren image projected on one of the side walls.
Generally, the majority of power is contained within the low-frequency range (
 $f<f_{c}$
). Notably, the low-frequency pressure fluctuations near the leading shock foot have significantly more power compared to the rest of the shock system. Downstream of the leading shock, the power at high frequencies increases and local high-frequency modes start to appear. For instance, high-frequency modes at approximately
 $5f_{c}$
,
 $9f_{c}$
, and
 $15f_{c}$
are clearly evident in figure 9(a). The
 $5f_{c}$
mode is first evident between shocks 1 and 2 while the other modes emerge near shock 3. Note that the
 $5f_{c}$
and
 $9f_{c}$
modes are also present in the shock position fluctuations (see figure 5), indicating that the unsteadiness of these two features are related.
Compared to the side wall pressures measured along
 $z=0.60H$
(see figure 9
a), the bottom wall pressure fluctuations measured along
 $y=W/2$
(see figure 9
c) exhibit less power in the high-frequency range. For example, the power of each high-frequency mode is distinctly smaller. A similar comparison is made for the power spectra of pressure fluctuations measured near the corner of the duct (see figure 9
b,d). That is, the corner pressure fluctuations have similar frequency content compared to the pressures measured away from the corner but the power associated with each high-frequency mode is smaller. In particular, the mode near
 $5f_{c}$
has almost completely dissipated.
4.2 Cross-spectral analysis of pressure time traces: bottom wall centreline
A perturbation induces a fluctuation in the measured pressure as it travels past the pressure transducer. Thus, the cross-spectrum calculated using pairs of wall pressure fluctuation measurements collected simultaneously during the same run provides information on where perturbations originate and the direction in which they travel. For convenience, this is termed the
 $p_{i}-p_{j}$
cross-spectrum. As an example, a detailed discussion is presented in this subsection for the
 $p_{i}-p_{j}$
cross-spectra computed using the pressure fluctuation measurements from two transducers spaced
 $0.007L$
apart on the bottom wall
 $y=W/2$
centreline. Information along the length of the shock train is gathered by changing the average location of the two transducers and compiling the results of multiple cross-spectra. The coherence,
 $Co(p_{i}^{\prime },p_{j}^{\prime })$
, and normalized narrowband time delay,
 $\unicode[STIX]{x1D70F}(p_{i}^{\prime },p_{j}^{\prime })/t_{c}$
, derived from these cross-spectra are shown in figures 10(a) and 10(b), respectively. Both quantities are plotted as a function of
 $f/f_{c}$
, the normalized frequency, and
 $x^{\ast }/L$
, the normalized distance between the average location of the pressure transducer pair and the time-averaged leading shock foot location.
Consider the coherence results shown in figure 10(a). The coherence plot describes the frequency-dependent degree of correlation between the two pressure fluctuation time traces. Upstream of the shock train (i.e. for
 $x^{\ast }/L<0$
), there is high coherence for
 $f>2f_{c}$
with a local peak in coherence at
 $30f_{c}$
. This demonstrates that the high-frequency fluctuations generated by the turbulent boundary layer are well correlated in the approach flow. Within the shock train (i.e. for
 $x^{\ast }/L>0$
), the coherence is highest for frequencies less than
 $10f_{c}$
. A local peak in the coherence at approximately
 $4f_{c}$
means that this frequency component is highly correlated for the pair of pressure fluctuations measured within the shock train. Modes at frequencies greater than
 $10f_{c}$
are also evident in the downstream portion of the shock train, however, their level of correlation is quite low (less than 0.3), and therefore not considered significant.
Results of the
 $p_{i}-p_{j}$
cross-spectra calculated using pressure fluctuation time traces measured along the bottom wall
 $y=W/2$
centreline: (a) coherence; (b) narrowband time delay.

Figure 10(b) illustrates the corresponding normalized narrowband time delays from the
 $p_{i}-p_{j}$
cross-spectra. Regions in the spectrum where the coherence is less than 0.3 are masked out in black because the pressure signals are assumed to be uncorrelated. Note that this cutoff value is higher than the one used for the
 $x_{i}-x_{j}$
cross-spectral analysis due to noise contamination. For regions of figure 10(b) with high coherence, the sign of the narrowband time delay is of particular interest because it describes the direction in which the perturbation is propagating. A negative narrowband time delay indicates that the upstream transducer captures a pressure fluctuation before the downstream transducer. Thus, the perturbation is traveling downstream. Conversely, a positive narrowband time delay indicates the perturbation is travelling upstream. The dotted contour line shows where the narrowband time delay is zero (i.e. the two pressures fluctuate simultaneously). Note that the potential uncertainty of these time delays is taken to be
 $\pm 0.007t_{c}$
, which is the time corresponding to the cutoff frequency of the low pass filter applied to the pressure measurements.
Consider three distinct regions marked in figure 10(b). Region B includes the high-frequency (
 $2<f/f_{c}<60$
) fluctuations measured upstream of the shock train. For comparison, the characteristic frequency of the incoming boundary layer,
 $u_{a}/\unicode[STIX]{x1D6FF}_{a}$
(where
 $\unicode[STIX]{x1D6FF}_{a}$
is the approach boundary layer thickness), is approximately
 $160f_{c}$
. This frequency is significantly higher than the measured frequency range, suggesting that a different mechanism is responsible for the observed fluctuations. Several studies in the literature have proposed that single SBLI unsteadiness is in part due to low-frequency boundary layer superstructures with a length on the order of
 $1\unicode[STIX]{x1D6FF}_{a}$
–
 $10\unicode[STIX]{x1D6FF}_{a}$
(Ganapathisubramani, Clemens & Dolling Reference Ganapathisubramani, Clemens and Dolling2007, Reference Ganapathisubramani, Clemens and Dolling2009; Wu & Martín Reference Wu and Martín2008). For the current work, the superstructure length is computed for the frequency with the highest coherence and is equal to approximately
 $6.5\unicode[STIX]{x1D6FF}_{a}$
. Since this length is similar to the values reported in the literature, we hypothesize that the fluctuations in region B of figure 10(b) are signatures of coherent superstructures in the turbulent boundary layer. The negative values of time delay in region B indicate that the perturbation (i.e. the superstructure) is travelling downstream.
Additional perturbations are evident in region S of figure 10(b). This region includes the
 $0.6f_{c}<f<10f_{c}$
frequency range of fluctuations measured downstream of the leading shock foot. Within region S, the narrowband time delay is positive (i.e. a perturbation travels upstream) in the upstream portion of the shock train but negative (i.e. a perturbation travels downstream) in the downstream portion of the shock train. Thus, perturbations travel away from the streamwise location where the sign of the narrowband time delay switches. This indicates that a source of perturbations is within the shock train, somewhere between the leading shock Mach stem,
 $x_{1c}$
, and the second shock,
 $x_{2c}$
. Interestingly, the location of the perturbation source varies across this region depending on the frequency.
Finally, examine region D in figure 10(b) which includes frequencies below
 $0.6f_{c}$
. The narrowband time delays in this region are more difficult to interpret because the sign of the delay switches multiple times. That is, the direction in which the perturbation travels changes along the length of the shock train suggesting that there are multiple independent, superimposed perturbations. Similar to region S, the sign of the time delay switches from positive to negative at a location between the first and second shocks indicating that perturbations are generated at this point and propagate away in both directions. Downstream of this perturbation source (i.e. for
 $x^{\ast }>0.05L$
), there are select regions where a second upstream propagating perturbation is evident. It is hypothesized that the second perturbation originates in the diffuser. As will be discussed later, the results of § 5.4 support this hypothesis. At low frequencies (
 $f<0.6f_{c}$
), all three of these perturbations influence the results of the
 $p_{i}-p_{j}$
cross-spectral analysis. However, the cross-spectral analysis only distinguishes the perturbation that induces the strongest correlation in pressure fluctuation measurements at each spatial location. For example, when the time delay is negative then the downstream propagating perturbation has a stronger correlation than the upstream propagating perturbations.
For ease of discussion, each perturbation traveling along the bottom wall
 $y=W/2$
centreline is designated a name as follows:
(i) Perturbation D
 $^{-}$
originates in the diffuser and propagates upstream. This perturbation is associated with fluctuation frequencies less than
$0.6f_{c}$
.
(ii) Perturbation S
$^{-}$
originates within the shock train and propagates upstream. This perturbation is associated with fluctuation frequencies up to approximately
$10f_{c}$
.(iii) Perturbation S
$^{+}$
originates within the shock train and propagates downstream. This perturbation is associated with fluctuation frequencies up to approximately
$10f_{c}$
.(iv) Perturbation B
$^{+}$
is associated with the coherent structures in the approach boundary layer. This perturbation propagates downstream and produces fluctuations with frequencies greater than
$2f_{c}$
.


The letter designates where the perturbation originates. That is, ‘D’ stands for ‘diffuser’, ‘S’ stands for ‘within the shock train’ and ‘B’ stands for ‘approach boundary layer’. The superscript designates the direction of travel: positive for a downstream propagating perturbation or negative for an upstream propagating one.
4.3 Perturbation pathways and insight on the source of perturbations
The cross-spectra calculated using pairs of pressure fluctuations measured on the bottom wall
 $y=W/2$
centreline have been thoroughly discussed. A similar analysis is conducted for pressure measurements at other available locations (see § 2.3) and the same type of information is extracted. A discussion on the remaining
 $p_{i}-p_{j}$
cross-spectra is not reported for the purpose of brevity and because the process of extracting information is the same for all locations. Instead, the combined results of the
 $p_{i}-p_{j}$
cross-spectral analysis are presented in this subsection to provide a comprehensive description of how perturbations travel through the isolator. These perturbation pathways, in conjunction with the flow topology identified using oil flow visualization, provide insight into the fluid physics that generate perturbations and direct their motion.
In figure 11, the frequency-dependent perturbation pathways are schematically drawn over oil flow images, which represent the general flow topology on the bottom and side walls of the isolator. Panels (a–c) of the figure show results for three distinct frequency ranges:
 $2<f/f_{c}<60$
,
 $0.6<f/f_{c}<2$
, and
 $f/f_{c}<0.6$
, respectively. In each figure, the perturbation pathway is illustrated using arrows connecting the locations of the pressure transducers used to compute the cross-spectrum. An arrow is only drawn if the coherence is above the cutoff value of 0.3. The arrow direction indicates where the perturbation is traveling based on the time delay of the cross-spectrum.
Perturbation pathways: (a)
 $2<f/f_{c}<60$
; (b)
 $0.6<f/f_{c}<2$
; (c)
 $f/f_{c}<0.6$
.
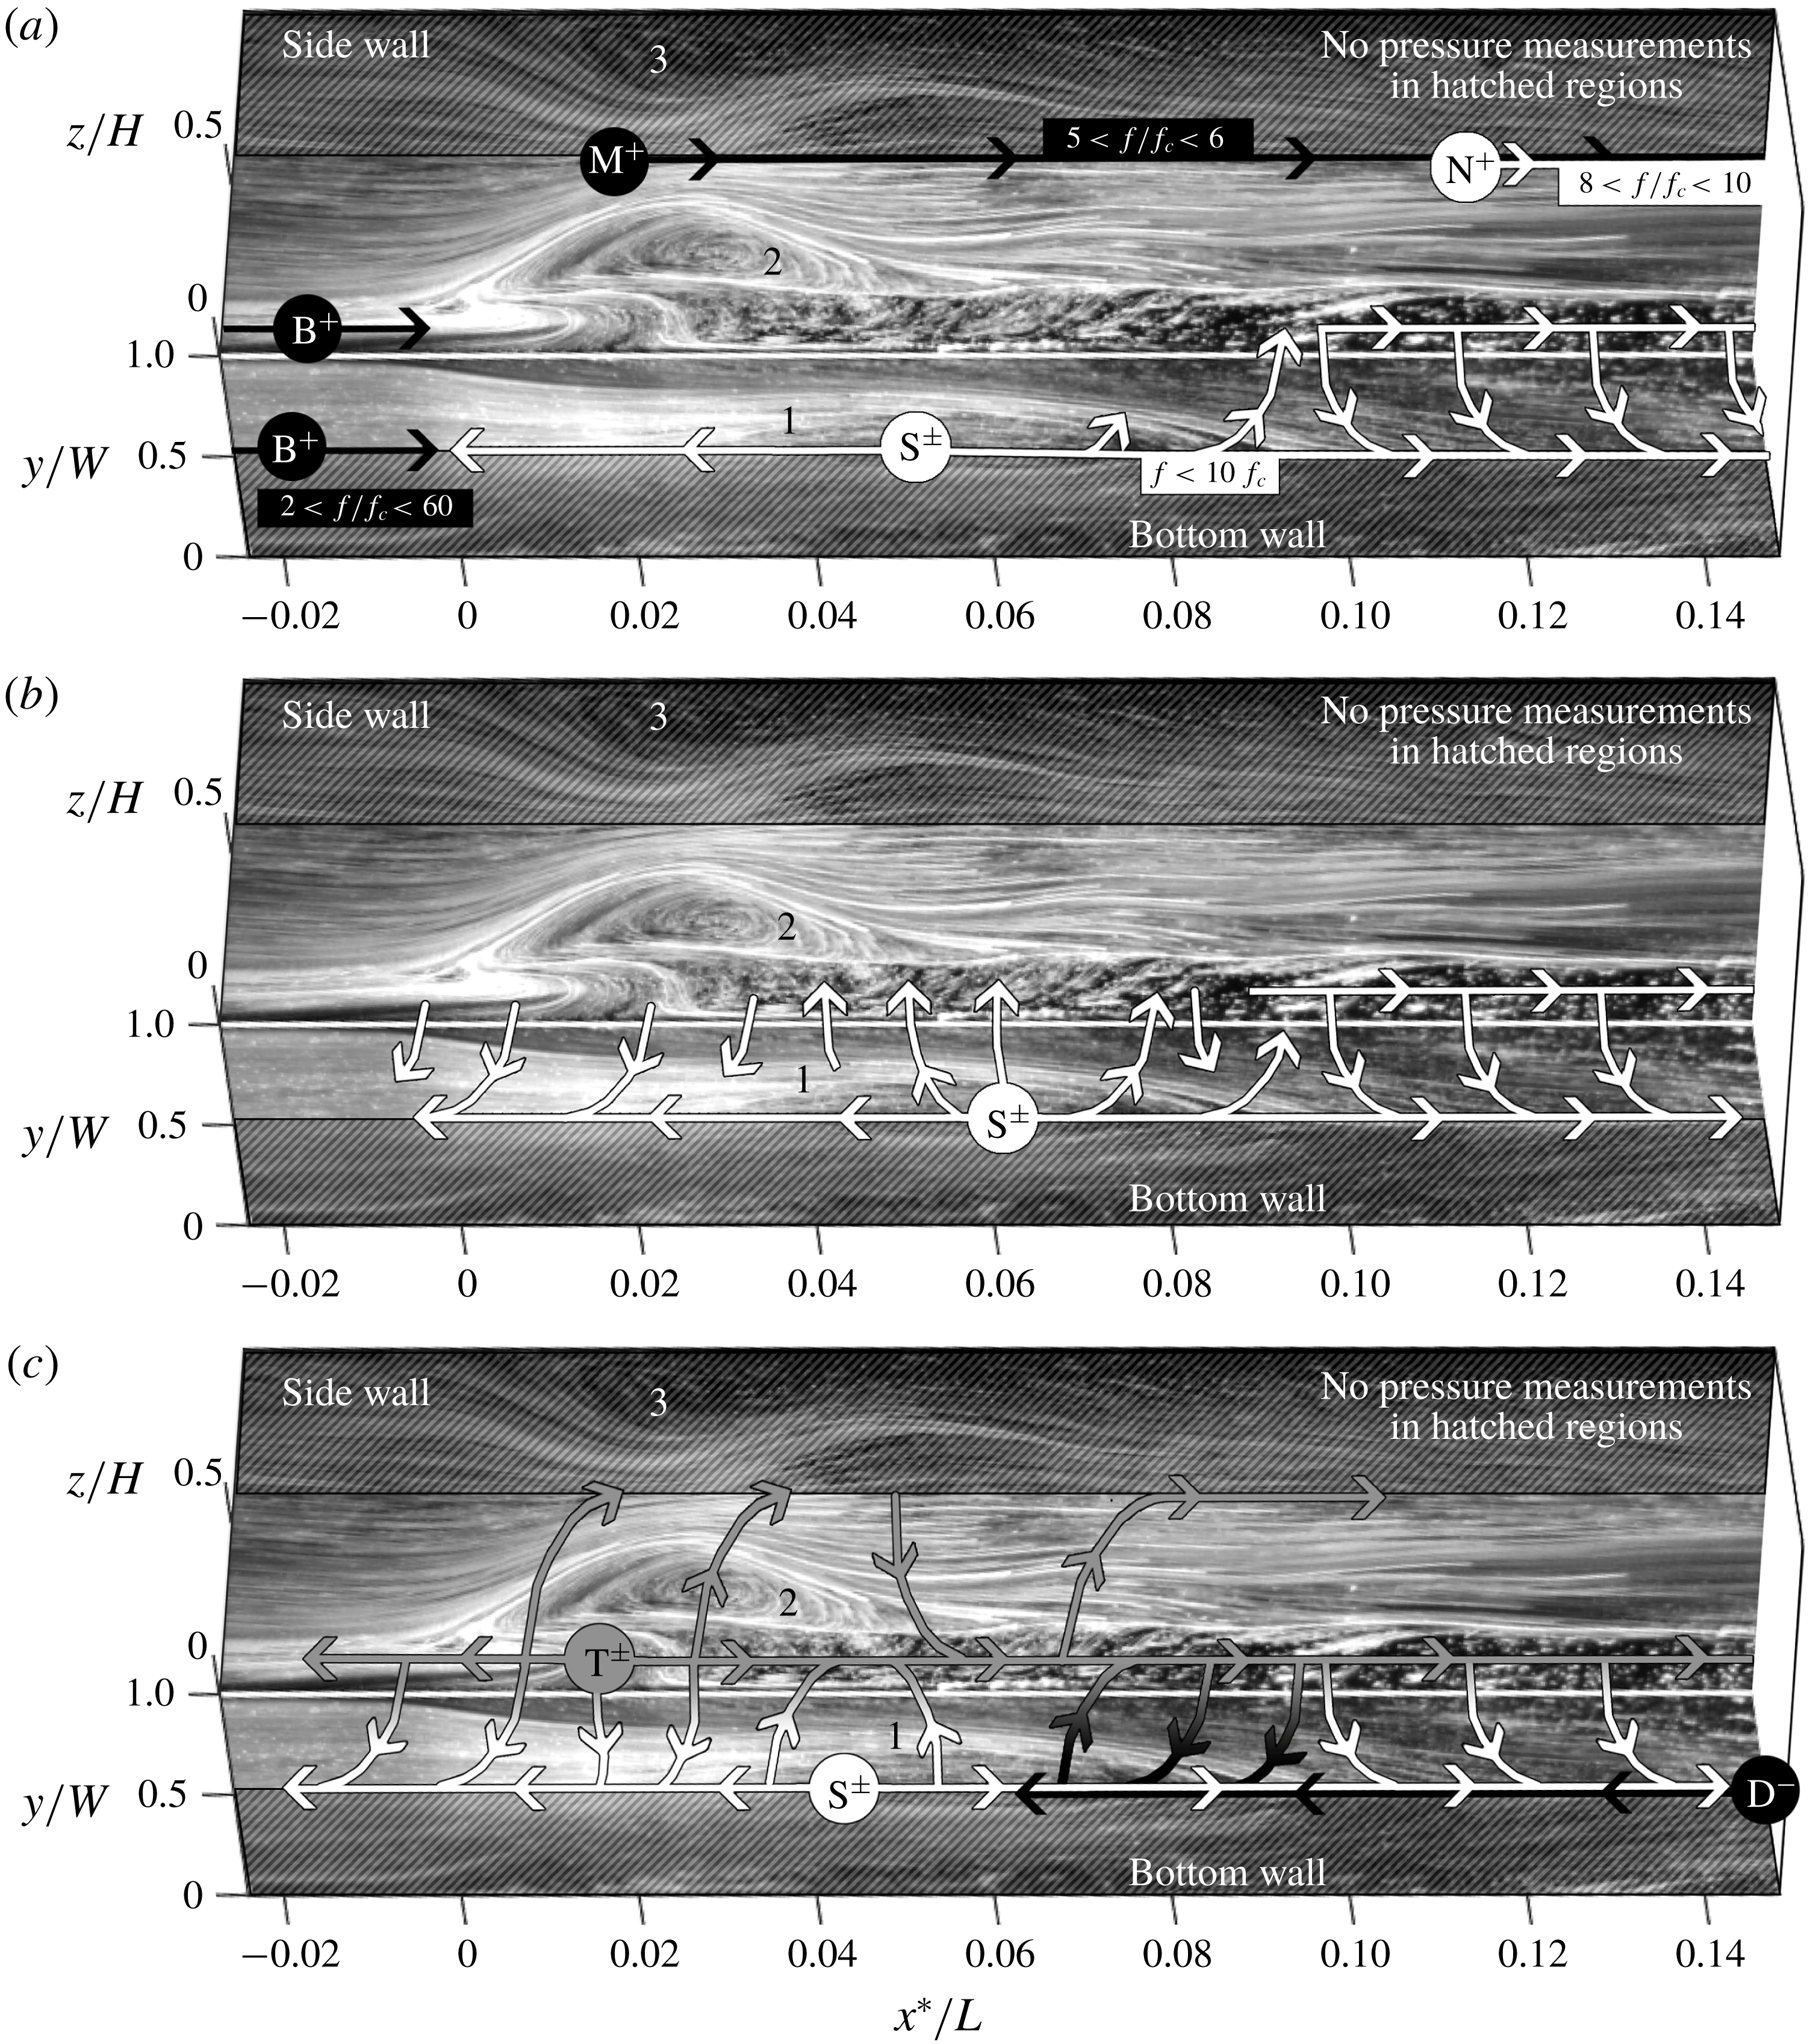
First, consider figure 11(a), which shows the perturbation pathways for the
 $2f_{c}$
to
 $60f_{c}$
frequency range. Many of the perturbations labelled in the figure have been discussed previously, but additional details are identified in this subsection. For example, perturbations B
 $^{+}$
(i.e. the coherent superstructures in the approach boundary layer) were previously found to generate correlated pressure fluctuations upstream of the shock train on the bottom wall centreline. Here, there is new evidence of perturbations B
 $^{+}$
in the side wall corner measurements. Also, recall that perturbations S
 $^{\pm }$
were previously found to emanate away from a frequency-dependent point on the bottom wall (see figure 10). The oil flow visualization image in figure 11(a) demonstrates that these source points (collectively labelled ‘S
 $^{\pm }$
’ in the figure) are within a separation bubble on the bottom wall of the isolator (labelled ‘1’ in the figure). The bubble begins upstream of shock 2 and ends near shock 3. The full length movie of the oil flow visualization provided in the supplemental material available at https://doi.org/10.1017/jfm.2018.927 shows that the bubble position and size vary in time. Thus, it is concluded that perturbations S
 $^{\pm }$
are generated by the instabilities of the separation bubble either intrinsic to the bubble itself or externally induced (e.g. driven by the incoming turbulent boundary layers). For example, a separation bubble that translates or grows/shrinks will generate perturbations in the form of acoustic waves as the surrounding flow adjusts to its new conditions. Perturbations can also take the form of vortices that shed off the bubble. These ideas are explored further in § 6.2.
New perturbations are also introduced in figure 11(a). Perturbation M
 $^{+}$
is associated with a narrow band of frequencies (
 $5<f/f_{c}<6$
) and propagates downstream along the side wall, away from
 $x^{\ast }/L=0.02$
. This perturbation is first evident in the higher speed ‘core’ region of the flow between the two large side wall separation bubbles marked ‘2’ and ‘3’ in the figure. Note that the
 $5f_{c}$
to
 $6f_{c}$
frequency range associated with perturbation M
 $^{+}$
is identical to the first high-frequency mode evident in the shock and pressure fluctuation power spectra. The second high-frequency mode evident in these spectra (at approximately
 $9f_{c}$
) is attributed to a similar perturbation travelling downstream along the side wall, away from
 $x^{\ast }/L=0.12$
. This perturbation is called N
 $^{+}$
(see label in figure 11
a). In this case, the oil flow does not clearly indicate what fluid phenomenon creates perturbations M
 $^{+}$
and N
 $^{+}$
. As discussed in § 6.3, further analysis is needed to identify the cause of these perturbations.
Figure 11(a) also illustrates that there is communication through the corners of the duct in the downstream portion of the flow (
 $x^{\ast }>0.06L$
). That is, the pressure fluctuations measured on different walls are correlated with each other. This suggests that perturbations propagate from the bottom wall to the side wall and vice versa. Interestingly, at high frequencies (
 $2<f/f_{c}<60$
) there is no communication through the corners of the duct in the upstream region of the flow. Recall from § 3 that the various morphological features of the second shock have different frequency content and cross-spectra. However, these qualities are nearly identical for different morphological features of the third and fourth shocks. This is due to the communication of perturbations through the boundary layer in the downstream region.
Next, consider figure 11(b), which shows the perturbation pathways associated with frequencies between
 $0.6f_{c}$
and
 $2f_{c}$
. The bottom wall separation bubble still generates perturbations S
 $^{\pm }$
in this mid-frequency range but now the communication through the boundary layer has increased. That is, the side and bottom wall pressure fluctuations are better correlated along a larger portion of the isolator. Near the centre of the bottom wall separation bubble (approximately
 $0.04L<x^{\ast }<0.08L$
), the perturbations tend to emanate from the bottom wall to the side wall. In the other regions of the flow, perturbations start on the side wall and travel towards the bottom wall.
Finally, consider the low-frequency perturbation pathways shown in figure 11(c). Once again, the coherence between side- and bottom wall pressure fluctuations has increased, meaning there is more communication through the corner of the duct. Some of the communicated information comes from the multiple superimposed perturbations traveling along the
 $y=W/2$
centreline of the bottom wall: (i) perturbations S
 $^{\pm }$
, which emanate away from the bottom wall separation bubble as discussed previously and (ii) perturbation D
 $^{-}$
, which is generated in the diffuser and propagates upstream. Unfortunately, there is no optical access to the diffuser and oil flow visualization cannot be used to gain insight into what fluid process generates perturbation D
 $^{-}$
. The potential sources of this perturbation are discussed in § 6.1. Other information communicated through the isolator originates on the side wall. In particular, perturbations T
 $^{\pm }$
emanate away from a point on the side wall, near the corner of the duct (see label in the figure). It is evident from the oil flow visualization that these perturbations are generated near the foot of the lower separation bubble on the side wall (labelled ‘2’ in the figure). Similar to perturbations S
 $^{\pm }$
, the generation of these perturbations is attributed to the instabilities of the separation bubble.
5 Causal relationship between perturbations and shock motion
The cause-and-effect relationship between the shock motion and the perturbations travelling through the isolator is considered in this section. To accomplish this, the
 $x_{i}-p_{j}$
cross-spectrum is calculated using one shock position fluctuation signal and one pressure fluctuation signal. Pressures are measured along the bottom wall
 $y=W/2$
centreline while the shock positions are recorded simultaneously with schlieren imaging where glass side walls provide the necessary optical access. Since side wall optical access is required, this analysis is limited to the interaction between the shock waves and the perturbations traveling along the bottom wall (i.e. perturbations S
 $^{\pm }$
, D
 $^{-}$
and B
 $^{+}$
). For each pressure fluctuation signal measured on the bottom wall, the cross-spectral analysis is repeated for different shock morphological features. To properly compute the cross-spectrum, a second-order low-pass Butterworth filter with a cutoff frequency of
 $14.8f_{c}$
(5 kHz) is applied to the pressure measurements and then the signal is downsampled to
 $29.7f_{c}$
(10 kHz) to match the acquisition rate of the schlieren images.
5.1 The
$x_{i}-p_{j}$
coherence spectra

Figure 12 shows how the coherence,
 $Co(x_{i}^{\prime },p_{j}^{\prime })$
, varies with
 $x^{\ast }/L$
, the normalized location of the pressure transducer relative to the time-averaged location of the leading shock foot. Panels (a–d) of the figure are results of the cross-spectra calculated using
 $x_{1c}^{\prime }$
,
 $x_{2b}^{\prime }$
,
 $x_{3b}^{\prime }$
and
 $x_{4b}^{\prime }$
, respectively. The coherence spectra contours found using other morphological features of the same shock wave are nearly identical (e.g. the coherence results of
 $x_{2t}^{\prime }$
are the same as the results found using
 $x_{2b}^{\prime }$
). In all of these cases, the coherence is highest for pressures measured within the shock train. Specifically, the shock positions are best correlated with pressure fluctuations for frequencies less than
 $0.6f_{c}$
. Additional pockets of high coherence are evident in the downstream region of the shock train for frequencies between
 $0.6f_{c}$
and
 $10f_{c}$
. These high-frequency fluctuations are most strongly correlated with the third and fourth shock position fluctuations.
 $x_{i}-p_{j}$
coherence spectra throughout the shock train calculated using: (a)
 $x_{1c}$
; (b)
 $x_{2b}$
; (c)
 $x_{3b}$
; (d)
 $x_{4b}$
.

Note that the pressure fluctuations measured upstream of the leading shock are not correlated with the shock motion. This indicates that perturbations B
 $^{+}$
(i.e. the superstructures in the incoming turbulent boundary layer) do not notably influence the inherent unsteadiness of the shock train. Recall from the
 $p_{i}-p_{j}$
cross-spectral analysis in § 4.2 that perturbations B
 $^{+}$
are associated with pressure fluctuations in the
 $2f_{c}$
–
 $60f_{c}$
frequency range. The
 $x_{i}-x_{j}$
cross-spectral analysis presented in this section only captures part of that frequency range (
 $f<15f_{c}$
). However, the coherence in figure 12 is low (less than 0.01) within the region of the flow field associated with perturbation B
 $^{+}$
, which highly suggests that the pressure fluctuations induced by the superstructures are uncorrelated with the shock motion across the entire range of frequencies.
5.2
$x_{i}-p_{j}$
narrowband time delay example

To best illustrate the narrowband time delays of the
 $x_{i}-p_{j}$
cross-spectra, scatter plots are presented of the normalized narrowband time delay,
 $\unicode[STIX]{x1D70F}(x_{i}^{\prime },p_{j}^{\prime })/t_{c}$
, as a function of the normalized pressure transducer location relative to the time-averaged location of the leading shock foot,
 $x^{\ast }/L$
. Consider the sample of narrowband time delay results in figure 13, which are computed using the fluctuation time traces of leading shock position,
 $x_{1c}^{\prime }$
, and wall static pressure,
 $p_{j}^{\prime }$
. Each point in the figure represents the normalized time delay at a specific frequency between
 $1.0f_{c}$
and
 $1.4f_{c}$
. The trendlines in figure 13 are simply linear fits of the data.
In essence,
 $\unicode[STIX]{x1D70F}(x_{i}^{\prime },p_{j}^{\prime })$
quantifies the time between a fluctuation in the measured pressure and the corresponding fluctuation in shock position. A positive time delay means the pressure transducer ‘sees’ the fluctuation before the shock is displaced. Conversely, a negative time delay means the shock fluctuates before the pressure transducer ‘sees’ the fluctuation. A time delay of zero means that the shock fluctuates simultaneously with the pressure. The direction in which a perturbation travels is identified by comparing the time delays of multiple pressure transducers. If an upstream transducer exhibits the fluctuation after a downstream transducer then the slope of the point distribution is positive and the perturbation is clearly travelling upstream. Conversely, a negative slope signifies a downstream propagating perturbation. In figure 13, a perturbation is travelling upstream for
 $x^{\ast }<0.06L$
and a different perturbation is travelling downstream for
 $x^{\ast }>0.06L$
. The magnitude of the slope is the reciprocal of the perturbation propagation speed. Thus, a shallow slope indicates a quickly propagating perturbation while a steep slope is associated with slower propagation speeds.
Narrowband time delay between pressure fluctuations and leading shock Mach stem position fluctuations. Results are plotted for
 $1.0<f/f_{c}<1.4$
only.

5.3 How perturbations S
$^{\pm }$
influence the shock train

With the information from the previous subsection in mind, the impact of perturbations S
 $^{\pm }$
on the motion of shocks in the train is examined. Recall from § 4.2 that perturbations S
 $^{\pm }$
are associated with a broad range of frequencies (up to approximately
 $10f_{c}$
). To decouple the impact of perturbations S
 $^{\pm }$
from that of perturbation D
 $^{-}$
, only frequencies above
 $0.6f_{c}$
are considered in this subsection (since perturbation D
 $^{-}$
is only associated with low frequencies). Figure 14 shows the scatter plot of the normalized narrowband time delays,
 $\unicode[STIX]{x1D70F}(x_{i}^{\prime },p_{j}^{\prime })/t_{c}$
, with sufficiently high coherence for all frequencies between
 $0.6f_{c}$
and
 $10f_{c}$
. For reference, the shaded region in the figure corresponds to the location in the isolator where perturbations S
 $^{\pm }$
are generated based on the
 $p_{i}-p_{j}$
cross-spectral analysis (i.e. a region within the bottom wall separation bubble). The markers plotted as upwards triangles, downwards triangles, circles and squares represent the time delays computed using the first, second, third and fourth shock position time traces, respectively. Results in different narrow frequency bands are not distinguished from one another because they follow the same trend.
Narrowband time delay between pressure and shock position fluctuations for
 $0.6<f/f_{c}<10$
.

Consider the narrowband time delays calculated using the leading shock position fluctuations,
 $x_{1c}^{\prime }$
(upwards triangle markers in figure 14). The slope of the trendline is positive, thus the measured fluctuations are a result of upstream propagating perturbation S
 $^{-}$
. Perturbation S
 $^{-}$
is generated upstream of the second shock (i.e. within the shaded region of the figure) and it travels upstream at approximately
 $0.1u_{a}$
to
 $0.2u_{a}$
, inducing pressure fluctuations as it passes each transducer. When the perturbation reaches the leading shock foot (i.e. at
 $x^{\ast }/L=0$
), the measured pressure fluctuates simultaneously with the leading shock (i.e.
 $\unicode[STIX]{x1D70F}=0$
). This is a clear indication that the upstream propagating perturbation induces a movement in the leading shock as it passes the shock foot. It is hypothesized that the perturbation causes a locally significant change in boundary layer properties (e.g. a change in boundary layer height) which is ultimately responsible for instigating the shock movement.
Figure 14 also demonstrates that perturbation S
 $^{-}$
impacts the motion of the downstream shocks. This is surprising because the perturbation is generated upstream of these shocks and travels away from them. Consider the time delays calculated using the downstream shock position fluctuations and the pressure fluctuations induced by perturbation S
 $^{-}$
. These are the downwards triangle, circle and square markers with a positive slope that are labelled ‘S
 $^{-}$
’ in the figure. The sufficient coherence of these points is evidence that the downstream shock motion is correlated with upstream pressure fluctuations. Note that the time delay increases for each consecutive shock, i.e.
 $\unicode[STIX]{x1D70F}(x_{i+1}^{\prime },p_{j}^{\prime })=\unicode[STIX]{x1D70F}(x_{i}^{\prime },p_{j}^{\prime })+\unicode[STIX]{x0394}\unicode[STIX]{x1D70F}$
. This means that the time between the pressure fluctuation and shock fluctuation increases for each downstream shock by an amount
 $\unicode[STIX]{x0394}\unicode[STIX]{x1D70F}$
(see label in figure as an example). Thus, following the leading shock displacement, the downstream shocks are displaced sequentially after some time delay. The idea of sequential shock displacement was first introduced in § 3.2 using the
 $x_{i}-x_{j}$
cross-spectral analysis. The time between the responses of consecutive shocks found from the
 $x_{i}-p_{j}$
cross-spectral analysis (i.e.
 $\unicode[STIX]{x0394}\unicode[STIX]{x1D70F}$
) closely resembles the time delay found previously with the
 $x_{i}-x_{j}$
cross-spectral analysis (i.e.
 $\unicode[STIX]{x1D70F}(x_{i}^{\prime },x_{i+1}^{\prime })$
from figure 8).
To explain this observed sequence of events, consider the following scenario. Assume that the leading shock moves downstream but the second shock has not moved. The change in distance between the two shocks implies that there are changes to the expansion and compression regions that make up the flow structure. As a result, the Mach number in front of the second shock is reduced and the pressure rise across the second shock is lower. However, the pressure rise across the shock must match the downstream condition that is imposed by the control valve. As such, the new conditions at the second shock are not possible. Therefore, the second shock must move downstream in order to have a higher inflow Mach number and larger pressure rise across the shock. The process is then repeated across consecutive shock pairs in the train and gives rise to the observed sequential shock displacements. The time delay between consecutive shock movements is related to how fast the expansion/compression regions of the flow structure change from one condition to the next. This flow response time is relatively large (up to
 $0.25t_{c}$
). In comparison, a fluid element in the flow upstream of the shock train travels the same distance in approximately
 $0.04t_{c}$
(i.e. six times faster than the flow response time). The difference in time scales emphasizes that the movement of consecutive shocks is controlled by the rate of relaxation of the flow field, and not by an acoustic wave or another type of perturbation that is convected with the flow. A similar observation is made in the computational work of Fiévet et al. (Reference Fiévet, Koo, Raman and Auslender2017) to explain the sequential motion of shock train elements in response to fluctuations in the inflow conditions.
Based on these initial observations and arguments, it is concluded that perturbation S
 $^{-}$
influences the shock train in a direct and an indirect way as follows:
(i) Direct influence on the leading shock: as the perturbation propagates upstream and passes the leading shock foot, it causes a locally significant change in the boundary layer properties that induces a displacement in the shock position.
(ii) Indirect influence on the downstream shocks: the displacement of an upstream shock alters the flow structure of the expansion and compression regions between shocks. Thus, the flow conditions entering the downstream shock have changed. In order to satisfy the new inflow conditions and required pressure rise, the downstream shock is displaced accordingly.
Note that the indirect influence occurs as a result of the direct influence. However, these two influences are considered unique because they impact the shock system through different fluid processes.
Next, consider the narrowband time delays associated with the downstream propagating perturbation S
 $^{+}$
(i.e. trendlines with a negative slope in figure 14). After perturbation S
 $^{+}$
is generated (within the shaded region) it travels downstream at approximately
 $0.3u_{a}$
to
 $0.5u_{a}$
, inducing pressure fluctuations as it passes each transducer. When the pressure transducer is located near the shock used to compute the cross-spectrum, the fluctuations in the measurements are almost simultaneous. Therefore, the perturbation directly influences the shock position as it travels past the shock foot. It is speculated that the perturbation also indirectly influences the downstream shocks in the same manner as discussed previously. Both direct and indirect influences exist but the best correlated of the two will appear as the result of the cross-spectral analysis that is plotted in figure 14. This may explain some of the scatter in the data points.
Recall that perturbations T
 $^{\pm }$
that are generated by the side wall separation bubble. The cause-and-effect relationship between the shock motion and perturbations traveling along the side wall cannot be directly studied because of diagnostic limitations. However, the source, direction and speed of T
 $^{\pm }$
are similar to those of S
 $^{\pm }$
. Thus, it is assumed that T
 $^{\pm }$
are analogous to perturbations S
 $^{\pm }$
and impact the shock train in the same way through both direct and indirect influences.
5.4 How perturbation D
$^{-}$
influences the shock train

In this subsection, the narrowband time delay results of the
 $x_{i}-p_{j}$
cross-spectra are analysed for frequencies less than
 $0.6f_{c}$
. Perturbations S
 $^{\pm }$
and D
 $^{-}$
all induce fluctuations at these low frequencies. Therefore, the time delays are influenced by multiple perturbations and need to be carefully analysed to distinguish the effects of each perturbation individually. It is assumed that perturbations S
 $^{\pm }$
act in the same way for all frequencies, and thus the results here are no different than those discussed previously. This assumption allows for the development of a better understanding of perturbation D
 $^{-}$
.
Figure 15 shows the low-frequency normalized narrowband time delays,
 $\unicode[STIX]{x1D70F}(x_{i}^{\prime },p_{j}^{\prime })$
, with sufficiently high coherence as a function of
 $x^{\ast }/L$
. Once again, the markers plotted as upwards triangles, downwards triangles, circles and squares represent the time delays computed using the first, second, third and fourth shock position time traces, respectively. Unlike previous plots, the coordinate axis of this figure is extended to view a large portion of the region downstream of the shock train. For
 $x^{\ast }>0.06L$
, all four trendlines have a positive slope meaning that a perturbation is travelling upstream, inducing fluctuations in the pressure measurements as it passes the pressure transducers. Based on the slope of the trendline, the speed of the perturbation is approximately
 $0.1u_{a}$
–
 $0.2u_{a}$
. In § 4.2, the results of the
 $p_{i}-p_{j}$
cross-spectral analysis showed evidence of both downstream (S
 $^{+}$
) and upstream (D
 $^{-}$
) propagating perturbations in this region of the flow. The
 $x_{i}-p_{j}$
time delays shown here provide clear additional evidence of upstream propagating perturbation D
 $^{-}$
and emphasize that the shock motion is better correlated with pressure fluctuations caused by perturbation D
 $^{-}$
compared to those created by S
 $^{+}$
for low frequencies. In addition, the results illustrated in figure 15 clarify where perturbation D
 $^{-}$
originates. Specifically, note the results of the pressures measured far downstream in the mixing region but just upstream of the diffuser (at approximately
 $x^{\ast }=0.25L$
). These pressure fluctuations are correlated with the motion of all four shocks and the narrowband time delay is positive, meaning that the pressure fluctuation occurs before the corresponding shock displacement. Thus, it is concluded that perturbation D
 $^{-}$
originates far downstream of the shock train, in the diffuser section of the wind tunnel.
Narrowband time delay between pressure and shock position fluctuations for
 $f/f_{c}<0.6$
.

Next, note that the magnitude of the time delay is large for pressures measured near shocks 2, 3 and 4. This means that a long period of time elapses between the pressure fluctuations and the position fluctuations of the downstream shocks. In other words, the perturbation travels upstream without directly influencing the position of shocks 2, 3 and 4 as it passes them. In contrast, the leading shock fluctuates simultaneously with the pressures measured near the leading shock foot (i.e.
 $\unicode[STIX]{x1D70F}=0$
). This means that perturbation D
 $^{-}$
directly influences the position of the leading shock as it passes the shock foot. The magnitude of the time delays and the slope of the trendlines suggest that the displacement of the leading shock ultimately causes the sequential displacement of the downstream shocks. Thus, perturbation D
 $^{-}$
does not have a direct influence on shocks 2, 3 and 4 but it does have an indirect influence on them. In this scenario, the measured time delay is equal to the amount of time it takes the perturbation to travel at
 $0.1u_{a}$
–
 $0.2u_{a}$
from the pressure transducer to the leading shock foot plus the amount of time required for the flow structure between consecutive shocks to readjust due to the indirect influence of the perturbation. Therefore, it is expected that
 $\unicode[STIX]{x1D70F}(x_{i+1}^{\prime },p_{j}^{\prime })=\unicode[STIX]{x1D70F}(x_{i}^{\prime },p_{j}^{\prime })+\unicode[STIX]{x0394}\unicode[STIX]{x1D70F}$
where
 $\unicode[STIX]{x0394}\unicode[STIX]{x1D70F}$
is the relaxation time of the flow between consecutive shocks. Figure 15 shows that the magnitude of
 $\unicode[STIX]{x0394}\unicode[STIX]{x1D70F}$
is small but the accuracy in determining this value is limited due to scatter in the results and the lack of pressure measurements for
 $0.13L<x^{\ast }<0.23L$
. However, the
 $x_{i}-x_{j}$
cross-spectral analysis confirms the small value of
 $\unicode[STIX]{x0394}\unicode[STIX]{x1D70F}$
. Specifically, figure 8 demonstrates that the time delay between consecutive shock motions goes to zero as the frequency approaches
 $0.1f_{c}$
. Given the negligible magnitude of
 $\unicode[STIX]{x0394}\unicode[STIX]{x1D70F}$
for this frequency range, the
 $x_{i}-p_{j}$
narrowband time delay in figure 15 is approximately equal to the time it takes the perturbation to propagate from the transducer to the leading shock foot. This verifies that perturbation D
 $^{-}$
directly influences the leading shock and indirectly influences shocks 2, 3 and 4.
In figure 15, the magnitude and slope of the time delay suddenly change at approximately
 $x^{\ast }=0.05L$
. This location is within the bottom wall separation bubble and corresponds to where perturbation S
 $^{-}$
is generated for low frequencies. Thus, for
 $x^{\ast }<0.05L$
the time delays derived from cross-spectral analysis are influenced by multiple upstream propagating perturbations (S
 $^{-}$
and D
 $^{-}$
). The spatial and temporal overlap is responsible for the observed discontinuity in time delay and suggests that the two perturbations cannot be distinguished from one another.
6 Insight from PIV and additional discussion on the perturbations
6.1 Perturbation D
$^{-}$
: an upstream propagating acoustic wave

The results of the cross-spectral analysis clearly illustrate that perturbation D
 $^{-}$
is generated in the diffuser and propagates upstream, along the bottom wall of the isolator, at approximately
 $0.1u_{a}$
–
 $0.2u_{a}$
. Given the low-speed nature of perturbation D
 $^{-}$
and the fact that it propagates against the (mostly) supersonic flow, it is hypothesized that this perturbation is an acoustic wave traveling upstream through the subsonic portion of the boundary layer. Such a wave must travel at a speed of
 $u-a$
, where
 $u$
and
 $a$
are the local flow speed and the speed of sound, respectively, at a given distance from the wall in the subsonic portion of the boundary layer. That is, the measured perturbation speed found from cross-spectral analysis (
 $0.1u_{a}$
–
 $0.2u_{a}$
) should equal
 $u-a$
. To check if this is a reasonable conclusion,
 $u-a$
is computed for the isolator flow field using the streamwise velocity found from PIV, the measured stagnation temperature (i.e. the room temperature), and the assumption of adiabatic flow. Figure 16 shows the probability of
 $u-a$
being within the range of
 $-0.2u_{a}$
to
 $-0.1u_{a}$
for every point of PIV measurement plane CL (see figure 4 for measurement plane location). For clarity, the time-averaged velocity contours from
 $0.8u_{a}$
to
 $1.0u_{a}$
are overlaid in the figure as solid grey lines to illustrate the shock locations. Given the propagation speed specified by the cross-spectral analysis, this figure illustrates that the acoustic wave most likely travels within the upper portion of the boundary layer, just below the sonic line.
Surprisingly, the
 $x_{i}-p_{j}$
cross-spectral analysis does not indicate that the upstream propagating acoustic wave directly influences the motion of the downstream shocks as it propagates past them. From schlieren images (see figure 2) and PIV vector fields (see figure 16) it is known that the boundary layer rapidly grows after the leading shock foot. This leads to the hypothesis that the thick, turbulent downstream boundary layer is less sensitive to the local changes caused by the acoustic perturbations. In comparison, the boundary layer at the leading shock foot is thin. Thus, when the acoustic wave reaches the leading shock foot, it imparts a locally significant change to the boundary layer properties (e.g. by changing the boundary layer height) enough to displace the leading shock. This explains why the
 $x_{i}-p_{j}$
cross-spectral analysis only shows the acoustic wave directly influencing the leading shock position. The displacement of the leading shock then instigates the sequential displacement of the downstream shocks; i.e. the perturbation indirectly influences their motion.
Probability map of
 $-0.2u_{a}<u-a<-0.1u_{a}$
demonstrates where perturbation D
 $^{-}$
propagates in the boundary layer. Time-averaged velocity contours from
 $0.8u_{a}$
to
 $1.0u_{a}$
(in increments of
 $0.02u_{a}$
) are plotted as solid grey lines to illustrate the shock positions. The dotted line follows the sonic line.

While the cross-spectral analysis and PIV clearly show the path of the acoustic wave through the isolator boundary layer, the lack of downstream measurement capabilities prevents the study of the perturbation source in the diffuser. To identify the physical fluid phenomenon responsible for generating upstream propagating acoustic waves, theories presented in the literature are evaluated. As discussed in § 1, Yamane et al. (Reference Yamane, Kondo, Tomita and Sakae1984a
,Reference Yamane, Takahashi and Saito
b
) also see evidence of a perturbation propagating slowly upstream, leading them to hypothesize that upstream propagating acoustic waves induce shock train unsteadiness. They conjecture that the acoustics are created by the oscillation of the air column in the diffuser. If this were the case, the power spectra would show a narrowband low-frequency mode associated with the natural frequency of the pipe resonance (expected to be less than
 $0.3f_{c}$
for the conditions of these experiments). The results of the current experiment (see figures 5 and 9) are relatively broadband in the low-frequency regime, meaning that the flow is not pulsating at a distinctive frequency as would be expected if the acoustic wave were generated by pipe resonance.
More fitting explanations for the generation of upstream propagating acoustic waves are obtained through previous studies of single normal shock fluctuations in a diffuser. For instance, Chen, Sajben & Kroutil (Reference Chen, Sajben and Kroutil1979) used space–time correlations of pressure measurements to determine that flow separation along the walls of the diverging duct generates upstream propagating waves with significant spectral content at low frequencies. These waves are related to the movement of an upstream separation point and are ultimately responsible for the normal shock unsteadiness. Handa, Masuda & Matsuo (Reference Handa, Masuda and Matsuo2003) also investigated single normal shocks in diffusers and their results suggest that high turbulence levels on the curved wall are responsible for the generation of the pressure perturbations. Both phenomena described above may occur in the diffuser section of the current experiment and generate acoustic waves that propagate upstream into the constant area isolator. However, further research is needed to verify the source of these upstream propagating acoustic waves.
Now that the details of perturbation D
 $^{-}$
have been thoroughly discussed, it is important to note the practical implications of this perturbation’s influence on the shock system. Start by recalling that perturbation D
 $^{-}$
originates from the part of the facility used to replicate the combustor. Thus, it is analogous to disturbances generated by the combustion process in a real high-speed air-breathing engine. This study verifies that the isolator and combustor dynamics are coupled by explaining the mechanism by which downstream information is communicated upstream via acoustic waves. The acoustic waves from the combustor should be mitigated in order to reduce noise and detrimental wall loads in the isolator of a real engine. The same communication mechanism may also be responsible for transmitting larger downstream disturbances, for example, if there is a change in the bulk downstream combustor conditions. Understanding this mechanism is important for predicting the shock train response to changes in combustor conditions, implementing control mechanisms and avoiding unstart.
6.2 Perturbations S
$^{\pm }$
, T
$^{\pm }$
: acoustic waves and vortices generated by separation bubbles


In this subsection, the perturbations generated by two separation bubbles are discussed: perturbations S
 $^{\pm }$
generated by the separation bubble on the bottom wall (‘separation bubble 1’ in figure 11) and perturbations T
 $^{\pm }$
generated by the side wall separation bubble located under the bottom lambda foot (‘separation bubble 2’ in figure 11). The existence of boundary layer separation along the shock train is generally an accepted or assumed feature of shock trains. However, its properties, such as the point of separation, length, and thickness, are not well defined from works in the literature. For the current experimental configuration, ‘bubble 2’ is investigated in our companion work (Hunt & Gamba Reference Hunt and Gamba2018) using stereoscopic particle image velocimetry (SPIV) on cross-sectional planes. The SPIV vector fields demonstrate that this rapidly enlarging separation bubble pushes the flow towards the centre of the duct, creating a highly three-dimensional shock structure. In the current work, both bottom and side wall separation bubbles are examined using two-component PIV on streamwise vertical planes. Specifically, ‘bubble 1’ and ‘bubble 2’ are captured in PIV measurement planes CL and SW, respectively. Recall that the locations of these PIV measurement planes are illustrated in figure 4.
Figures 17(a) and 17(b) illustrate the probability of reverse flow along the shock train for measurement planes CL and SW, respectively. Time-averaged velocity contours from
 $0.8u_{a}$
to
 $1.0u_{a}$
are plotted as solid grey lines to illustrate the shock locations. In addition, the dashed line in each figure represents the contour where the probability of separation is 10 %. Based on the contour lines in figure 17(a), it is evident that the bottom wall separation is under the second shock (in the region
 $0.04<x^{\ast }/L<0.11$
). For this PIV measurement plane, reverse flow is evident in approximately 80 % of the instantaneous vector fields, which indicates that the bottom wall is intermittently separated. It is also clear that the location and size of the separation bubble change in time. Thus, the probability of seeing separation at a particular point in the flow is less than 80 %.
Probability of separated flow on measurement plane: (a) CL; (b) SW. The thin dashed line around each separation bubble represents the 10 % separation probability contour. Time-averaged velocity contours from
 $0.8u_{a}$
to
 $1.0u_{a}$
(in increments of
 $0.02u_{a}$
) are plotted as solid grey lines to illustrate the shock positions. The dotted line follows the sonic line.

The side wall separation bubble exhibited in figure 17(b) is larger than the bottom wall separation bubble discussed previously. On measurement plane SW, the probability of reverse flow is greater than 10 % within a region
 $-0.01<x^{\ast }/L<0.07$
and the most probable region for flow separation is at
 $x^{\ast }/L=0.02$
. However, these quantities are underestimated because measurement plane SW is positioned
 $0.16W$
away from the side wall. Effectively, only the tallest portions of the separation bubble are measured; analogous to viewing the tip of an iceberg. From previous SPIV measurements on cross-sectional planes (Hunt & Gamba Reference Hunt and Gamba2018), it is known that the side wall separation bubble is present in 100 % of the instantaneous velocity fields, but its height is sometimes less than
 $0.16W$
. Despite this restriction, the position and extent of the flow separation shown in figure 17(b) roughly agree with the observations from the oil flow visualization. The time-averaged velocity contours from PIV also demonstrate that the side wall separation is under the leading shock lambda foot and that there is an upstream influence on the shock structure near the wall. That is, the leading shock is curved such that the portion of the shock near the wall is positioned further upstream. This is consistent with our previous SPIV measurements on cross-sectional planes (Hunt & Gamba Reference Hunt and Gamba2018) that revealed the highly three-dimensional and curved nature of the leading shock.
In the literature, the point of separation is often assumed to be at the leading shock foot. However, the above results for the bottom wall separation bubble show that separation may start further downstream or there may not be separate at all. Benek, Suchyta & Babinsky (Reference Benek, Suchyta and Babinsky2016) studied the effects of duct width and boundary layer thickness on a single oblique shock reflection and hypothesized that thick boundary layers in the duct corners produce weak compression waves that influence the separation region. If compression waves from opposite corners interact upstream of the shock impingement then the adverse pressure gradient is spread over a larger distance and it is easier for the flow to stay attached. This can occur if the duct aspect ratio is small or the corner blockage is large, which generates compression waves at large angles away from the wall. In the current experiment, the thick side wall separation bubble in conjunction with the low aspect ratio duct suggest that the theory of Benek et al. (Reference Benek, Suchyta and Babinsky2016) holds for the resulting shock train and explains why the bottom wall boundary layer only has a small, intermittent separation bubble.
Now the perturbations created by these separation bubbles are discussed. Separation bubbles in turbulent flows are known to exhibit two unsteady phenomena: (i) the roll-up of vortices in the shear layer above the recirculating region and their subsequent shedding downstream of the bubble, and (ii) separation bubble breathing, i.e. contraction/expansion (Kiya & Sasaki Reference Kiya and Sasaki1983; Driver, Seegmiller & Marvin Reference Driver, Seegmiller and Marvin1987; Weiss, Mohammed-Taifour & Schwaab Reference Weiss, Mohammed-Taifour and Schwaab2015). These separation bubble instabilities are either intrinsic to the bubble itself or externally induced (e.g. driven by the incoming turbulent boundary layers) as observed in some single SBLI studies (Clemens & Narayanaswamy Reference Clemens and Narayanaswamy2014).
Given the speed and direction in which perturbations S
 $^{-}$
and T
 $^{-}$
travel, it is proposed that these perturbations are acoustic waves generated by the separation bubble breathing mode. The acoustic waves are created as the surrounding boundary layer flow adjusts to the new separation bubble size or position. Similar to acoustic wave D
 $^{-}$
, the acoustic waves generated by the separation bubble instabilities propagate upstream at
 $0.1u_{a}$
–
 $0.2u_{a}$
and follow the same path through the upper portion of the boundary layer (see figure 16). The acoustic waves change the local flow properties and thus induce a displacement of the leading shock as they pass the shock foot. It is also hypothesized that downstream propagating acoustic waves are generated by the separation bubble breathing mode. However, these acoustic waves have a negligible impact on the downstream shock positions for the same reason that acoustic wave D
 $^{-}$
does not impact shocks 2, 3 and 4 as it travels upstream. That is, the thick turbulent boundary layer under the downstream shocks is less sensitive to the local changes imparted on the flow from the acoustic wave.
The downstream propagating perturbations S
 $^{+}$
and T
 $^{+}$
are thought to be streamwise vortical structures generated by the separation bubble shear layer. These vortices periodically shed from the shear layer and propagate downstream where they affect the position and structure of the shocks. Computations by Varadarajan & Roe (Reference Varadarajan and Roe2011) verify that vortices convected across a shock wave are capable of traveling considerable distances and are therefore capable of impacting the motion of downstream shocks. The existence of vortical structures is investigated by applying the vortex detection method proposed by Graftieaux, Michard & Grosjean (Reference Graftieaux, Michard and Grosjean2001) to the instantaneous PIV velocity fields. This method has been utilized in several single SBLI studies (Dupont et al.
Reference Dupont, Piponniau, Sidorenko and Debiève2008; Souverein et al.
Reference Souverein, Dupont, Debiève, Dussauge, Van Oudheusden and Scarano2010; Oudheusden et al.
Reference Oudheusden, Jöbsis, Scarano and Souverein2011). The detection method defines a dimensionless scalar,
 $\unicode[STIX]{x1D6E4}$
, at every discrete point in the measurement domain, P, as follows:
 $$\begin{eqnarray}\unicode[STIX]{x1D6E4}(\text{P})=\frac{1}{N}\mathop{\sum }_{S}\sin (\unicode[STIX]{x1D703}_{M}),\end{eqnarray}$$
where
 $S$
is a two-dimensional area surrounding the point P,
 $N$
is the number of points inside
 $S$
and
 $\unicode[STIX]{x1D703}_{M}$
is the angle between the local velocity at a point M within the area of integration
 $S$
and the vector connecting points P and M. The dimensionless scalar result,
 $\unicode[STIX]{x1D6E4}$
, has values between
 $-$
1 and 1, with its sign related to the direction of the vortex rotation. Graftieaux et al. (Reference Graftieaux, Michard and Grosjean2001) showed that the flow is locally dominated by rotation when
 $|\unicode[STIX]{x1D6E4}|>2/\unicode[STIX]{x03C0}$
. Based on this definition, the vortex identifier is applied to the instantaneous velocity fields using a
 $0.06H\times 0.06H$
interrogation window size. Note that the interrogation window size does not impact the conclusions drawn here because it is essentially a spatial filter that only weakly affects the location of the vortex centre. This was verified by parametrically changing the size of
 $S$
.
Figure 18 shows examples of the vortex identifier magnitude,
 $|\unicode[STIX]{x1D6E4}|$
, for instantaneous velocity fields with reverse flow. For reference, the dashed lines outline regions of reverse flow and the solid grey lines are velocity contours from
 $0.8u_{a}$
to
 $1.0u_{a}$
, which are plotted to illustrate the shock locations. Panels (a) and (b) of the figure are results from PIV measurement planes CL and SW, respectively. For both measurement planes, the existence of vortices in the separation bubble shear layer and downstream of the separation bubble is made evident by the large magnitude of the vortex identifier. The centre of each identified vortex, with
 $|\unicode[STIX]{x1D6E4}|>2/\unicode[STIX]{x03C0}$
, is circled in the figure. Generally, the vortices located downstream of the separation bubble are harder to detect. This is attributed to the difficulty in defining geometrical properties of a large-scale vortex superimposed on a small-scale turbulent velocity field, which is a common problem in vortex identification schemes. Far away from the separation bubble and its wake, the magnitude of
 $\unicode[STIX]{x1D6E4}$
is less than 0.2 and thus, there are no vortices in the other regions of the flow field. Figure 18 only shows two instantaneous vortex identifier fields, but the results are representative examples of all flow fields with separation. To demonstrate this, figure 19 shows that the number of identified vortices increases linearly with the size of the separated area. The lack of vortex centres in instantaneous velocity fields without reverse flow signifies that
 $\unicode[STIX]{x1D6E4}$
is a marker of separation.
Magnitude of the vortex identifier,
 $|\unicode[STIX]{x1D6E4}|$
, for instantaneous velocity fields with separation: (a) measurement plane CL; (b) measurement plane SW. Vortex centres are circled. The thin dashed line represents the extent of reverse flow. Velocity contours from
 $0.8u_{a}$
to
 $1.0u_{a}$
(in increments of
 $0.02u_{a}$
) are plotted as solid grey lines to illustrate the shock positions.

Average number of vortex centres (with
 $|\unicode[STIX]{x1D6E4}|>2/\unicode[STIX]{x03C0}$
) versus the size of the separated area in the instantaneous PIV velocity field.

The speed at which perturbations S
 $^{+}$
and T
 $^{+}$
propagate downstream further supports the hypothesis that these perturbations are vortices. From the cross-spectral analysis, it is known that these perturbations travel at approximately
 $0.2u_{a}$
–
 $0.5u_{a}$
. Single SBLI experiments have shown that vortices shed away from the separation bubble at a convective speed of 0.3–0.7
 $u_{a}$
(Dupont et al.
Reference Dupont, Piponniau, Sidorenko and Debiève2008; Humble, Scarano & van Oudheusden Reference Humble, Scarano, van Oudheusden, Braza and Hourigan2009; Souverein et al.
Reference Souverein, Oudheusden, Scarano and Dupont2009; Oudheusden et al.
Reference Oudheusden, Jöbsis, Scarano and Souverein2011). In diffuser flows, the separation bubble associated with an unsteady shock wave also produces vortices that propagate downstream at approximately
 $0.5u_{a}$
(Bogar Reference Bogar1983). Thus, the expected convective velocity of vortical structures is similar to the measured propagation speed of the perturbations in the shock train.
In a realistic application, a thorough understanding of both separation bubble perturbations (i.e. the acoustic waves and the vortices) is important because they can feed instabilities to the combustor. It is also possible that these perturbations interact with or amplify the acoustic waves generated in the combustor. Unlike the combustor’s acoustic waves, the separation bubble perturbations are created locally in the shock train and therefore, mitigation strategies can be applied to the isolator itself.
6.3 Perturbations M
$^{+}$
and N
$^{+}$


The
 $p_{i}-p_{j}$
cross-spectral analysis in § 4.3 indicates that two perturbations propagate downstream along the side wall of the isolator: M
 $^{+}$
and N
 $^{+}$
associated with a narrow band of frequencies centred at
 $5f_{c}$
and
 $9f_{c}$
, respectively. Given the spacing between pressure transducers and the narrowband time delay from the cross-spectral analysis, it is evident that these perturbations propagate at
 $0.1u_{a}$
–
 $0.3u_{a}$
; far too slow to be an acoustic wave convected downstream at a speed
 $u+a$
. In addition, the vortex identification algorithm described earlier does not show any vortices in the PIV velocity fields where these perturbations exist. Thus, the data suggest that perturbations M
 $^{+}$
and N
 $^{+}$
are not acoustic waves or flow-separation-induced vortices.
Details about these perturbations are difficult to obtain because (i) simultaneous side wall pressure and schlieren measurements are not possible, hence the
 $x_{i}-p_{j}$
cross-spectral analysis cannot be conducted, and (ii) no distinctive flow feature is evident in the PIV or oil flow visualizations that would suggest what fluid phenomenon creates the perturbations. Therefore, the origin of the perturbations and information on how they interact with the shock train is unknown. One possible explanation is provided. Consider a scenario where the two side wall separation bubbles change size, effectively creating an aerodynamic nozzle. If the bubble size grows then the available area for core flow to pass through is reduced and perturbation M
 $^{+}$
is the resulting hydrodynamic change to the flow structure. As evidence, the oil flow visualizations show that perturbation M
 $^{+}$
originates between the two separation bubbles. Similarly, perturbation N
 $^{+}$
originates near the third shock in a region where the flow is confined by thick boundary layer bulges. Thus, the strong high-frequency modes evident in the shock motion and pressure fluctuations are possibly due to the successive expansions and contractions of the core flow area. This explanation is similar to the theory of Sugiyama et al. (Reference Sugiyama, Takeda, Zhang, Okuda and Yamagishi1988) as discussed in § 1. However, further analysis is needed to clearly identify the cause of these perturbations.
7 Discussion on the scaling of unsteadiness properties
In this section, we consider how the shock train unsteadiness properties may depend on the various flow conditions. The development of a scaling argument is difficult for three reasons. The first reason is that the shock train unsteadiness is caused by multiple fluid processes that influence the shock train through different physical mechanisms. Each mechanism introduces fluctuations associated with a range of frequencies that depend on the characteristic quantities of that process. Thus, a single set of scaling parameters may not adequately describe the entire system. The second reason is that the perturbations may be coupled to each other, causing the unsteadiness properties to scale with parameters that are seemingly irrelevant to the individual phenomena. For instance, an upstream propagating acoustic wave from the diffuser may perturb the bottom wall separation bubble, thus generating a downstream propagating vortex which directly influences the motions of downstream shocks. In this scenario, the vortex and the resulting shock motion depend on a fluid phenomenon in the diffuser. Coupling effects may also result in nonlinear responses. The third problem stems from the lack of research that adequately describes the entire set of flow parameters and the shock train unsteadiness properties, both of which are needed to construct and compare scaled quantities from different facilities. Nevertheless, here we attempt to unify some of the observations introduced in the current work by discussing different scaling approaches.
7.1 Definitions of three length scales:
$L$
,
$L_{sep}$
, and
$L_{\unicode[STIX]{x1D703}}$


Thus far, the pseudoshock length,
 $L$
, and the free-stream approach velocity,
 $u_{a}$
, have been used to scale the shock train unsteadiness properties. As prefaced in § 3.1, these scaling parameters are global metrics. The pseudoshock length describes the overall state of the system because it is a function of the isolator geometry and boundary conditions. Similarly, the free-stream velocity globally influences the rates of many relevant fluid processes. Choosing global metrics as scaling parameters is an attempt to resolve the first problem discussed in the previous paragraph. That is, a single set of scaling parameters is used to describe multiple fluid processes that create perturbations. While the individual sources of perturbations are dependent on local fluid properties and processes, the entire system is ultimately governed by these global metrics. Some characteristics of the local fluid physics might even directly depend on the global parameters of the system. However, due to a lack of well-documented shock train measurements under different conditions, the validity of this scaling argument cannot be proven unequivocally and additional work is required.
Driven by the lack of previous research on shock train unsteadiness, consider the findings on a similar large-scale, low-frequency unsteadiness observed in single SBLI studies (Clemens & Narayanaswamy Reference Clemens and Narayanaswamy2014; Gaitonde Reference Gaitonde2015). These interactions are the subject of many research studies and provide inspiration for alternative shock train unsteadiness scaling arguments. First, note the obvious differences in these flow fields: (i) single SBLI experiments only have a single incident shock and the associated reflected shock while shock trains are composed of numerous shocks; (ii) the geometry of the duct is different because single SBLI experiments have a physical structure in the flow creating and stabilizing the incident shock, while shock train experiments do not have this structure. The key similarity between the single SBLI case and the shock train is the existence of an unstable separation bubble that can influence the shock position. In single SBLI experiments, the characteristic frequencies of the unsteadiness are typically scaled in terms of a dimensionless Strouhal number defined as follows:
 $$\begin{eqnarray}St=\frac{fL_{sep}}{u_{a}},\end{eqnarray}$$
where
 $L_{sep}$
is the length of the separation bubble. Other definitions for
 $L_{sep}$
have been used when the separation bubble length cannot be directly measured. For example, in reflected shock interactions,
 $L_{sep}$
is often approximated as the distance between extrapolated intersection points of the incident and reflected shocks with the wall. Defining
 $L_{sep}$
is less straightforward for a shock train because there are multiple separation bubbles with different lengths. For this work,
 $L_{sep}$
is the average length of the instantaneous side and bottom wall separation bubbles (quantified using PIV) and is equal to
 $0.035L$
. The chosen definition of
 $L_{sep}$
may seem fairly arbitrary, but nevertheless considered here.
Generally,
 $L_{sep}$
represents the effects on the boundary layer caused by the shock impingement. Thus,
 $L_{sep}$
should ultimately depend on a characteristic length of the boundary layer. In addition, the boundary layer properties are potentially appropriate scaling parameters for the shock train unsteadiness because, similar to single SBLI, the phenomena that generate perturbations are associated with the boundary layer itself. Given these reasons, an alternative length scale for the shock train unsteadiness properties is defined as follows:
 $$\begin{eqnarray}L_{\unicode[STIX]{x1D703}}=\sqrt{\unicode[STIX]{x1D703}_{a}D_{H}},\end{eqnarray}$$
where
 $\unicode[STIX]{x1D703}_{a}$
is the momentum thickness of the approach boundary layer and
 $D_{H}$
is the hydraulic diameter of the isolator. In this work, the momentum thickness is only measured on the bottom wall and it is assumed that the other walls have similar boundary layer properties. Thus,
 $L_{\unicode[STIX]{x1D703}}$
is essentially a one-dimensional estimate and is equal to
 $0.005L$
for the current experiment.
The approach momentum thickness is used in the definition of
 $L_{\unicode[STIX]{x1D703}}$
despite the fact that momentum thickness varies through the shock train. This is important to note because local fluctuations are driven by their respective boundary layer, which might be strongly distorted by preceding shock/boundary layer interactions. However, invoking traditional boundary layer scaling arguments, even the local boundary layer properties should scale with the initial approach conditions. For simplicity, it is assumed that a
 $\unicode[STIX]{x1D703}_{a}$
dependence is sufficiently representative of the boundary layer evolution through the shock train. Therefore,
 $\unicode[STIX]{x1D703}_{a}$
is proposed as a relevant scaling quantity in (7.2) and is expected to adequately represent the shock train dynamics to a first approximation.
The hydraulic diameter is included in the definition of
 $L_{\unicode[STIX]{x1D703}}$
as a one-dimensional way of accounting for the effects of the duct cross-sectional size. At the very least, the cross-sectional size of the isolator is geometrically similar to the overall size of the shock train structure. Previous works in the literature have also found that
 $D_{H}$
is an appropriate length scale for several important pseudoshock features, such as the overall pressure rise and pressure gradient. Notably, Waltrup & Billig (Reference Waltrup and Billig1973) use
 $L_{\unicode[STIX]{x1D703}}$
to normalize the pseudoshock length in a simple quadratic relationship that scales the pseudoshock pressure profiles at different flow conditions.
An alternative interpretation of
 $L_{\unicode[STIX]{x1D703}}$
is developed using a one-dimensional representation of confinement ratio,
 $C_{\unicode[STIX]{x1D703}}=2\unicode[STIX]{x1D703}_{a}/D_{H}$
. By substituting the definition of confinement ratio into (7.2),
 $L_{\unicode[STIX]{x1D703}}$
is rewritten as follows:
 $$\begin{eqnarray}L_{\unicode[STIX]{x1D703}}=\unicode[STIX]{x1D703}_{a}\sqrt{\frac{2}{C_{\unicode[STIX]{x1D703}}}}.\end{eqnarray}$$
Typically,
 $C_{\unicode[STIX]{x1D703}}$
is much less than one and the term
 $C_{\unicode[STIX]{x1D703}}^{-1/2}$
augments the impact of
 $\unicode[STIX]{x1D703}_{a}$
. As an example,
 $C_{\unicode[STIX]{x1D703}}$
is equal to approximately 0.03 for the conditions of the current experiment, and thus
 $L_{\unicode[STIX]{x1D703}}$
is eight times greater than
 $\unicode[STIX]{x1D703}_{a}$
. The example demonstrates how
 $L_{\unicode[STIX]{x1D703}}$
can be interpreted as an adjusted boundary layer momentum thickness that accounts for the effects of confinement. This emphasizes that the corrected momentum thickness drives the shock train inherent unsteadiness, an idea that is consistent with the initial discussion explaining why
 $\unicode[STIX]{x1D703}_{a}$
is an important scaling parameter.
Evolution of the normalized pressure fluctuation power spectrum as a function of Strouhal number. Pressure measured on the: (a) bottom wall; (b) side wall.

7.2 Evaluation of the
$L_{sep}$
and
$L_{\unicode[STIX]{x1D703}}$
length scales


The relevance of two length scales,
 $L_{sep}$
and
 $L_{\unicode[STIX]{x1D703}}$
, are evaluated by analysing the power spectra of the shock train fluctuations. Figures 20(a) and 20(b) show the evolution of the pressure fluctuation power spectra through the shock train for measurements on the bottom and side walls, respectively. Results of pressures measured away from the corner (solid lines) and near the corner (dotted lines) are shown. The results are presented in the typical single SBLI fashion, where the power spectra,
 $PSD(p^{\prime })$
, are non-dimensionalized by frequency,
 $f$
, and the pressure variance,
 $\unicode[STIX]{x1D70E}^{2}(p^{\prime })$
, and then plotted as a function of Strouhal number,
 $St$
. The top and bottom horizontal axes show the Strouhal numbers computed using
 $L_{sep}$
and
 $L_{\unicode[STIX]{x1D703}}$
, respectively.
Consider the spectra of the bottom wall pressures shown in figure 20(a). Ahead of the shock train, the power spectrum is dominated by high Strouhal numbers associated with superstructures in the approach boundary layer. Near
 $x^{\ast }/L=0$
, the power transitions to low Strouhal numbers due to the motion of the leading shock foot. Then, a local mode in the power spectrum emerges near the bottom wall separation bubble. For pressures measured in the corner, this mode is broad and centred at
 $St_{L_{\unicode[STIX]{x1D703}}}=0.08$
(
 $St_{L_{sep}}=0.56$
). For pressures measured on the
 $y=W/2$
centreline, the mode is narrow and centred at
 $St_{L_{\unicode[STIX]{x1D703}}}=0.02$
(
 $St_{L_{sep}}=0.15$
). In all cases, the separation bubble mode broadens and shifts towards a higher Strouhal number as
 $x^{\ast }/L$
increases. A similar trend occurs in single SBLI experiments, where pressures first exhibit a mode at a Strouhal number in the range of 0.02–0.05, which then broadens through the separation bubble (Dupont, Haddad & Debiève Reference Dupont, Haddad and Debiève2006; Dussauge et al.
Reference Dussauge, Dupont and Debieve2006; Grilli et al.
Reference Grilli, Schmid, Hickel and Adams2012; Poggie et al.
Reference Poggie, Bisek, Kimmel and Stanfield2015). When scaled using
 $L_{\unicode[STIX]{x1D703}}$
, the shock train separation bubble mode is centred at a Strouhal number similar to those found in single SBLI experiments. This indicates that
 $L_{\unicode[STIX]{x1D703}}$
is potentially an appropriate length scale for the shock train when comparing to single SBLI unsteadiness. However, the shock train motion is influenced by many perturbations; the effects of which become more prominent in the downstream portion of the flow as information is communicated through the boundary layer. Thus, the shock train power spectra exhibit several high-frequency modes at the end of the bottom wall separation bubble that are not characteristic of a single SBLI. This difference emphasizes that the local unsteadiness properties of the shock train are influenced by phenomena that are not local.
Next, consider the power spectra of the side wall pressure measurements shown in figure 20. The pressures measured near the corner of the duct pass through a separation bubble and exhibit a power spectrum evolution similar to the bottom wall measurements. That is, the power at low Strouhal numbers rises near the shock foot and then a local mode develops through the separation bubble. Thus, both shock train separation bubbles influence the pressure power spectra in a similar manner as a separation bubble generated by a single SBLI. However, the Strouhal numbers associated with the side and bottom wall separation bubble modes differ due to contrasting bubble sizes and general characteristics. Funderburk & Narayanaswamy (Reference Funderburk and Narayanaswamy2016) note a similar difference in Strouhal number for the large primary separation and small corner separation generated by a single SBLI. In contrast, the spectra of the side wall pressures measured away from the corner do not pass through a separation bubble and therefore the spectral modes are not caused by a local separation. Instead, the multiple well-defined modes are signatures of perturbations M
 $^{+}$
and N
 $^{+}$
, as well as perturbations generated elsewhere in the isolator that influence the flow on the side wall due to communication through the boundary layer.
The normalized power spectra of the shock train position fluctuations are shown in figure 21. Only the results of
 $x_{1c}^{\prime }$
,
 $x_{2t}^{\prime }$
,
 $x_{3t}^{\prime }$
, and
 $x_{4t}^{\prime }$
are plotted for clarity, but similar results are obtained for the other morphological features. The figure demonstrates that the shock train morphological features exhibit broadband motion and some have high-frequency modes. In contrast, a single SBLI fluctuates predominantly at a specific frequency corresponding to a Strouhal number of approximately 0.02–0.07 (Piponniau et al.
Reference Piponniau, Dussauge, Debiève and Dupont2009; Oudheusden et al.
Reference Oudheusden, Jöbsis, Scarano and Souverein2011). The difference in spectral content is not surprising because there is a physical structure in single SBLI experiments that creates the shock wave and provides stability to the system. No such structure exists for a shock train in a constant area duct. Instead, the shock train position is dictated by the isolator geometry and boundary conditions. The shock train is also influenced by a variety of perturbations and, as a result, its motion is expected to be very different than that of a single SBLI.
Normalized shock position fluctuation power spectra as a function of Strouhal number.

8 Summary and conclusions
Even with constant bulk inflow and outflow conditions, a shock train in a constant area duct exhibits inherent unsteadiness where it fluctuates about its time-averaged position. Shock train inherent unsteadiness has been observed in previous studies but the underlying mechanisms responsible for the unsteadiness have not been fully explored. This work specifically investigates the fluid phenomena that cause the inherent unsteadiness and links them to a complex, frequency-dependent dynamical system of perturbations that are present in the flow field and interact with the shock train.
Experiments are performed in a mechanically back-pressured direct-connect isolator model that simulates the isolator flow field of a high-speed air-breathing engine, such as a dual-mode scramjet. The isolator model has a nominal inflow Mach number of 2.0 and a constant area cross-section with an aspect ratio of approximately 1. Perturbations and their effects on the shock train are primarily studied using cross-spectral analysis of shock position and wall static pressure fluctuation measurements. Additional insight is gained through oil flow visualization and PIV. Several perturbations are identified, but some are found to have a negligible impact on the shock train motion, such as the superstructures in the approach boundary layer. The following perturbations are found to notably contribute to the shock train inherent unsteadiness:
(i) Acoustic waves generated by separation bubble instabilities: acoustic waves are created as the surrounding flow adjusts to a change in separation bubble size or position. In the current experiment, the acoustic waves form near the second shock and propagate upstream through the subsonic portion of the boundary layer at approximately
$0.1u_{a}$
–
$0.2u_{a}$
. The passage of the acoustic waves is associated with broadband wall static pressure fluctuations (
$f<10f_{c}$
). As the acoustic waves pass the leading shock foot, they induce a displacement in the shock position. Downstream propagating acoustic waves may also be generated by the separation bubble instabilities, but they have a negligible impact on the shock system.(ii) Vortices generated by the shear layer of the separation bubble: these vortices shed off separation bubbles and convect downstream at approximately
$0.2u_{a}$
–
$0.5u_{a}$
. They are associated with broadband wall static pressure fluctuations (
$f<10f_{c}$
). The vortices persist for a significant distance and are able to influence the positions of downstream shocks as they convect past each shock foot.(iii) Acoustic waves generated in the diffuser: these acoustic waves propagate upstream through the subsonic portion of the boundary layer at approximately
$0.1u_{a}$
–
$0.2u_{a}$
and are associated with low-frequency (
$f<0.6f_{c}$
) wall static pressure fluctuations. The acoustic waves do not influence the motion of the downstream shocks but do impact the leading shock position as they pass the shock foot.


Each of the perturbations described above has a direct and indirect influence on the unsteady motion of the shock train. A direct influence occurs when the perturbation causes a locally significant change in flow properties, and as a result, the perturbation induces a shock displacement as it passes the shock foot. For example, the vortices generated by the separation bubble shear layer travel downstream and have a direct influence on the motion of all the downstream shocks. The acoustic waves (either generated in the diffuser or by the separation bubbles) only have a direct influence on the leading shock. The local effects of the acoustic waves are negligible in the downstream flow and thus do not impact the motion of the downstream shocks. This is attributed to the thick, distorted boundary layer that grows along the length of the shock train. In comparison, the thin boundary layer at the leading shock foot is more receptive to the disturbances created by the acoustic waves.
The shock motion due to the direct influence of the perturbation instigates a sequential displacement of the downstream shocks, referred to as the indirect influence of the perturbation. This process begins when the displacement of an upstream shock changes the flow structure of the expansion–compression region between shocks. In response, the downstream shock moves to satisfy the new inflow conditions and the required downstream pressure rise. The time delay between sequential shock motions is relatively long and corresponds to the response time of the flow structure. Note that the indirect influence is a consequence of the direct influence of the perturbation. Thus, without a direct influence, there will be no indirect influence. Overall, the shock train inherent unsteadiness results from the superposition of the direct and indirect influences of each perturbation. This superposition might not necessarily be linear since coupling between different perturbations may occur and lead to complex shock train dynamics.
While the unsteadiness characteristics detailed in this work are specific to the flow conditions and isolator geometry of the University of Michigan direct-connect isolator model, similar perturbation sources and mechanisms are expected under other conditions. A scaling argument for the shock train unsteadiness characteristics is attempted. The approach velocity and pseudoshock length are chosen as characteristic velocity and length scales, respectively, because they are global metrics that describe the overall state of the system. It is argued that the different fluid processes that generate perturbations are all related to these global quantities. Unfortunately, the proposed scaling argument cannot be verified because there are no other studies with well-documented measurements of the flow conditions and shock train unsteadiness. However, this work introduces the scaling discussion by determining what fluid processes impact the shock motion. Ultimately, understanding the underlying phenomena that cause shock train inherent unsteadiness provides insight on the true scaling argument.
Acknowledgements
This work was partially funded by the National Science Foundation Graduate Research Fellowship Program under grant no. DGE 1256260. The authors would like to thank R. Morajkar and L. Edelman for their help in conducting some of the experiments. We would also like to thank K. Berger for the initial guidance on oil flow visualization. Finally, we would like to acknowledge A. Auslender and J. Driscoll for their valuable feedback on this work.
Supplementary movie
Supplementary movie is available at https://doi.org/10.1017/jfm.2018.927.