INTRODUCTION
Rice–wheat the major cropping system in Indo-Gangetic Plains (IGP) of South Asia (Timsina and Connor, Reference Timsina and Connor2001). Between the 1960s and 1990s there were large increase in rice and wheat yields and increased areas under cultivation of the RW cropping systems due to adoption of improved varieties, expansion of irrigation areas and increased use of chemical fertilizers and pesticides (Ladha et al., Reference Ladha, Fischer, Hossain, Hobbs and Hardy2000). Rice replaced traditional crops of maize, groundnut and pearl millet, and wheat replaced barley, mustard and pulses. However, the RW system has threatened environmental safety and promoted degradation and inefficient use of natural resources, particularly land and water (Gupta and Seth, Reference Gupta and Seth2007). It has also resulted in a number of ecological and other problems such as development of hardpan, low input use efficiency, including water, and emergence of insects–pests as well as environmental pollution through emission of greenhouse gases (Humphreys et al., Reference Humphreys, Kukal, Christen, Hira, Singh, Yadav and Sharma2010). Furthermore, there is a great concern about groundwater depletion in large areas of northwest (NW) India where the RW system prevails (Ambast et al., Reference Ambast, Tyagi and Raul2006; Hira, Reference Hira2009; Rodell et al., Reference Rodell, Velicogna and Famiglietti2009). The enhanced RW production in Punjab in northwest India is occurring at the cost of exploitation of natural resources such as water, soil and air. The diversification of the RW system by replacing rice with less water requiring crops such as maize, soybean and pigeonpea can enhance crop and water productivity of the system, and sustain soil health and environment quality. Soybean (Glycine max L.) has significantly less water requirement than rice and it could meet on average 58% of its nitrogen (N) requirement through biologically N2 fixation (Salvagiotti et al., Reference Salvagiotti, Cassman, Specht, Walters, Weiss and Dobermann2008).
Therefore, with the development of efficient production technology, a part of area under rice–wheat could be brought under soybean–wheat (SW) cultivation under irrigated conditions. Furthermore, it would help enhance production of edible oil as India is producing only 55% of its edible oil requirement.
Conventionally, soybean and wheat are planted on flat, and water management is by flood irrigation with low water use efficiency (WUE). The conventional practice of excessive tillage, involving 6–8 tillage operations, consumes a high proportion (25–30%) of total operational energy used in crop production (Sidhu et al., Reference Sidhu, Singh, Singh and Ahuja2004). Conservation tillage practices, such as no-tillage (NT) and permanent raised beds (PBs) combined with straw mulching, may offset production costs and other constraints associated with land preparation (Hobbs, Reference Hobbs2001). Research work in India and abroad has indicated that wheat can be timely planted with reduced cost using no-tillage technology (Hobbs, Reference Hobbs2001; Malik et al., Reference Malik, Yadav and Singh2004; Singh and Ladha, Reference Yadvinder-Singh, Ladha, Lal, Hobbs, Uphoff and Morris2004). No-tillage has been widely reported to improve WUE and soil health across a range of soil types, cropping systems and climate besides sustaining productivity of soil and protecting environment (Hobbs, Reference Hobbs2007). The potential benefits of no-tillage can be fully realized only when it is practised continuously and soil surfaces remain covered with previous crop residues (Sidhu et al., Reference Sidhu, Singh, Humphreys, Yadvinder-Singh, Singh, Dhillon, Blackwell, Bector, Singh and Singh2007).
Permanent raised beds offer the opportunity to reduce tillage and irrigation water inputs (Connor et al., Reference Connor, Timsina, Humphreys, Ladha, Hill, Duxbury, Gupta and Buresh2003). The PB remains in place with minimal renovation or reworking for several years. A change from growing crops on flat to raised beds offers more effective control of irrigation water and drainage, thereby reducing aeration stress and increasing yields. Permanent raised beds can prove more beneficial to water sensitive crops, such as maize and legumes, than to rice grown on poorly drained fine-textured soils. While potential benefits of PB for wheat production after rice in northwest IGP have been reported (Singh et al., Reference Yadvinder-Singh, Humphreys, Kukal, Dhillon, Singh, Kaur, Thaman, Prashar, Yadav, Kaur, Smith, Timsina and Gajri2008), evaluation of such beds for soybean in rotation with wheat in terms of yield and water productivity has received little attention. Dhadli et al. (Reference Dhadli, Singh, Yadvinder-Singh and Singh2009) reported 15–30% higher yield of soybean and 16% higher for the following wheat on raised beds compared with conventional tillage (CT) and no-tillage in SW rotation on a clay loam soil mainly due to avoidance of aeration stress compared with excessive wet conditions under flat system.
In northwest India soybean is sown in the hot, dry month of June when soil temperature can rise to 49 °C. Mulch with crop residues modifies hydrothermal regime of soil surface by reducing soil temperature during summer and acting as a barrier against water loss. Sekhon et al. (Reference Sekhon, Hira, Sidhu and Thind2005) reported that wheat straw mulch (SM) applied to soybean helped in lowering the temperature and reducing evaporation losses. Mulching increased soybean yield by 4.4 to 68.3% and depended on amount and distribution of rainfall. Limon-Ortega et al. (Reference Limon-Ortega, Sayre and Francis2000) observed that PB with straw retention had the highest mean wheat grain yields and N-use efficiency, with positive implications for soil health. Tillage practice adopted in one crop will considerably influence establishment and performance of succeeding crops grown in the system, and may depend on soil and climatic considerations (temperature and rainfall) of the location (Tomar et al., Reference Tomar, Garg and Gupta2006).
Limited information is available on influence of tillage, planting systems and straw mulch for the SW system on crop productivity, efficiency of applied irrigation water and economics. There is an urgent need to reduce the cost of cultivation and increase profitability by developing and adopting reduced tillage technologies in the current and future cropping systems of northwest IGP. A better understanding of the long-term sustainability of the SW system in relation to tillage, crop establishment, straw mulch and water is needed. The present study was therefore designed to determine the effect of different tillage, raised bed planting and straw mulch on growth, yield, WUE and economics of the irrigated SW system under the climatic conditions of northwest IGP of India.
MATERIALS AND METHODS
Experimental site and climatic conditions
The field experiment was initiated in June 2003 on the experimental farm of Punjab Agricultural University (PAU) at Ludhiana (30°56′ N, 75°52′ E; 247 m asl), India. Soil at the experimental site is deep alluvial loamy sand, Typic Ustochrept, low in organic carbon (4.2 g C kg−1 at 0–15 cm) and slightly alkaline (pH 7.2). This region has a sub-tropical climate, with hot, dry to wet summers (June–October) for soybean and cool, dry winters (November–April) for wheat. Average annual rainfall of last 30 years is 650 mm, constituting 44% of pan evaporation. The reported values of evapotranspiration for soybean and wheat crops are 550–600 mm and 380–420 mm respectively (Jalota and Arora, Reference Jalota and Arora2002). The depth to the groundwater was over 15 m during the study period. Mean minimum and maximum temperatures during the soybean season (June–October) were 23 °C and 33 °C and during the wheat season (November–March) temperatures were 13 °C and 27 °C respectively.
Experimental layout and treatments
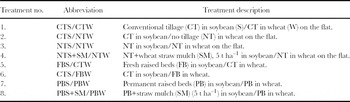
The experiment comprised eight different treatment combinations consisting of conventional and no-tillage, on flat and raised beds (fresh (FB) or permanent (PB)), with or without wheat straw mulch over five years (10 crops) in a randomized complete block design with four replicates (see Table 1 for details of all treatments).
Description of treatments.

The randomization of plots was adjusted so that the same layout (flat or raised beds) occurred in the corresponding plots in replicates 1 and 2 and replicates 3 and 4. This was done to provide longer runs for bed planter and to eliminate the need to turn tractor across beds. Wheat straw at 5 t ha−1 as per treatment was applied within two days after sowing (DAS) of soybean. Plot size was 7 × 4.02 m, with earth bunds around each plot. The PB treatments were established in the previous non-experimental wheat crop planted in November 2002. Raised beds were initially formed after conventional tillage using a four-wheel tractor with a bed former and seeder attachment. The total bed size (mid-furrow to mid-furrow) was 67.5 cm, bed width from top of 37.5 cm, and bed height was 20 cm. The beds were maintained permanently from crop to crop with reshaping as necessary using a four-wheel tractor. Permanent beds were renovated (mostly in furrows) before the sowing of each crop. Each bed had two rows of both soybean and wheat. The cropping pattern was continued over five years, starting with soybean sown in June 2003.
Crop management
A pre-sowing irrigation of 10-cm depth was given to each crop. The furrows of PB of soybean (PBS)/PB of wheat (PBW) (with or without SM) treatments were cleaned and beds were reshaped in a single pass using tractor-driven bed planter with little disturbance to beds. For flat treatments, there was one dry cultivation with tractor disc hoe followed by two runs of comb harrows and two plankings. A wooden plank was used to break clods and level the field. Fresh beds were prepared after conventional tillage followed by bed formation and sowing in a single pass with bed planter. Well-decomposed farmyard manure (10 t ha−1, on a fresh weight basis, containing about 45% moisture) was applied to soybean plots, and uniformly spread before sowing and reshaping of PBs each year.
Soybean seed (cultivar SL 295 in 2003 and 2004 and cultivar SL 525 in 2005–2007) at 60 kg ha−1 was sown with a bed planter on raised beds and with a seed-cum-fertilizer drill in flat plots between 15 and 20 June of different years. In flat plots, soybean was sown with a row spacing of 45 cm and plant-to-plant spacing of 4–6 cm. The plant-to-plant spacing on the beds was adjusted to keep population density similar on flats and raised beds. Two rows of wheat (cultivar PBW 343) were planted on top of each bed with 20-cm spacing between the rows, and 47.5-cm spacing between the rows on adjacent beds with a tractor-drawn drill. Wheat on flat plots was sown with a tractor-driven seed-cum-fertilizer drill (in CTW treatments) or a zero tillage drill with inverted-T openers (in NTW treatments) with 20-cm row spacing.
Wheat was sown at 100 kg ha−1 in flat plots and 75 kg ha−1 on raised beds between 5 and 12 November of each year, but usually by 10 November. Fertilizers (120, 26, 25 kg ha−1 of N, P and K respectively) were applied to each crop. All the fertilizers were applied at the time of sowing of soybean crop. To wheat, half of N and full doses of P and K were applied at sowing, while the remaining N was top-dressed at first irrigation. Urea, diammonium phosphate and muriate of potash were used as source of nutrients. Weeds were well controlled in soybean using Stomp 30EC (pendimethalin) at 1.50 kg ha−1 one day after sowing. To control weeds in wheat, Arelon 75WP (isoproturon) at 1.25 kg ha−1 plus 2,4-D sodium salt (80%) at 0.625 kg ha−1 (35 DAS) were used to control grass and broadleaf weeds respectively. The soybean and wheat were hand-harvested and the stubbles were removed at ground level. Soybean was harvested from 20 to 30 October and wheat from 6 to 14 April of each year.
Irrigation management
A ‘Parshall flume’ was used to quantify water applied during irrigation to both crops. At each site, all plots were irrigated on the same day prior to cultivation and sowing, and again on the same day 2–4 weeks after sowing in each year. The depth of irrigation water for both soybean and wheat during each irrigation event was 75 mm for flat layouts and 50 mm for raised beds. Soybean received one irrigation in both flat and PBs during 2003, five irrigations on flat and six irrigations on PBs during 2004 and 4–6 irrigations in both flats and PBs in remaining years. Wheat received three (in 2004/2005) to six (in 2005/2006) irrigations on both flats and PBs.
Data collection and analysis
Crop growth and yield
For periodic dry matter of plants, two plants for soybean and 1-m row length for wheat were randomly selected during each sampling. In wheat, samples were taken at early tillering (30 DAS) and anthesis whereas in soybean, samples were taken at the developed green bean and physiologically maturity stages. In soybean, number of pods per plant, number of grains per pod and test weight were recorded from five plants in each plot. In wheat, spike counts were done from two 1-m long rows in each plot in the first two years. The spike length and number of grains per spike were recorded from 10 randomly selected spikes from each plot. At maturity, grain and straw yields were determined from an area of 10.8 m2 in the middle of each plot. Moisture content in grain and straw was determined by drying sub-samples at 70 °C, and yields were reported on dry weight basis.
Light interception
Light interception was measured in soybean at developed green bean and physiological maturity, and in wheat crop it was measured at 30 days after sowing, booting (ear peep) and anthesis, using a 1-m long Licor-R quantum line sensor. Measurements were made above crop canopy (Io) and at soil surface under the canopy (Is) at three sites in each plot. The sensor was positioned at an angle across plant rows so that the readings were taken mid-row to mid-row across two adjacent beds or two (soybean)/four rows (wheat) on the flat layouts. Light interception by the canopy (LIC) was calculated as a percentage of total incident radiation using the following relationship:
 \beginequation*
\rm LIC = (Io - Is)/Io\; \times \;100.\endequation*
Soil temperature
Soil temperature in the seeding depth at 5.0 cm in the central row/bed of each plot was recorded in the afternoon (1430 hours) up to emergence and at different crop growth stages.
Water use and water use efficiency
Soil samples up to 180-cm soil depths were taken for determining soil moisture content at sowing and harvest in all treatments. The WUE was calculated as explained by Singh et al. (Reference Singh, Gandhi and Raheja1960) by the following formula taking into account effective rainfall, soil profile moisture contributions and depth of irrigation water applied:
 \beginequation*
\rm WUE\,(\rm kg\,\rm ha^ - 1 \,\rm cm^ - 1 ) = \rm grain\,\,\rm yield\,(\rm kg\,\rm ha^ - 1 )/\rm water\,\,\rm use\,(\rm cm).\endequation*
Soil bulk density and infiltration rate
The soil bulk density (0–15 cm) was measured after wheat harvest in 2004/2005 season (after two crop cycles) and 2007/2008 season (after five crop cycles). Bulk density was determined using core method. The cumulative infiltration of water through soil was measured after wheat harvest in 2007/2008 season using a double-ring infiltrometer (Burgy and Luthin Reference Burgy and Luthin1956).
Economic analysis
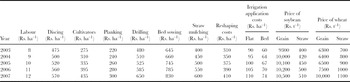
The cost of cultivation was calculated taking into account cost of seeds, fertilizers, biocides and wheat straw for mulch, hiring charges of manual labour and machine used (discing, cultivator, planking, seed-cum-fertilizer drill, bed planter, reshaping of permanent beds) for land preparation and sowing, irrigation and fertilizer application, plant protection, harvesting and threshing, and the time required (h ha−1) to complete individual field operation. The yearly labour wages, cost of machine used for different tillage and seeding operations, labour cost for applying irrigation and market price of grain and straw of maize and wheat are given in Table 2. The cost of irrigation pumping was calculated as charged by Punjab State Electricity Board (PSEB). The cost of electricity to run electric pumps charged by PSEB from farmers was taken as Rs. 75, 80, 90, 100 and 110 per horsepower (hp) in 2003, 2004, 2005, 2006 and 2007 respectively. A submersible pump with 10-hp motor is adequate to irrigate 6-ha farmland with flat layout (75-mm irrigation depth) or 9 ha with PBs (50-mm irrigation depth). The cost of manual and machine labour and diesel for each year was taken as per the government of India norms. The gross income and net returns were calculated on the basis of market price for soybean and wheat at the time of harvest for each year (Table 2). Cost of wheat straw and soybean stover was also considered for calculating the gross income of cropping system. The net returns were calculated by subtracting total variable costs from the gross income.
Labour charges, machine charges, straw mulching, reshaping of beds, irrigation application costs, soybean and wheat prices in different years.

Statistical methods
The data on crop and soil water were subjected to analysis of variance (ANOVA) by using IRRISTAT version 9.2 (IRRI, 1992). The crop data were analysed keeping years as the main effect and treatments as the sub-effect using split-plot design. The comparison of treatment means was made by least significant difference (LSD) at p = 0.05. Since there were no significant year × treatment interactions, mean effects are presented and discussed.
RESULTS
Weather
Monthly distribution of rainfall and minimum and maximum temperatures for the experimental period (June 2003–April 2007) have been presented elsewhere (Ram et al., Reference Ram, Yadvinder-Singh, Saini, Kler, Timsina and Humphreys2012). Mean minimum and maximum temperatures during the soybean growing seasons (June–October) showed small variations in temperatures. During the wheat growing seasons (November–April), minimum temperature during November–December was below the long-term average (LTA) in 2005/2006 and above LTA from February to April in 2003/2004 and 2006/2007. Rainfall during August was below LTA in 2007/2008 and above LTA in 2003/2004 and 2004/2005. Rainfall was below LTA in July in 2005/2006.
Soil temperature
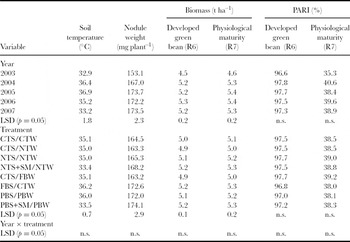
The soil temperature at the seeding depth (5 cm) measured at 2:30 pm during soybean emergence was significantly lower in 2003 and 2007 than other years (Table 3). The highest soil temperature was recorded in 2005. Wheat straw mulch in soybean under no-tillage and permanent bed treatments significantly reduced mean maximum soil temperature at seeding depth by 1.6 °C and 2.5 °C compared with no mulch treatments (NTS and PBS). The soil temperature did not vary among other treatments except for an increasing trend in soil temperature on raised beds. It might be due to exposure of more surface area to incident solar radiation in PBs than in flat conventional treatments.
Soil temperature, nodule weight, biomass and photosynthetically active radiation interception (PARI %) in soybean in different years and treatments.
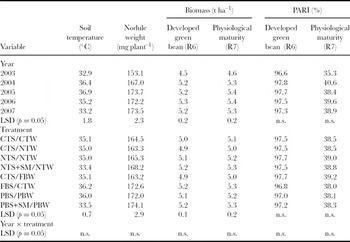
Note: LSD: least significant difference; n.s.: not significant.
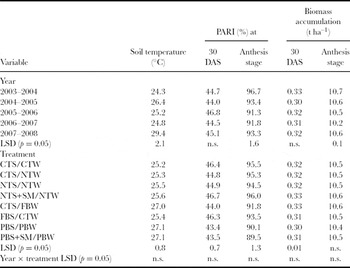
In wheat, soil temperature in the 2007/2008 season was significantly higher than in other seasons (Table 4). In raised beds (CTS/FBW, PBS/PBW, PBS+SM/PBW), soil temperature was significantly higher (mean of 27.1 °C vs. 25.4 °C) compared with flat treatments (CTW and NTW) up to emergence of crop. Soil temperature remained similar when compared separately in flat layout and raised bed treatments. There was no effect of straw mulch applied to the previous soybean crop on soil temperature in wheat.
Soil temperature in seeding zone during emergence, PARI (%) and biomass accumulation of wheat under different years and treatments.

Note: LSD: least significant difference; n.s.: not significant.
Photosynthetically active radiation interception (PARI)
The PARI values were similar during all the five years of study period (Table 3) but in 2003 there was comparatively less PARI. The PARI values in soybean at developed green bean stage were similar and ranged from 96.6 to 97.8% in all the treatments. However, there was an increasing trend in PARI for straw mulch treatments due to better crop growth as compared with no mulch treatments. The PARI was 1 to 1.2% higher in straw mulch treatments as compared with unmulch treatments.
The trends for PARI in wheat were consistent with the biomass observations (Table 4). PARI did not differ for different years measured at the two growth stages (30 DAS and anthesis) of wheat. The PARI values at the two growth stages were significantly lower in PBs compared with flat layout. The differences in PARI in flat and PBs were greater at 30 DAS and decreased with advancement in crop growth.
Biomass accumulation
The dry biomass accumulation by soybean differed significantly for all years of the study (Table 3). Dry biomass at both stages (green developed bean and physiological maturity) was highest in 2006, which was significantly higher than in 2003. The dry biomass accumulation by soybean at these two stages was greater in straw mulch plots on both flat and PBs (NTS+SM and PBS+SM). The dry biomass accumulation in wheat was higher during 2003/2004 and 2004/2005 than in other years (Table 4). Wheat accumulated less dry biomass in PBs compared with flat layouts at 30 days after seeding and at anthesis, which can be ascribed to lower plant population as a result of lower seed rate used on beds. Permanent raised beds had significantly lower dry matter accumulation than fresh beds and flat layouts at 30 days after sowing but the results were non-significant at the anthesis stage.
Soybean yield and yield attributes
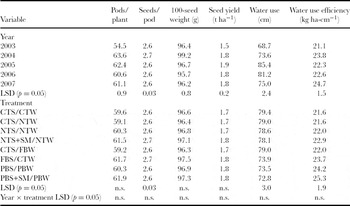
The yield attributing characters of soybean differed between years with the highest number of pods per plant, seeds per pod and 1000-seed weight in 2004, which were significantly higher than all other years. The yield attributing characters, such as number of pods per plant and 1000-seed weight, were, however, not influenced by different treatments (Table 5). However, the highest seeds per pod were recorded in PBs with mulch (PBS+SM/PB), which was statistically at par with all raised bed layouts and mulched no-tillage treatment (NTS+SM/NT) but significantly higher than rest of flat layouts. The seed yield of soybean differed during five years of the study period with the highest seed yield of 1.9 t ha−1 in 2005. Seed yield in 2005 was significantly higher than in 2003 but was statistically at par with rest of the years of the study. The seed yield was not significantly influenced by layouts although PBs with straw mulch (PBS+SM/PBW) had the highest seed yield.
Pods/plant, seeds/pod, 100-seed weight, seed yield, water use and water use efficiency (WUE) in soybean in different years and treatments.

Note: LSD: least significant difference; n.s.: not significant.
Wheat yield and yield attributes
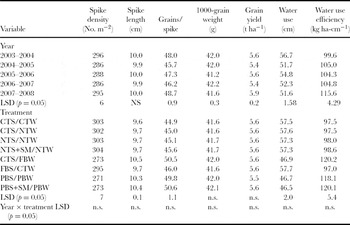
The spike density was significantly lower during 2004/2005 compared with 2003/2004 and 2007/2008 but was at par with other years (Table 6). Spike length, however, was not significantly influenced by years. Grains per spike were significantly higher in 2007/2008 than in other years except that in 2003/2004. Likewise, 1000-grain weight was significantly higher in 2006/2007 than 2005/2006 and 2007/2008 but was statistically at par with rest of the years. Spike density was significantly lower on PBs compared with flat layout due to wider row spacing. Spike density was similar on fresh and PBs and was not influenced by straw mulching in the previous soybean (Table 6). Spike length (10.4 cm vs. 9.7 cm) and number of grains per spike (50.3 vs. 45.3) were greater in raised beds than with flat layout. Test weight of wheat was similar under different treatments.
Spike density, spike length, grains/spike, 1000-grain weight, grain yield, water use and water use efficiency (WUE) in wheat in different years and treatments.

Note: LSD: least significant difference; n.s.: not significant.
Grain yield of wheat did not vary significantly among different tillage, planting systems and straw mulch treatment during any of the years. Spike length and number of grains/spike were significantly higher in fresh as well as permanent raised bed treatments than all the flat layout treatments. The NT treatments produced grain yield similar to the CT treatments.
Water use and water use efficiency in soybean
Total water use by soybean was significantly lower in 2003 and higher in 2005 (Table 5). WUE was highest in 2007 due to better distribution of rainfall and better crop yield than during other years. Water use of soybean was lower by 5.42 cm on raised beds (FBS, PBS, PBS+SM) compared with flat layouts. Based on the five-year (2003 to 2007) average, soybean on raised beds had about 6.8% less WUE and 11.5% higher WUE than that in CTS/CTW. There was slight effect of straw mulch on water use and WUE in soybean.
Water use and WUE in wheat
Total water use by wheat was higher during 2003/2004, and WUE was the highest during 2006/2007 than during other years (Table 6). The crop received more irrigation water during the above two years due to unfavourable distribution of rainfall. Wheat on raised beds had 18.8% lower water use (averaged across treatments and years) than on flat layout (treatments with CTW or NTW). Similarly, WUE on raised beds was 22.3% more (averaged across treatments and years) than on flat layout.
Costs and economic analysis
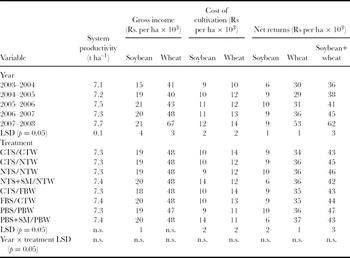
Gross income and net returns increased over the years due to increase in the prices of produce. Likewise, variable costs also increased due to increase in the cost of cultivation (Table 7). The gross income from soybean was similar but significantly higher for latter four years than for the first year (2003/2004). The net income from soybean was the highest in 2005/2006. In wheat, the highest gross and net returns were obtained in 2007/2008 due to higher price of wheat (Table 2). Table 7 reveals that higher gross income (Rs. 20,000 ha−1) can be obtained from soybean grown under PBS+SM/PBW, PBS+SM/PBW or FBS/CTW systems. Net return was significantly higher in NTS+NTW and PBS/PBW systems and lower in SM treatments (PBS+SM/PBW and NTS+SM/NTW systems) compared with other treatments. The variable cost was significantly lower in NTS and PBS compared with other treatments. In wheat, while gross income was significantly similar in all the treatments, the variable costs were significantly lower in PB treatments than in CTW and FBW. The variable costs in PBW treatments were at par with NTW treatments. The net returns (Rs. 47,000–46,000 ha−1) for the SW system were significantly higher from PBS/PBW and NTS/NTW treatments than for other treatments. Definitely, under situations where wheat straw has no economic value, NTS+SM/NTW and PBS+SM/PBW will provide higher net returns. Indeed, the higher return over variable costs in the PB system clearly corroborates the findings of Sayre and Limon-Ortega (Reference Sayre and Limon-Ortega2002). Landers et al. (Reference Landers, Saturnino, de Freitas, Saturnino and Landers2001) have previously recorded higher net income under NT compared with CT. Our study showed economic benefits of adopting double no-tillage and permanent raised bed planting in SW system in northwest India.
System (soybean+wheat) productivity, gross income, variable costs and net returns in different years and treatments from the soybean–wheat (SW) system.

Note: LSD: least significant difference; n.s.: not significant.
Soil properties
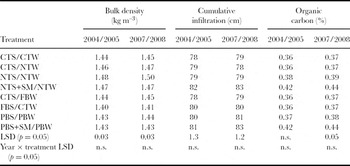
Soil bulk density in 0–15-cm layer recorded after the second (wheat 2004/2005) and fifth year (wheat 2007/2008) of cropping was significantly affected by tillage and planting systems (Table 8). Fresh beds (FBS/CTW) and permanent beds resulted in significantly lower bulk density than the other treatments. Double no-tillage plots without straw mulch (NTS/NTW), CTS/NTW and NTS+SM/NTW resulted in significantly higher bulk density than the other treatments. Application of straw mulch to preceding soybean showed no effect on soil bulk density. The infiltration rate after five years of study on raised beds and NT+SM was significantly higher than all other treatments (Table 8). Organic carbon after two years of experimentation was not influenced significantly. However, organic carbon in mulched plots of no-tillage (NTS+SM/NTW) and permanent beds (PBS+SM/PBW) was significantly higher than all the unmulched treatments.
Soil bulk density, cumulative infiltration and soil organic carbon content in different treatments after wheat harvest.

Note: LSD: least significant difference; n.s.: not significant.
System productivity and profitability
System productivity was the highest (7.7 t ha–1) in 2007/2008 followed by 2005/2006 and the lowest (7.1 t ha–1) in 2003/2004. The higher system productivity in 2003/2004 and 2005/2006 than during other years of the study period was due to higher yields of both soybean and wheat. The lowest system productivity in 2003/2004 was due to low yields of soybean compared with other years. Similar to grain yields of soybean and wheat, system productivity (soybean+wheat) was similar under different tillage, layout and mulch treatments (Table 7).
Gross income from soybean was significantly higher in NT and PBs with straw mulch, and fresh beds in soybean followed by CT in wheat compared with other treatments (Table 7). Gross income from wheat was similar under different treatments. Cost of cultivation in soybean was significantly higher in treatments with straw mulch and the lowest in NT and PB treatments without straw mulch. In wheat, cost of cultivation was the lowest in PBs followed by NT treatments. Net returns from soybean were significantly lower in mulch treatments than in all the other treatments. In wheat, net returns were significantly higher in NT and PBs compared with other treatments. The net returns from the SW system were significantly higher in NT and PB treatments without straw mulch compared with conventional tillage, and PB and NT treatments with straw mulch.
DISCUSSION
Effect of tillage and layout on crop growth and yields of soybean and wheat
The increasing trend observed in soil temperature on raised beds was possibly due to exposure of more surface area to incident solar radiation in PBs than in flat conventional treatments. The higher temperatures on PBs can help in early germination and seedling emergence, particularly in winter season crops such as wheat. The yield attributing characters, such as number of pods per plant and 1000-seed weight and thereby seed yield of soybean, were not influenced by tillage and field layout. A similar trend in maize was earlier reported by Ram et al. (Reference Ram, Yadvinder-Singh, Saini, Kler, Timsina and Humphreys2012). The lower biomass accumulated by wheat in PBs compared with flat layouts at 30 days after seeding could be ascribed to lower plant population as a result of lower seed rate used on beds. Similarly, lower values of PARI in wheat on PBs compared with flat layout were due to lower plant population as well as lower leaf area index. In earlier studies, Singh et al. (Reference Yadvinder-Singh, Humphreys, Kukal, Dhillon, Singh, Kaur, Thaman, Prashar, Yadav, Kaur, Smith, Timsina and Gajri2008) reported less dry matter accumulation in early stages of bed-planted wheat due to lower population on beds, and light interception in wheat was greater in treatments with the higher biomass production. Spike density was significantly lower on PBs due to wider row spacing but it was compensated by higher spike length and more number of grains per spike in PBs compared with flat layout, thus resulting in similar grain yields in all the treatments. The longer spikes in bed-planted wheat were possibly due to wider spacing, which provided better light conditions in the canopy for photosynthesis than with wheat on flat layout. In earlier studies on RW and MW systems, Singh et al. (Reference Yadvinder-Singh, Humphreys, Kukal, Dhillon, Singh, Kaur, Thaman, Prashar, Yadav, Kaur, Smith, Timsina and Gajri2008) and Ram et al. (Reference Ram, Yadvinder-Singh, Saini, Kler, Timsina and Humphreys2012) also reported lower spike density and longer spikes but similar wheat yield under PBs compared with flats. Consistent with our results, Ram et al. (Reference Ram, Yadvinder-Singh, Saini, Kler, Timsina and Humphreys2012) and Nagarajan et al. (Reference Nagarajan, Singh, Singh and Singh2002) also reported similar grain yield of wheat under CT and NT treatments. There are, however, many reports of higher yields of wheat under NT than CT and this is likely due to more timely sowing in NT system than late sowing in CT system (Malik et al., Reference Malik, Yadav and Singh2004; Singh and Ladha, Reference Yadvinder-Singh, Ladha, Lal, Hobbs, Uphoff and Morris2004). In our study, as all wheat treatments were sown on the same date within optimum sowing window, yields for both NT and CT were similar. The benefits of raised beds for upland crops (soybean and wheat) in fine-textured soils prone to waterlogging have been clearly demonstrated in other parts of the world (Batchelor et al., Reference Batchelor, Collins and Parsons1980; Thompson and North, Reference Thompson and North1994). However, symptoms of waterlogging after heavy rains or flood irrigation on flats were not observed in our experiments, possibly due to coarse textured soil.
Effect of tillage and layout on water use efficiency
The raised beds received less irrigation water in both soybean and wheat than the flat layouts resulting in lower water use and higher WUE on beds. Ram et al. (Reference Ram, Yadvinder-Singh, Saini, Kler, Timsina and Humphreys2012) also reported lower water use and high WUE in bed-planted soybean and wheat. Earlier studies (Aggarwal and Goswami, Reference Aggarwal and Goswami2003; Ram et al., Reference Ram, Yadvinder-Singh, Timsina, Humphreys, Dhillon, Kumar and Kler2005) have also reported similar or higher yields of wheat on raised beds compared with flat with 30–50% reduction in irrigation water use on beds. Higher gross income and net returns obtained from soybean and wheat grown under PBs and NT treatments were due to higher yields and lower variable costs compared with other treatments. Indeed, higher returns over variable costs in the PB system clearly corroborate the findings of Sayre and Limon-Ortega (Reference Sayre and Limon-Ortega2002). Landers et al. (Reference Landers, Saturnino, de Freitas, Saturnino and Landers2001) have previously recorded higher net income under no-tillage compared with conventional tillage. Our study showed economic benefits of adopting double no-tillage and permanent raised bed planting in SW system in northwest India.
Effect of tillage and layout on soil properties
The higher bulk density recorded in NT treatments might be due to an undisturbed soil surface as a result of direct seeding of crops. These results are in conformity with those reported earlier by Yang et al. (Reference Yang, Ping, Ping, Qing and Fei1999) and Kumar et al. (Reference Kumar, Singh, Yadav, Malik and Hobbs2002). More infiltration observed in no-tillage and PB plots might be due to the minimal disturbance of pore continuity. In an earlier study, Shaver et al. (Reference Shaver, Peterson, Ahuja, Westfall, Sherrod and Dunn2002) reported higher infiltration in no-tillage than in conventional tillage plots. Organic carbon after two years of experimentation was not influenced significantly.
Effect of straw mulch on crop yields, WUE and soil properties
Wheat straw mulch acted as a physical barrier in reducing the impact of solar radiation, which lowered the soil temperature, than in the bare soil during early growth period of soybean. Consistent with our study, Sekhon et al. (Reference Sekhon, Hira, Sidhu and Thind2005) reported marked reduction in soil temperature with straw mulch in soybean over no mulch. Since a major fraction of straw mulch got decomposed during soybean cropping season, its effect on soil temperature was not observed in the following wheat. The higher dry biomass accumulation by soybean at green developed bean and physiological maturity stages in the mulched treatments was possibly due to more leaf area index and PARI as reported for maize in maize–wheat system in the similar environment (Ram et al., Reference Ram, Yadvinder-Singh, Saini, Kler, Timsina and Humphreys2012). Straw mulch showed positive effects on soybean yield due to increase in seed numbers per pod compared with no mulch, particularly in no-tillage and PB treatments. Similarly, straw mulch has slight positive effect on water use and WUE in soybean. Straw mulch, however, is likely to have greater positive effects on yield and WUE under limited water supply situations.
In the following wheat, straw mulch showed no effect on tiller density, spike length and test weight, and eventually on grain yield of wheat. The lower net returns recorded in mulch treatments were due to high economic value of wheat straw. Definitely, under situations where wheat straw has no economic value, it will provide higher net returns in no-tillage and PB treatments. Application of straw mulch to soybean continuously for five years showed no effect on soil bulk density in the SW system. Sarkar and Kar (Reference Sarkar and Kar2011), however, reported that application of crop residues reduced soil bulk density irrespective of puddling and tillage treatments in the RW system. Soil type, sampling depth and cropping system are known to influence the effect of straw mulch on soil bulk density as well as other physical properties. Straw mulch significantly increased soil organic carbon content under no-tillage and permanent beds over unmulched treatments. It has been well documented that crop residue recycling increases soil organic carbon and total N contents (Yadvinder-Singh et al., Reference Yadvinder-Singh, Bijay-Singh and Timsina2005; Reference Yadvinder-Singh, Gupta, Singh, Singh, Sidhu and Bijay-Singh2009).
System productivity and profitability
Our study shows that NT- and PB-based SW with no mulch has potential to replace conventional practice of growing soybean and wheat without yield penalty on system basis. The no-tillage and permanent bed systems were most profitable due to saving of labour, time, water and energy costs. There are several reports showing savings in irrigation water, labour and production costs, and higher net economic returns in no-tillage and permanent bed compared with conventional tillage systems (Ladha et al., Reference Ladha, Kumar, Alam, Sharma, Gathala, Chandana, Saharawat, Balasubramanian, Ladha and Hardy2009; Jat et al., Reference Jat, Gathala, Ladha, Saharawat, Jat, Kumar, Sharma, Kumar and Gupta2009). Wheat straw mulch in soybean did not increase crop yields but has high economic value as animal fodder, thereby mulching provided low returns.
CONCLUSIONS
Our study shows that grain yields of both soybean and wheat were similar irrespective of tillage, crop establishment and straw mulching on coarse-textured loamy sand. However, in overall performance parameters (grain yield, irrigation water use, water productivity and economic returns), permanent bed and no-tillage were the best treatments. Permanent raised bed planting may still prove more useful than double no-tillage system on fine-textured soils where crops are prone to flooding. The no-tillage and permanent beds need to be popularized among farmers of northwest IGP for improving yields, water productivity, profitability and sustainability of the SW system.
Acknowledgements
We are highly thankful to Australian Centre for International Agricultural Research (ACIAR) for providing financial support to this study.