

1. Introduction
Carbon pricing (by means of a carbon tax or a cap-and-trade system) is an efficient instrument to reduce emissions (Somanathan et al., Reference Somanathan, Sterner, Sugiyama, Chimanikire, Dubash, Essandoh-Yeddu, Fifita, Goulder, Jaffe, Labandeira, Managi, Mitchell, Montero, Teng, Zylicz, Angelsen, Aoki, Asano, Betsill and Bhandary2014) and avoid future lock-in into carbon-intensive energy systems (Mattauch et al., Reference Mattauch, Creutzig and Edenhofer2015). The High-Level Commission on Carbon Prices recommends global carbon prices between USD40–80/tCO2 by 2030 for efficient emissions reduction (Carbon Pricing Leadership Coalition, 2017). While absolute emissions are arguably low, countries in Sub-Saharan Africa (SSA) carbonise rapidly, with 8 of 10 of the world's fastest carbonising countries located in the region (Steckel et al., Reference Steckel, Hilaire, Jakob and Edenhofer2020). Some SSA countries, including South Africa, Senegal, and Côte d'Ivoire, have already implemented or are currently considering carbon prices (World Bank Group, 2023).
Higher prices for fossil fuels resulting from a carbon price, however, impose greater costs on households. Usually, those impacts are found to be progressive in low- and middle-income countries (LMICs), mainly due to the relatively low energy expenditure shares of poorer households in LMICs (Dorband et al., Reference Dorband, Jakob, Kalkuhl and Steckel2019; Ohlendorf et al., Reference Ohlendorf, Jakob, Minx, Schroeder and Stecker2021). Yet, in SSA, they could lead to unintended welfare outcomes, such as promoting a shift toward traditional biomass like firewood and charcoal (Jewell et al., Reference Jewell, McCollum, Emmerling, Bertram, Gernaat, Krey, Paroussos, Berger, Fragkiadakis, Keppo, Saadi, Tavoni, van Vuuren, Vinichenko and Riahi2018; Greve and Lay, Reference Greve and Lay2023). Biomass use could be problematic for the climate, e.g., because of increased deforestation resulting from the unsustainable use of forests (Masera et al., Reference Masera, Bailis, Drigo, Ghilardi and Ruiz-Mercado2015). Increasing the use of biomass could also affect socioeconomic development, such as health (through indoor air pollution) (Pratiti et al., Reference Pratiti, Vadala, Kalynych and Sud2020), food consumption (due to commodity price hikes) (Fuje, Reference Fuje2019), and female labour force participation (due to time spent gathering firewood) (Köhlin et al., Reference Köhlin, Sills, Pattanayak and Wilfong2011).
In this study, we investigate the potential impacts of a carbon price on household welfare in the context of a low-income country, Uganda. We examine the link between energy use and food consumption, and account for substitution within households’ consumption baskets, to comment on the distributive impacts of a carbon price and potential revenue rebate policies. Understanding the impacts of carbon pricing in Uganda presents a unique and significant case study for several reasons. Despite having low per-capita emissions, Uganda experienced robust economic growth, which was marked by a significant rise in aggregate emissions, with annual emissions growth recorded at 10 per cent over the preceding decade (World Bank Group, 2022). This combination of rapid economic development and escalating emissions underscores the urgency of exploring sustainable and low-carbon growth strategies, making Uganda an important case to examine the implications of carbon pricing.
The Government of Uganda's commitment to reducing its greenhouse gas emissions by 22 per cent by 2030, as outlined in its Intended Nationally Determined Contribution to the 2015 Paris Agreement, highlights the country's proactive stance on climate change mitigation (Ministry of Water and Environment, 2022). This commitment, particularly focusing on decarbonizing key sectors such as energy, infrastructure, and transport, offers a practical context for assessing the effectiveness of carbon pricing as a policy tool.
Moreover, the prevailing socioeconomic conditions in Uganda amplify the relevance of this study. With a significant portion of the population living in poverty with deficits in access to electricity and clean cooking technologiesFootnote 1 and facing food insecurity, alongside a heavy reliance on biomass fuels like charcoal and firewood,Footnote 2 there is a critical need to understand how carbon pricing could impact household welfare, particularly in terms of energy affordability and food security. Our study contributes to a better understanding of these relationships between climate change mitigation and socio-economic development.
Carbon dioxide emissions in Uganda largely arise from fossil-based energy production, oil consumption and industrial production of building materials such as cement. In 2022, 90 per cent of CO2 emissions were accounted for by the oil industry (see the Global Carbon Budget 2023 (Friedlingstein et al., Reference Friedlingstein, O'Sullivan, Jones, Andrew, Bakker, Hauck, Landschützer and Le Quéré2023)). Emissions from the petroleum sector have been rising since the late 1990s (Ritchie et al., Reference Ritchie, Rosado and Roser2020). Domestic use of kerosene lamps for lighting needs and transport further contribute to aggregate emissions in Uganda. In addition, the agriculture, land use change and forestry (AFOLU) sectors are key drivers of greenhouse gas (GHG) emissions and deforestation in Uganda. Emissions from the AFOLU sector, in CO2-equivalents, stood at 43 million tonnes in 2020 (Climate Watch, 2023).
GHG emissions in terms of CO2-equivalents from the AFOLU sector significantly exceeded emissions from energy use and industrial production (Climate Watch, 2023). Deforestation from domestic fuelwood consumption is a key source of land use change and emissions from forestry in Uganda and the broader East African region. Therefore, examining the impacts of a carbon price on the biomass sector is crucial to understanding the wider impacts on mitigation efforts in East Africa. Previous studies of energy demand in SSA find mixed patterns of substitution among fuels in response to fossil fuel price increases. For Tanzania, Olabisi et al. (Reference Olabisi, Tschirley, Nyange and Awokuse2019)) find charcoal price increases to raise kerosene demand, with heterogeneous effects across rural and urban areas. On the contrary, fossil fuel price increases induce substitution toward traditional biomass in Ghana (Greve and Lay, Reference Greve and Lay2023). Similar analyses for South Africa and Ethiopia highlight the role of energy access, availability of cook-stoves, and connections to the electric grid, in determining energy demand (Guta, Reference Guta2012; Franks et al., Reference Franks, Lessmann, Jakob, Steckel and Edenhofer2018).
The distributional welfare impacts of carbon pricing in advanced countries are typically regressive (Sterner, Reference Sterner2012). Cross-country analyses in LMICs, however, suggest a high likelihood of progressive welfare outcomes, due to the relatively low energy expenditure shares of poorer households in LMICs (Dorband et al., Reference Dorband, Jakob, Kalkuhl and Steckel2019; Ohlendorf et al., Reference Ohlendorf, Jakob, Minx, Schroeder and Stecker2021). Country-specific evidence for Asian and Latin American economies further confirms progressive distributional effects of energy taxes, but also reveals large indirect welfare consequences of food price increases (Irfan et al., Reference Irfan, Cameron and Hassan2018; Renner, Reference Renner2018; Bhuvandas and Gundimeda, Reference Bhuvandas and Gundimeda2020).
The Almost Ideal Demand System (AIDS) of Deaton and Muellbauer (Reference Deaton and Muellbauer1980), its quadratic version, i.e., QUAIDS (Banks et al., Reference Banks, Blundell and Lewbel1997), and the more recently developed Exact Affine Stone Index (EASI) demand system (Lewbel and Pendakur, Reference Lewbel and Pendakur2009), have been extensively applied to models of food and energy demand in advanced countries (Reaños and Wölfing, Reference Reaños and Wölfing2018; Eisner et al., Reference Eisner, Kulmer and Kortschak2021). From estimated demand responses, Douenne (Reference Douenne2020) and Reaños and Wölfing (Reference Reaños and Wölfing2018) conclude that energy and carbon taxes would have regressive impacts on household welfare in the contexts of France and Germany, respectively.
In LMICs, the QUAIDS demand system has similarly been estimated for patterns of food consumption, inter alia in Mexico (Attanasio et al., Reference Attanasio, Di Maro, Lechene and Phillips2013), Uganda (Boysen, Reference Boysen2016) and Malawi (Ecker and Qaim, Reference Ecker and Qaim2011). Further, variations of the linear AIDS model have been estimated to understand energy demand responses to energy price increases, in the contexts of India (Bhuvandas and Gundimeda, Reference Bhuvandas and Gundimeda2020), Ethiopia (Guta, Reference Guta2012), Tanzania (Olabisi et al., Reference Olabisi, Tschirley, Nyange and Awokuse2019) and South Africa (Okonkwo, Reference Okonkwo2021), while there is limited evidence on the potential impacts of carbon pricing on household welfare.
Our study's contributions to the existing literature are fourfold: first, we conduct comprehensive analysis of the potential distributional impacts of introducing a carbon price in the context of a low-income country, Uganda. This research presents results which may be applied in other low-income countries which confront similar developmental challenges while transitioning to a low-carbon economy. Second, our study offers new insights into how households in Uganda adjust their fuel consumption and reshape the consumption composition in response to carbon pricing, enhancing the understanding of energy use behaviours in low-income countries. Third, our research explores the broader socioeconomic effects of carbon pricing, especially regarding changes in dietary habits and nutrient intake. This aspect of our research connects energy policy directly with public health concerns. Finally, in terms of methodology, we mark an advancement by applying the EASI demand system in the Ugandan context. The EASI demand system has the advantage of explicitly accounting for individual unobserved preference heterogeneity within the modelling equations, through the error terms. Hence, our estimated elasticities incorporate differences in consumer preferences across diverse regions. Our approach also addresses the large mass of zero expenditures observed in household surveys – a well-known problem in consumer demand estimation of data from LMICs (Shonkwiler and Yen, Reference Shonkwiler and Yen1999).
To analyse welfare impacts of carbon pricing, we utilize household-level expenditure data from the Uganda National Household Survey, 2016–17, conducted by the Uganda Bureau of Statistics, and commodity price data from the World Bank Group's Living Standards Measurement Study for 2015–16. We estimate the uncompensated and compensated price elasticities of demand for 12 commodities, including electricity, kerosene, traditional biomass (charcoal and firewood), and several food groups. We then combine the estimated elasticities with product-level data on CO2 emissions from the Global Trade Analysis Project, to examine the welfare impacts of a carbon pricing policy in Uganda. We investigate the consequent shifts in the quantity demanded for energy and food items, and nutrient intake (calories, protein and micronutrients), across the income distribution. Lastly, we analyse potential increases in biomass consumption due to carbon pricing and evaluate revenue redistribution schemes needed to mitigate trade-offs between climate policy and economic development.
The results show clear patterns of substitution among fuels, with a 1 per cent increase in electricity and kerosene prices raising firewood demand by 0.3–0.5 per cent. A carbon price of USD40/tCO2 generates welfare losses in the range of 0.2–12 per cent of expenditure across the population. Related energy and food price increases significantly lower nutrient intake, with average declines in protein and micronutrient intake of 20 and 27 per cent respectively. Carbon pricing induces a shift towards cereal consumption, supplanting consumption of nutrient-rich foods such as vegetables and meat & fish. Given the prevalence of cooking in household patterns of energy use, we identify cooking fuels as additional channels of policy impact. In conjunction with carbon pricing policies, social welfare programmes such as lump-sum transfers, could therefore create important pathways for long-term sustainable development in Uganda and the broader SSA region.
This remainer of this paper is structured as follows. Section 2 outlines the methodology and econometric method, while section 3 discusses the data and presents descriptive statistics. Section 4 presents the results, with a discussion in section 5. Section 6 concludes.
2. The demand system
This section describes the EASI demand system, the econometric method and how these can be used to evaluate welfare impacts and changes in consumption patterns as a response to price changes.
2.1 Exact Affine Stone Index demand system
We estimate the approximate EASI implicit Marshallian demand system developed by Lewbel and Pendakur (Reference Lewbel and Pendakur2009), which is derived from consumer theory and expresses budget shares in linear forms. The EASI log of cost function $C(.)$ for the exact model for $J$
 goods, is expressed in terms of utility $u$
 , a $J$
 - vector of log prices $p$
 , a $J$
 - vector of utility coefficients $b_1$
 and a $J$
 - vector of errors $\epsilon$
 , as

where $A$ is a $J \times J$
 matrix of parameters with elements $[A]_{jk} = a_{jk}$
 , and $z$
 is an $r \times J$
 matrix of control variables including household demographics and geographical identifiers. Applying Shephard's Lemma to the cost function, we obtain Hicksian demands, and via duality, the vector of Marshallian budget shares in implicit form:

where $y$ is interpreted as a measure of implicit utility and the log of real household expenditure. Engel curves are modelled as approximately linear, while the $\epsilon$
 terms are random utility parameters reflecting individual unobserved preference heterogeneity. Solving for $y$
 by equating the cost function $C(p,u,\epsilon )$
 to the log of nominal household expenditure $x$
 and substituting for $w$
 yields the following expression, with $p^\prime w$
 equal to the exact log of the Stone price index (Stone, Reference Stone1954):

This expression, however, relies on the matrix of estimable parameters $A$ , and is endogenous due to its dependence on the budget shares $w$
 . We therefore estimate the approximate model (Lewbel and Pendakur, Reference Lewbel and Pendakur2009), with $\tilde {y} = x - p^\prime \bar {w}$
 , and deflate the household's nominal expenditure on food and fuelFootnote 3 $x$
 by the consumer price index, whose commodity weights are derived from national household expenditure surveys (UBOS, 2018).
The compensated price elasticity of the budget share for good $j$ in response to an increase in the price of good $k$
 , is obtained from equation (2) as follows (Lewbel and Pendakur, Reference Lewbel and Pendakur2009):

where $w_j$ is the observed budget share of good $j$
 . In the empirical estimation, we use the average observed budget share only of individuals that consume good $j$
 to compute the elasticity. To obtain price elasticities of demand, we note that the cross-price budget share elasticities equal the corresponding price elasticities of demand. The own-price elasticities are related to the budget share elasticities as follows:Footnote 4

where $e_{j,k}^c$ is the compensated price elasticity of demand for good $j$
 with respect to the price of good $k$
 .
The expenditure elasticities of demand are derived as follows:

We then derive the uncompensated (Marshallian) price elasticities of budget shares from the Slutsky equation in budget share form, as follows:

2.2 Econometric method
We estimate the EASI demand system via the Tobit Type I model for each budget share equation, with a lower limit of zero and an upper limit of one. A significant proportion of households in our sample report zero consumption expenditure for individual items (see table 1), which motivates the use of a corner solution response model (Wooldridge, Reference Wooldridge2010). The latent budget share equation for good $j$ and household $i$
 , based on equation (2), is

where $\tilde {\epsilon }_{ij} \sim N(0,\sigma _\epsilon ^2)$ , with the corresponding Tobit Type I model

where $w_{ij}$ is the observed budget share, $\tilde {y}_i$
 is the natural logarithm of household real expenditure (nominal expenditure on food and fuel $x$
 , deflated by the consumer price index), $p_{kd}$
 are log prices for commodity $k$
 and district $d$
 , $z_l$
 is an $L$
 -vector of controls (these include the region of residence, rural/urban area and household size to capture economies of scale within the household), and $\tilde {\epsilon }_{ij}$
 is a normally distributed error term. We subsequently estimate average marginal effects to derive the elasticities. In online appendix D, we discuss an alternative method to estimate the demand system, and perform robustness checks.
Expenditure shares for the full sample (% of expenditure on food & fuel)

Note: The sample sizes for items with positive reported expenditures in column 3 are distinct for each item and hence not reported.
2.3 Welfare impacts
The first-order (FO) welfare effect of a price change is the additional expenditure incurred by households for the original consumption bundle to be affordable. In budget share form, the FO effect is expressed as

where $w_j^0$ and $p_j^0$
 are the initial budget share and price for good $j$
 , respectively, with expenditures aggregated across the $K$
 goods that exhibit price increases. For goods unaffected by carbon pricing (in this study, charcoal and firewood), the welfare effect is zero.
To account for household demand changes in response to relative price hikes and shifts within the consumption basket, we analyse the second-order (SO) welfare effects. Because SO calculations account for substitution effects, they are typically smaller than FO calculations, which overestimate welfare losses. Banks et al. (Reference Banks, Blundell and Lewbel1996) derive SO approximations to the welfare loss of an indirect tax on a single item in the consumption basket. Renner et al. (Reference Renner, Lay and Greve2018) extend this framework to multiple simultaneous price changes through a SO Taylor series expansion of the expenditure function. We follow their approach to compute SO welfare effects, or the compensating variation, which measures the amount of compensation households require to achieve their initial utility levels at the new set of prices. As a proportion of household expenditure, the approximate SO welfare effect is

The first term represents the FO effect, while the second term measures changes in consumption due to multiple price changes, captured by the compensated price elasticities of demand ($e_{i,j}^c$ ) and initial expenditure shares ($w_i^0$
 ). As the carbon pricing policy leaves the prices of biomass (charcoal and firewood) unaffected, any cross-price effects involving solid fuels will result in no additional welfare losses, despite non-zero demand changes.
2.4 Changes in final consumption
We compute the total change in quantity demanded for each item, in response to a carbon price, based on the estimated uncompensated price elasticities of demand. Consider a Marshallian demand function $f_i$ for commodity $i$
 , as a function of the $J$
 -vector of prices $q$
 ,Footnote 5 and total household expenditure $x$
 ,

The proportionate change in quantity demanded is then approximately equal toFootnote 6

Estimates of the change in quantity demanded for each group $i$ are thus linear approximations, particularly in the event of significant price increases, resulting in large values for $\frac {\Delta q_j}{q_j}$
 . Rather than modelling nonlinear price changes, we adopt a parsimonious approach to obtain precise estimates of the price elasticities of demand.
We additionally compute the change in nutrient intake due to carbon pricing, across the population. We first recalculate budget shares with respect to households’ total food expenditure, and use these modified budget shares as weights for the demand changes derived in equation (11) for the $k$ food groups.Footnote 7 We then calculate the percentage change in the consumption of calories, protein and micronutrients due to carbon pricing. We follow Ecker and Qaim (Reference Ecker and Qaim2011) and analyse changes in the demand for five micronutrients: iron, vitamin C, riboflavin, folate and vitamin B12, which we subsequently aggregate, for tractability in presenting results. Using a food composition table for Uganda from HarvestPlus (Hotz et al., Reference Hotz, Abdelrahman, Sison, Moursi and Loechl2012), we first individually calculate the average level of nutrients $n_i$
 for calories (kcal), protein (grams) and micronutrients (grams) in each food category $i$
 per kilogram, using food item-specific consumption shares as weights for the broad food category. We then obtain the percentage change in total nutrient intake $\frac {\Delta N}{N}$
 due to the carbon price as follows:

where $w_{f_i}$ is the modified expenditure share for food group $i$
 , for a total of $k$
 food groups.
3. Data and descriptive statistics
This section describes the expenditure, price and emission data used and presents descriptive statistics.
3.1 Expenditure and price data
Household expenditure data are drawn from the Uganda National Household Survey (UNHS), conducted by the Uganda Bureau of Statistics (UBOS), for the latest year available, 2016–17. The UNHS is nationally representative, with a sample size of 15,912 households for an estimated population of 43 million (UBOS, 2018). We exclude 2 per cent of observations with missing data on total household expenditure (on food and energy), resulting in a sample of 15,682 observations. The survey comprises detailed consumption modules on expenditures incurred for food items and energy sources, with respective weekly and monthly recall periods. Following Deaton and Zaidi (Reference Deaton and Zaidi2002), we scale expenditures to annual levels. For each item, we aggregate the expenditures incurred on market purchases and the self-reported expenditure values of goods produced at home, collected from villages/forests or items received in-kind. This also applies to charcoal and firewood. Households report the monetary value of the self-collected biomass, and we utilise this information while evaluating the non-purchased charcoal and biomass. Self-consumption is substantial in Ugandan households, with 35 per cent of food consumption from seasonal harvests by farmers, particularly for cereals and pulses (UBOS, 2018). Similarly, over 90 per cent of firewood consumed as fuel within homes is collected by household members from nearby forests and village plots (UBOS, 2018). While over 60 per cent of households report using firewood for cooking, nearly 30 per cent also use charcoal for cooking (UBOS, 2018), highlighting the strong dependence on solid fuel use.
Individual food items are categorised into commodity groups based on likely complementarities between items (for example cereals may complement vegetables, fruits, or meat), in order to satisfy the assumption of weak separability between different commodity groups. We thus model demand for 12 consumption groups including four energy sources – electricity, kerosene, charcoal, and firewood, and eight food categories – cereals; fruits; vegetables; meat & fish; milk & eggs; cheese, oils & fats; alcohol & tobacco; and other food & drink. These food categories thus reflect the different broad food groups of a standard diet as well as potential complementarities between food groups. They further reflect broad consumption patterns in Uganda, where cereals and vegetables comprise a significant proportion of the food basket (see table 1).
The demand system excludes other non-durable and durable goods due to lack of commodity-level price data. However, the non-durable items considered in the present analysis account for 65 per cent of households’ mean total spending. We further exclude transportation from the demand system estimation due to inadequate expenditure and price data,Footnote 8 as well as potential simultaneity of transport prices and other commodity prices. However, the microsimulation of a carbon pricing policy also includes an implicit tax on emissions generated from the transportation of fossil-based energy souces (electricity and kerosene) and all food items in the country.Footnote 9
To curtail the influence of outliers on the price elasticities of demand, we trim the top and bottom 1 per cent of observations of the real expenditure distribution for estimating elasticities, resulting in a final sample of 15,324 households, covering 96 per cent of the Ugandan population. Nevertheless, we utilise the full sample of households across the expenditure distribution to compute changes in welfare, commodity demand and nutrient intake.
Data on commodity prices are drawn from two sources. First, energy prices for kerosene, biomass and food items are obtained from the Uganda National Panel Survey (UNPS), conducted by the World Bank's LSMS for the closest year available, 2015–16. We rely on the World Bank Group's UNPS survey for data on energy prices as the UNHS, 2016–17, does not contain price data for biomass (charcoal and firewood) and contains sparse price data for kerosene, whereas the UNPS survey contains substantial data on energy prices at the household level. Data on energy prices are essential to estimate elasticities in our analysis.
We construct average annual prices for each of the 12 commodities in the demand system, by taking simple averages of the item-specific market prices reported by households, at the district – rural/urban level. This ensures significant spatial heterogeneity in prices, while annual averages help mitigate seasonal influences on biomass prices. Aggregating prices at the district level further helps control for potential endogeneity of prices due to household production, and mitigates concerns of quality differentiation in unit prices (Capéau and Dercon, Reference Capéau and Dercon2006). For districts with missing price data in the UNPS, we apply the corresponding national, annual average price for each commodity, to complete the sample. We then inflate all commodity prices to 2016–17 levels using the consumer price index for Uganda, to match prices to household expenditures.Footnote 10
Second, we obtain national electricity tariffs for Uganda from the Electricity Regulatory Authority (ERA).Footnote 11 These are available at a quarterly frequency, and the price structure involves a two-block tariff, at a threshold consumption level of 15 kWh units per month. While the UNHS 2016–17 does not contain data on the quantity of electricity consumed, corresponding data from the UNPS, 2015–16, suggest that around 90 per cent of households with reported expenditures for electricity consumed more than 15 units per month. Since we cannot assign the tariff based on the household's electricity consumption, we only apply the higher block tariff as a uniform price for electricity for all households in Uganda.
3.2 CO2 emissions data
To analyse the distributional welfare impacts of a national carbon price, we combine the household-level expenditure survey with the Global Trade Analysis Project (GTAP 10) database for 2014, which provides carbon dioxide emissions levels for 65 sectors, based on an environmentally-extended multiregional input-output table (Aguiar et al., Reference Aguiar, Chepeliev, Corong, McDougall and van der Mensbrugghe2019). We map the 140 consumption items of the UNHS to 16 corresponding sectors in GTAP 10 (documented in the online appendix, table A8).
We rely on the GTAP database for information on indirect CO2 emissions entailed in cultivation and transport of commodities, since alternative databases such as Exiobase and World Input-Output Database (WIOD) do not provide sector-level data on CO2 emission intensities for Uganda. To the best of our knowledge, the GTAP is the only database with country- and sector-specific data on emission intensities for a number of low-income countries, including Uganda. The GTAP database covers emissions from key polluting sectors such as the oil, cement, agriculture and forestry sectors, for Uganda. The Government of Uganda specifically targets reducing emissions from the petroleum, energy and forestry sectors, in its updated Nationally Determined Contribution (NDC), submitted to the UNFCCC in 2022 (Ministry of Water and Environment, 2022).
For our welfare analysis, we draw on sector-level emission intensity data for broad food groups and energy sources such as kerosene and electricity. Data on CO2 emission intensities for solid fuels (charcoal and firewood) are drawn from the forestry sector of GTAP. GTAP 10 improves upon previous versions by specifically incorporating the electricity mix in Uganda and other countries, which leads to more accurate emission intensity data. The GTAP database has been applied to the Ugandan context (Ismail et al., Reference Ismail, Lubwama, Kirabira and Sebbit2023), and to cross-country studies on carbon pricing (Steckel et al., Reference Steckel, Dorband, Montrone, Ward, Missbach, Hafner, Jakob and Renner2021) and poverty alleviation in LMICs (Bruckner et al., Reference Bruckner, Hubacek, Shan, Zhong and Feng2022).
The carbon intensity for a specific item can either be attributed to direct emissions due to energy consumption (electricity and kerosene), or indirect emissions from the transportation of commodities (Renner et al., Reference Renner, Lay and Greve2018). We analyse both direct and indirect emissions for all commodity groups modelled in the demand system. We first compute the weighted carbon intensities for the 12 categories of the demand system based on the mean consumption shares of individual items within each of the 12 categories from the UNHS. This yields a household-level dataset with expenditures and budget shares for various commodity groups, and corresponding weighted carbon intensities for each category. Subsequently, we calculate percentage price changes for all commodities owing to a carbon price of USD40/tCO2.
3.3 Descriptive statistics
Summary statistics for expenditure shares, annual household expenditure on food and energy, and prices used in estimation of the EASI demand system are presented in table 1. The mean budget shares (column 1) suggest that households’ consumption baskets for food and fuel are largely composed of vegetable consumption, followed by cereals, meat & fish, and other foods, while energy comprises less than 5 per cent of expenditure. A substantial proportion of households further report zero expenditures for various items. For instance, only around 16 per cent of households report positive expenditures on electricity (column 4), with 84 per cent of the sample reporting zero spending on electricity, which is largely due to lack of widespread access to the electric grid (IEA, 2020).Footnote 12 For the sub-sample of electricity users (column 3), the average budget share is 5.7 per cent, compared to mean budget shares of 0.6 per cent for kerosene, 2.6 per cent for charcoal and 3.6 per cent for firewood, for the respective users.
Mean expenditure shares and standard deviations for all items by expenditure tercile – rural/urban groups, are presented in the online appendix, table A1. Households’ budget shares for different energy items by terciles based on the household's total expenditure, and rural/urban areas, are displayed in online appendix figure A1. The share of biomass in households’ total energy expenditure declines with income, from 84 per cent for the average rural household in the bottom tercile to 55 per cent for the average urban household in the top third of the total expenditure distribution. Similarly, the average budget share for kerosene declines from 15 to 3 per cent across expenditure terciles and rural/urban areas. The share of electricity in households’ energy mix, however, rises sharply from 1 per cent on average among rural households in the bottom tercile to 42 per cent on average among urban households in the top expenditure tercile.
Summary statistics for commodity prices are presented in table 2. We observe significant price variation for most items, in particular kerosene, charcoal, meat & fish, and cheese, oils & fats, which ensures reliable econometric identification.
Summary statistics for item-specific prices

Note: Prices are in Ugandan shillings (UgX) per unit.
4. Results
This section presents the estimated price elasticities of demand, the welfare impacts of carbon pricing and demand shifts in households’ consumption baskets due to energy and food price increases. We assess all effects for a simulated carbon price of USD40/tCO2. This price is the lower bound of the range of carbon prices recommended by the High-Level Commission on Carbon Prices until 2030 (Carbon Pricing Leadership Coalition, 2017).
4.1 Price elasticities of demand
The uncompensated price elasticities of demand for the full sample are presented in table 2, while table 4 displays compensated elasticities for energy items for the rural and urban sub-samples.Footnote 13 Each cell (row $i$ , column $j$
 ) represents the percentage change in demand for good $i$
 due to a 1 per cent increase in the price of good $j$
 . The expenditure elasticities and compensated price elasticities of demand are presented in online appendix tables A2 and A4, while the Tobit regression estimates are displayed in table A5.Footnote 14 Additional robustness checks for the demand system are presented in online appendix D.
4.1.1 Energy items
The results show negative own-price compensated elasticities of demand for all items across the sample, with several items like kerosene, charcoal and firewood being highly price elastic in both rural and urban areas. The uncompensated own-price elasticities of demand (table 3) are also negative for almost all items and smaller in absolute value than the corresponding compensated elasticities for most items. A 1 per cent increase in the price of kerosene lowers its demand by 1.2 per cent in rural areas (table 4), while a 1 per cent increase in the price of charcoal reduces its demand by 1.2 per cent in rural areas and by 1.7 per cent in urban areas.
Uncompensated price elasticities of demand (full sample)

Note: The items are: Electricity (E), Kerosene (K), Charcoal (C), Firewood (Fw), Cereals (Ce), Fruits (Fr), Vegetables (V), Meat & Fish (Me), Milk & eggs (Mi), Cheese, oils & fats (Ch), Alcohol & tobacco (Al) and Other food and drink (O). Robust standard errors in parentheses. The source Tobit regressions include dummy variables for region, rural-urban area and household size. $N$ = 15,324.
Compensated price elasticities of demand for energy sources (rural vs. urban)

Note: Robust standard errors in parentheses. Rural sample: $N = 10,353$ .
Urban sample: $N =$ 4,979.
The cross-price elasticities of demand reveal important substitution effects between energy sources. Accounting for income effects, we find electricity use to be complementary to kerosene and charcoal consumption, while increases in electricity prices increase the demand for firewood (table 3). Similarly, increases in kerosene prices raise firewood demand, primarily in rural areas. Charcoal and firewood are net substitutes, with percentage increases in charcoal prices increasing firewood demand by 0.2–0.3 per cent across rural-urban regions. Uncompensated elasticities largely mirror the observed patterns of substitution among fuels. The results broadly corroborate the energy ladder hypothesis, wherein households sequentially “step down the ladder” from modern energy sources such as electricity and kerosene, to traditional biomass in the event of fuel price hikes.
Our results corroborate those in the existing literature which finds that higher energy prices raise biomass use in Sub-Saharan Africa (Olabisi et al., Reference Olabisi, Tschirley, Nyange and Awokuse2019; Greve and Lay, Reference Greve and Lay2023). Fuel stacking, whereby households combine use of fossil-based and solid fuels for cooking, remains highly prevalent in East Africa (Choumert-Nkolo et al., Reference Choumert-Nkolo, Motel and Le Roux2019).
4.1.2 Food items
Energy price hikes have implications for food demand due to complementary patterns of cooking fuel use, and budgetary reallocations within consumption baskets.
A 1 per cent increase in kerosene prices simultaneously raises the demand for firewood by 0.5 per cent, cereals by 4.5 per cent and cheese, oils & fats by 0.3 per cent (table 3). However, the demand for fruits, vegetables, and meat & fish declines by 0.7–.5 per cent.
Food price increases similarly have consequences for energy use and create additional shifts in food baskets. Increases in vegetable prices reduce energy consumption on the whole, while simultaneously reducing overall food intake (table 3), which suggests strong and negative income effects of food price hikes.
The observed patterns of food and energy use in response to price increases suggest dependencies of food items on specific cooking fuels (Treiber et al., Reference Treiber, Grimsby and Aune2015). Increases in cereal consumption coupled with declines in consumption of nutrient-rich foods such as vegetables or meat & fish reveal important trade-offs between food security and clean fuel use for households in Uganda.
4.2 Welfare effects of carbon pricing
The percentage price increases in energy and food items resulting from a carbon price of USD40/tCO2 are presented in table 5. Kerosene and electricity exhibit the largest price hikes (16 and 10 per cent, respectively), while prices for food items rise by less than 1 per cent (table 5).
Price and demand changes due to carbon pricing (USD40/tCO2)
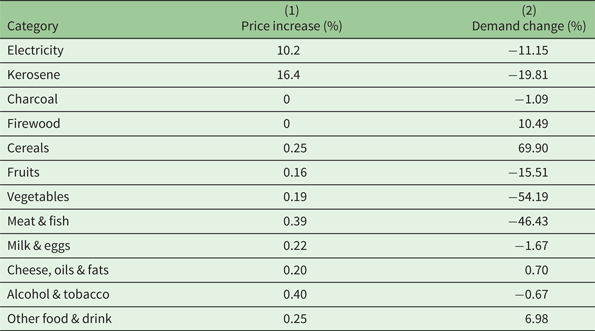
Note: Demand changes (%) are based on the uncompensated price elasticities of demand estimated for the full sample (table 3).
The first- and second-order welfare losses due to a carbon price of USD40/tCO2 are highlighted in figure 1. The average FO welfare loss is estimated at 0.36 per cent of households’ total expenditure on food and fuel, with progressive distributional effects in the range of 0.2 to 1.5 per cent, for the majority of the population. However, 1 per cent of households in the sample exhibit large welfare losses of up to 16 per cent of household expenditure on food and fuel. For most of the population, the relatively low budget shares for electricity and kerosene generate modest welfare effects, despite significant price increases for these fuels.Footnote 15 The average SO welfare loss is estimated at 0.34 per cent of households’ expenditure on food and fuel, rising steadily from 0.2 to 1.3 per cent across the distribution for 99 per cent of households in the sample. However, 1 per cent of households exhibit large welfare losses of up to 12 per cent of expenditure on food and fuel.
First- and second-order welfare losses of a USD40/ton carbon price.

The SO effects are thus smaller than the FO effects at each percentile of the total expenditure distribution, with a sizeable drop at the upper tails, reflecting larger substitution possibilities in richer households’ consumption baskets.Footnote 16 Decomposing the welfare losses by consumption categories, shown in online appendix figure A4, highlights significant heterogeneity across and within expenditure quintiles for energy and select food items.
4.3 Shifts in the consumption basket
Carbon pricing further creates shifts in the consumption basket, with average reductions in electricity and kerosene consumption of 11 and 20 per cent respectively (table 5).
On the other hand, firewood demand exhibits a significant 10 per cent increase due to a carbon price of USD40/tCO2, and underscores the substitution pattern from fossil-based energy sources toward readily available and potentially low-grade biomass (Jagger and Shively, 2014). The demand for several food items declines on average, including vegetables (by 54 per cent), meat & fish (by 46 per cent), and fruits (by 15 per cent). On the other hand, cereal consumption rises by 70 per cent due to the carbon price, and consumption of cheese, oils & fats, and other food and drink similarly rises.
We next analyse the change in average calorie and nutrient intake (protein and micronutrients) due to carbon pricing, by expenditure tercile and rural/urban groups (figure 2).
Change (%) in calorie consumption and nutrient intake (protein and micronutrients) due to carbon pricing (USD40/ton) across the distribution. Note: The Y-axis measures the percentage change in household nutritional intake due to carbon pricing, relative to the household's baseline nutrient intake. The category “Alcohol & Tobacco” is, however, excluded from this calculation as it remains unclear whether alcohol is consumed or used as a substitute fuel for transportation.

Calorie consumption declines on average by 2.5 per cent across the population, while households in the bottom third of the distribution in urban areas exhibit a small increase in calorie intake of 1 per cent. Similarly, protein and micronutrient intake decline on average by 20 and 27 per cent respectively. Although cereal consumption rises considerably in response to a carbon price, it largely compensates for the decline in consumption of other food groups, in order to maintain calorie intake in most households.
These results may be considered in a global context of rising food and energy prices due to supply shortages, which are known to reduce nutritional intake and render healthy diets unaffordable around the globe (Food and Agriculture Organization, 2023).
5. Discussion
Carbon pricing is considered an effective instrument for climate change mitigation and long-term sustainable development. In the SSA context, it could stimulate investments in renewable energy and reduce dependence on carbon-intensive energy infrastructure in the long run. In Uganda alone, carbon pricing could provide revenues to cover one-fifth of the financing requirement until 2030 for the UN's Susutainable Development Goals Agenda (Franks et al., Reference Franks, Lessmann, Jakob, Steckel and Edenhofer2018). However, when designing carbon pricing schemes, potential trade-offs with economic development objectives – particularly in low-income countries – need to be considered.
5.1 Welfare impacts
Our results show progressive yet significant welfare losses across the Ugandan distribution, reinforcing the conclusions of the existing literature (see, e.g., Ohlendorf et al., Reference Ohlendorf, Jakob, Minx, Schroeder and Stecker2021). Applying a carbon price of USD40/ton CO2, which corresponds to our household survey year, 2016–17, our analysis suggests SO welfare losses are up to 12 per cent of household expenditure on food and fuel. The High Commission on Carbon Prices further recommends a range of prices between USD40–80/ton to be implemented until 2030 (Carbon Pricing Leadership Coalition, 2017).
We simulate the potential SO welfare impacts for the upper bound carbon price of USD80/ton and an intermediate price (USD60/ton). At an intermediate price of USD60/ton, SO welfare losses would reach a maximum of 16 per cent of household expenditure. At the upper bound carbon price of USD80/ton, SO welfare losses would reach a maximum of 17 per cent of household expenditure (on food and fuel). We find that SO welfare effects increase less than proportionately with the carbon price. Households thus respond to multiple price increases by simultaneously adjusting their consumption baskets and reducing the additional expenditure needed to maintain their utility levels. This arises from the property that the expenditure function is concave in prices.
Our results underscore the impacts of carbon pricing on multidimensional measures of household welfare, including energy demand, biomass consumption, and consequences for food and nutrient intake, revealing important interactions between climate policies and economic development. These important considerations in the design of socially just and efficient sustainable development have hitherto been neglected in the literature.
Average welfare impacts across the distribution mask substantial heterogeneity of effects within income groups, often referred to as horizontal effects (Cronin et al., Reference Cronin, Fullerton and Sexton2019). In Uganda, accounting for the direct and indirect effects of carbon pricing points to some households being particularly affected by carbon pricing in all expenditure groups, despite progressive results. Further research is necessary to investigate the factors that determine specific patterns of energy use, consumption expenditures and demand shifts along the distribution. Disaggregating demand responses to price changes by income groups is further important to understand substitution behaviour across households within specified income groups.
5.2 Revenue recycling
Potential adverse welfare effects can typically be ameliorated through compensation payments and revenue recycling schemes (Klenert et al., Reference Klenert, Mattauch, Combet, Edenhofer, Hepburn, Rafaty and Stern2018). The existing literature finds that the implementation of cash transfer programmes in combination with carbon pricing enhances the progressivity of welfare outcomes in middle-income countries like Mexico and Ecuador (Greve and Lay, Reference Greve and Lay2023; Schaffitzel et al., Reference Schaffitzel, Jakob, Soria, Vogt-Schilb and Ward2019).
We investigate a basic revenue recycling model for Uganda, assuming the total revenue generated from a carbon price of USD40/ton is redistributed equally to all households as a lump sum transfer. The total revenue generated amounts to around UgX100 billion (USD26 million), taking into account reductions in consumer demand due to higher energy and food prices. The annual lump sum transfer per household is approximately UgX11,638 (USD3). Net welfare effects across the distribution are presented in figure 3.
Mean welfare effects of carbon pricing with lump-sum transfers by expenditure quintile, Note: The graph depicts average welfare effects for households by expenditure quintile, measured as the percentage change in expenditure on food and fuel, due to carbon pricing. This differs from figure 1, which depicted welfare losses on the positive Y-axis. In the second scenario, revenues from carbon pricing are redistributed to households via lump-sum transfers, and the scheme generates net average welfare gains for the bottom 60 per cent of the distribution.

We find an equal per-capita rebate compensates close to three-quarters of the population for welfare losses of carbon pricing, and yields net welfare gains for most households. Households in the bottom expenditure quintile observe net average welfare gains of 0.7 per cent of expenditure on food and fuel, while households in the top quintile experience an average welfare loss of 0.2 per cent of expenditure on food and fuel, following a carbon price and transfers (figure 3).
In addition to alleviating negative welfare effects, cash transfer programmes in SSA countries can further have positive impacts such as stimulating agricultural households to undertake productive activities, fostering arrangements for sharing of food and production inputs within communities, and especially in reducing market failures typically faced by low-income households in SSA (Daidone et al., Reference Daidone, Davis, Handa and Winters2019).
However, targeting cash transfers to the most affected households may be administratively challenging, while providing lump-sum transfers to all households may impose significant fiscal costs. Therefore, cash transfer programmes would need to be designed to alleviate the maximum burden of a carbon price, and may be combined with existing social protection schemes.
Alternatively, providing subsidies for cleaner cooking fuels such as LPG (Irfan et al., Reference Irfan, Cameron and Hassan2018), may prove beneficial in promoting a clean energy transition and reducing indoor air pollution in LMICs, while ameliorating potential adverse effects on food consumption. Evidence from Indonesia finds that LPG subsidies, along with quantity restrictions on kerosene consumption within districts, can effectively stimulate large-scale fuel transitions. The LPG program lowered the demand for kerosene by 80 per cent over the 2007–2012 period and created positive spillovers on maternal and child health (Imelda, 2020). Although LPG use is less prominent in Uganda, expansions in access to fuel efficient cook-stoves, for instance via the World Bank-led clean cooking supply chain expansion project, could alleviate pressures on deforestation. The use of charcoal briquettes for fuel, processed from agricultural residue, can similarly reduce the overall demand for charcoal and promote efficient energy use (World Bank Group, 2021).
5.3 Substitution and complementary effects in energy use
Carbon pricing generates significant shifts in the composition of energy demand in Uganda, with households substituting solid fuels like firewood for electricity. Accounting for aggregate demand changes, we estimate that a carbon price of USD40/tCO2 reduces emissions by 18 per cent. We conduct an additional sensitivity check introducing carbon pricing for the indirect emissions generated by solid fuels (e.g., through transportation), and find similar results along all dimensions, with the findings presented in online appendix D.
Fossil fuel subsidy removal and introduction of a carbon price thus has implications for public health due to increased indoor air pollution from biomass burning,Footnote 17 and severe consequences for the environment through increased deforestation for fuelwood collection and related emissions from land use change. Concerns pertaining to deforestation are especially pertinent given a sharp decline of 63 per cent in Uganda's forest cover between 1990 and 2015, with fuelwood collection and production of charcoal for cooking and revenue generation, being leading causes of deforestation (Ministry of Water and Environment, 2015).
5.4 Heterogeneous effects on food consumption
Energy prices have implications for food consumption and generate shifts in dietary composition, with households substituting consumption from nutrient-rich foods such as vegetables and meat & fish towards cereals, which are a relatively inexpensive source of calories (online appendix table A3 displays the price per calorie for each food group). The increase in cereal consumption helps maintain calorie intake in the event of food price increases. Furthermore, consumption of other food groups such as vegetables or meat & fish declines less than proportionately due to the carbon price, albeit resulting in a significant decline in nutrition. Households in the top expenditure tercile in rural areas exhibit a relatively larger decline in nutrient intake, which is similarly explained by the reduction in demand for meat & fish in response to a carbon price, and the relatively larger budget share for meat & fish in the food budget for these households (online appendix, table A1).
While our analysis applies the price elasticities of demand estimated for the full sample to analyse nutritional differences across expenditure terciles, richer households might react differently than the average Ugandan household and exhibit smaller declines in protein consumption than estimated. Hence, our estimates provide an upper bound on the adverse nutritional consequences of carbon pricing in Uganda. Nevertheless, given the large prevalence of undernutrition and food insecurity in Uganda, with 22 per cent of the population facing severe food insecurity (World Bank Group, 2022), the results underscore the importance of designing revenue recycling and cash transfer programmes that counter the negative impacts of carbon pricing, while enabling cleaner cooking fuel transitions.
5.5 Limitations
Our analysis is, first, limited by price data from the year preceding the household expenditure survey, which could be subject to differential time trends across Ugandan sub-regions. While we inflate energy and food prices by the consumer price index, we do not control for region-specific time trends, which qualifies the results. Second, we do not model the demand for transport, other non-durable and durable goods, which could interact with energy and food demand, in response to carbon pricing. Higher transport prices could significantly affect the use of motorised transport and could affect purchases for vehicles or other types of cook-stoves, depending on cooking fuel prices.
We further do not consider how increases in transport prices could affect other commodity prices, which could result in simultaneity bias. However, we conduct a robustness check using an instrumental variable approach for commodity prices (see online appendix, section D) and find broadly similar results. Lastly, we do not account for use of renewable energy sources such as solar mini-grids or off-grid power generation, due to lack of survey data on expenditures and related investment costs. The inclusion of solar and hydropower in the demand system would likely yield increases in renewable energy use in response to carbon prices imposed on fossil fuels.
6. Conclusion
This paper investigates the welfare effect on Ugandan households imposed by a carbon price of USD40/tCO2. We estimate a consumer demand system to account for substitution effects between traditional biomass and modern energy, and the effects of energy price changes on food consumption. We identify trade-offs between climate change mitigation and economic development. Our results show substantial reductions in the demand for electricity and kerosene by 11 and 20 per cent respectively, and an increase in firewood consumption by 10 per cent for the average household, in response to a carbon price of USD40 per ton. Welfare effects are progressive but rise sharply at the top of the distribution, reaching a maximum of 12 per cent of household expenditure on food and fuel, with heterogeneous impacts within and across expenditure quintiles for individual items. The carbon price reduces annual emissions by 18 per cent in Uganda. However, we do not account for the potential increase in emissions from deforestation and land use change, due to increased biomass consumption from higher energy prices.
Fossil fuel price increases create large shifts in food consumption baskets, with substitution toward cereals, and declines in the consumption of meat & fish, vegetables and other nutrient-rich food groups. Calorie intake declines slightly among most households, while protein and micronutrient intake decline sharply across the population, by 20 and 27 per cent respectively on average. Commodity price increases therefore have a negative impact on the dietary composition and nutritional intake of all Ugandan households, and particularly those on the brink of poverty. Combinations of energy and development policies are thus required to ameliorate these adverse effects, which could result in multiple co-benefits for households.
Supplementary material
The supplementary material for this article can be found at https://doi.org/10.1017/S1355770X24000214
Acknowledgements
We thank the Co-Editor, E. Somanathan, an anonymous Associate Editor and an anonymous referee, for helpful comments. We are grateful to Sebastian Renner, Brian Poi, Chad Meyerhoeffer, Michael Olabisi, Ole Boysen, P.P. Krishnapriya, Nick Kilimani, Hannes Greve, Suzi Kerr, Thomas Sterner, Jann Lay, Carolyn Fischer, Jörg Peters, Gunnar Köhlin, Alexander Rohlf, James Muwonge, Hauke Ward, Leonard Missbach, Şafak Özden, Smt. Monica Aggarwal, Utkarsh Patel, Ira Dorband, Alex Tatwangire and seminar audiences at MCC Berlin, SETI (Duke), IEW, EAERE, VfS, EfD Initiative and University of Gothenburg for insightful comments. We thank the Uganda Bureau of Statistics for sharing household survey data. Funding from the German Federal Ministry of Education and Research (BMBF) (funding code 011A1807A, DECADE), is gratefully acknowledged. All errors remain our own.
Competing interest
The authors declare none.



