I. INTRODUCTION
Cu–Sn alloy (tin bronze) is the oldest metal material in the world and has made a great contribution for human civilization evolvement. During the early stages, the casting bronzes greatly improved the productivity level of the society and brought a boom period for human civilization, the Bronze Age. However, even today, bronzes are still widely used to manufacture various mechanical parts because of their excellent wear resistance, corrosion resistance, and sufficient strength and ductility.
Cu–Sn alloys have been studied for several thousands of years from ancient time to modern manufacturing industry.Reference Gordon and Knopf1, Reference Park, Park and Lee2 In general, Sn content should be less than 30 wt.% in a Cu–Sn alloy for the practical usage. In this case, according to Cu–Sn phase diagram,Reference Joseph3 the metallographic microstructure of a typical casting bronze in room temperature is equivalent to that in the range of 350–520 °C, which consists of the presolidified dendritic α-phase and the Sn-enriched (α+δ) eutectoid essentially. Basically, the mechanical property of Cu–Sn alloys is strongly associated with alloying element Sn content. Therefore, it is crucial to precisely control the Sn concentration for obtaining the desired property of a Cu–Sn alloy.Reference Selver and Varol4, Reference Ünlüa and Atik5
It is well-known that the α-phase is a solid solution of Sn in Cu matrix with a face-centered cubic (FCC) lattice structure and exhibits good ductility and toughness. The limit of the solid solution of Sn in Cu matrix is 15.8 wt.%,Reference Joseph3 and the hardness of the alloy increases as Sn amount increasing.Reference He6 Some different versions of Cu–Sn diagram are included to represent the variable limits of a solid solution in practical terms, such as under normal casting conditions or if well annealed.Reference Scott7
In recent years, some researchers have realized the important influence of the α-phase dendrites on mechanical properties of Cu–Sn alloys. Audy et al.Reference Audy and Audy8 concluded that the tin bronze bells from the 15th century to the one from the 20th century showed a progressive increase in Vickers hardness of the α-phase with Sn content increasing. This study indicates that the α-phase does not only greatly affect the integrated mechanical properties of Cu–Sn alloys, but also has unique mechanical properties different from the alloys.
However, due to effects of boundaries and substrates, it is difficult to obtain the accurate hardness values for a single α-phase dendrite when using conventional hardness testers, such as the Brinell, the Rockwell, the Knoop and the Vickers. And the experimental data exhibit discretization and discrepancies.
In the past two decades, instrumented nanoindentation (or depth-sensing indentation)Reference Pethicai, Hutchings and Oliver9, Reference Oliver and Pharr10 has been rapidly developed and widely used in the characterization of mechanical behavior of materials in micro or even nanoscale. It can continuously measure the load and displacement as small as 1 nN and 0.1 nm, respectively. From the load–displacement data, the mechanical properties including microhardness, elastic modulus, fracture toughness, creep stress exponent, etc., can be determined during one cycle of loading and unloading. In addition, the instrumented nanoindentation adopts the continuous stiffness measurement (CSM) technique to collect a continuous data with thickness. CSM is accomplished by imposing a small, sinusoidal varying signal on top of a DC signal that drives the motion of the indenter. It provides a method to continuously measure the mechanical properties of materials in one sample experiment without the need for discrete unloading cycles, and is ideal for detecting the difference in properties between external and interior of materials. Nanoindentation has been used to probe the mechanical properties of materials for a wide range of engineering applications,Reference Li and Bhushan11, Reference Oliver and Pharr12 and also the mechanical properties of materials from ancient times, such as enamel,Reference Riede and Wheeler13, Reference Darnell, Teaford, Livi and Weihs14 phytolith,Reference Sanson, Kerr and Gross15 and stone tools.Reference Lerner, Du, Costopoulos and Ostoja-Starzewski16
In this study, the dependence of the α-phase hardness and Young’s modulus on Sn contents in Cu–Sn alloys was studied systematically by using an instrumental nanoindentation technique. The more accurate and detailed data were obtained for further practical applications of Cu–Sn alloys.
II. EXPERIMENTAL PROCEDURES
The Cu–Sn alloys were prepared by using a high frequency induction furnace and slowly cooled at room temperature. The melting metals were of appropriate amounts of 99.9% Cu and 99.9% Sn in the form of rod and powder, respectively. Ten Cu–Sn ingots were casted with variant Sn contents including 6 wt.%, 8 wt.%, 10 wt.%, 12 wt.%, 14 wt.%, 16 wt.%, 18 wt.%, 20 wt.%, 22 wt.%, and 24 wt.%.
The metallographic specimens were prepared in a standard process: cutting, mounting, grinding, polishing, and then etching in a solution of acetic acid (50%) and nitric acid (50%). The microstructures were observed by using an optical microscope (BX51TF; Olympus, Tokyo, Japan). The crystalline structures of the specimens were examined by using an x-ray diffraction spectrometer (XRD) (D8 Advanced XRD; Bruker AXS, Karlsruhe, Germany) with Cu Kα source. The scanning speed was 6° per minute.
The nanoindentation measurements were carried out by using an instrumental nanoindenter (Agilent G200 Nanoindenter; Agilent Technologies, Santa Clara, CA). The CSM standard hardness and modulus test program were used in which the harmonic depth and frequency were 2 nm and 45 Hz, respectively. The maximum indentation depth was 1500 nm.
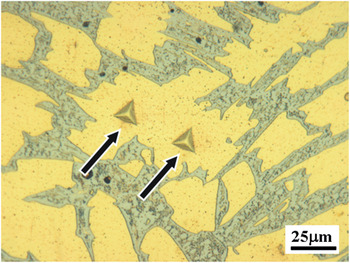
To get the data as precise as possible, the nanoindentation measurements were processed as follows: (i) Only polished the sample surface to a scratch-free condition without etching, because the etched surface produce roughness which will lead to an error of the nanoindentation data; (ii) Five indentation points upon the α-phase were tested for each sample for getting an average value; (iii) The space between two indentations was more than 25 μm for avoiding the size effect, as shown in Fig. 1; (iv) To avoid the influence of plastic deformation layer on the surface caused by mechanical polishing, the displacement in a range from 1000 to 1300 nm was selected to calculate the average values of hardness and Young’s modulus of the α-phase; (v) The Poisson’s Ratio was 0.34 for calculating the Young’s modulus.
Image of nanoindentation upon the α-phase in Cu–Sn alloys (Arrows indicate nanoindentations).

III. RESULTS AND DISCUSSION
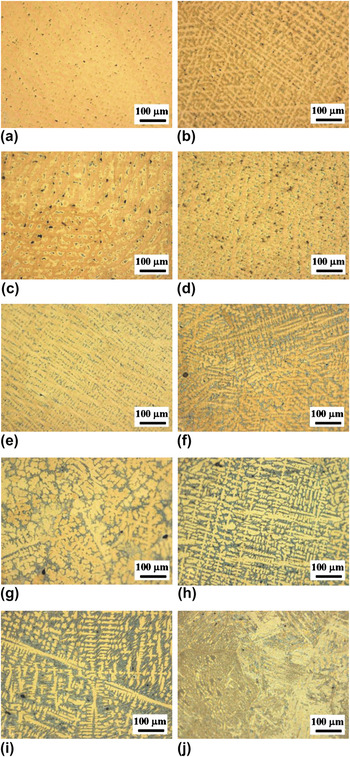
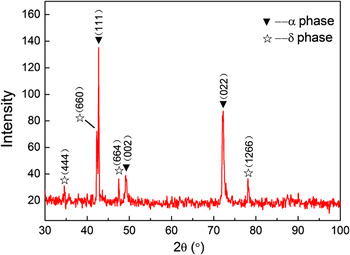
Figure 2 shows the metallographic microstructures of the casting Cu–Sn alloys with variant Sn contents. Obviously, they mainly consist of the solidified α-phase dendrites, Sn-enriched (α+δ) eutectoid, and shrinkage pores. On increasing of Sn contents, the α-phase dendrites became clearer and grow well with larger interspaces, and the proportion of the (α+δ) eutectoid gets increased. Especially, the (α+δ) eutectoid grew into a network structure, when Sn content was approach to or more than the maximum solid solubility of Sn in the α-phase (15.8 wt.%). However, when Sn content is more than 24 wt.%, the α-phase dendrites were completely transformed into the acicular (α+δ) eutectoid. Figure 3 shows a typical XRD pattern from the sample of Cu–22 wt.% Sn alloy, which also indicates the existence of α-phase and δ-phase in the Cu–Sn alloys.
Morphologies of the casted Cu–Sn alloys (a) Cu–6 wt.%Sn; (b) Cu–8 wt.%Sn; (c) Cu–10 wt.%Sn; (d) Cu–12 wt.%Sn; (e) Cu–14 wt.%Sn; (f) Cu–16 wt.%Sn; (g) Cu–18 wt.%Sn; (h) Cu–20 wt.%Sn; (i) Cu–22 wt.%Sn; (j) Cu–24 wt.%Sn.

X-ray diffraction pattern of Cu–22 wt.%Sn alloy.

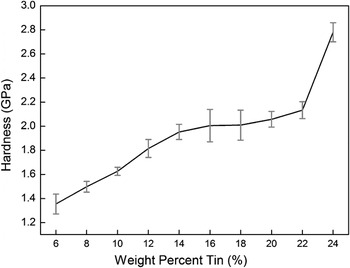
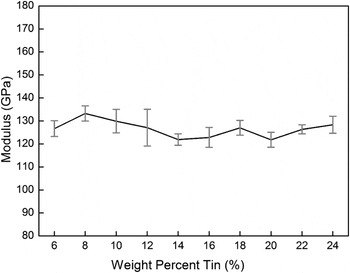
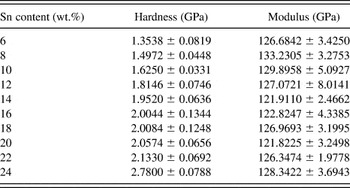
Table I and Fig. 4 give the measurements of hardness and Young’s modulus of the α-phase from nanoindentation. It is found that the hardness of the α-phase exhibits a linear increase from 1.35 to 1.95 GPa with Sn content from 6 to 14 wt.%. And the hardness keeps almost constant, when Sn content is in a range from 16 to 22 wt.%. Then, when Sn content is up to 24 wt.%, the hardness increases steeply. However, the Young’s modulus of the α-phase only varies in a narrow range between 120 and 130 GPa, as shown in Fig. 5.
Relationship between hardness and Sn content of the α-phase in Cu–Sn alloys.

Relationship between Young’s modulus and Sn content of the α-phase in Cu–Sn alloys.

Mechanical properties of the α-phase in Cu–Sn alloys.

It has been known that alloy Sn possesses a role for solid solution hardening in Cu–Sn alloys. According to Cu–Sn phase diagram, the strength of the α-phase is determined by solid solution hardening when Sn content is less than 15.8 wt.%. Generally, the mechanism of solid solution hardening includes three effects, i.e., size effect, modulus effect, and solid solution ordering effect. For Cu–Sn alloy, the solid solution hardening of the α-phase is mainly attributed to the size effect and the modulus effect, due to the difference between Sn and Cu elements in atomic radius and Young’s modulus, that is, Sn atomic radius is 0.158 nm and Young’s modulus is 46.9 GPa, while Cu atomic radius is 0.128 nm and Young’s modulus is 124.1 GPa.
For the substitutional solid solution hardening of FCC alloys, the yield stress σ is expected in directly proportional to Cn, where C is concentration of solute atoms and n is a constant associating with the interaction between dislocation and solute which will be variant for different hardening mechanisms. For example, n is 1/2 in the Friedel–Fleischer theory,Reference Fleischer and Hibbard17 whereas n is 2/3 in the Mott–Nabarro–Labusch theoryReference Mott and Nabarro18–Reference Nabarro20 and n is 1 in the Friedel–Mott–Suzuki theory.Reference Friedel21, Reference Suzuki, Takeuchi and Yoshinaga22 According to the present results, as shown in Fig. 4, when Sn content is less than the maximum solid solubility, the hardness of the α-phase exhibits a linear relationship with Sn content, which reveals that the constant n is 1, and the mechanism is in a good agreement with the Friedel–Mott–Suzuki theory. This is because compared with the other two theories, the Friedel–Mott–Suzuki theory emphasized the effect of stacking faults. That is to say, the solid solution hardening is affected by factors, such as size effect, modulus misfit effect, and presence of stacking faults. By fitting the curve in Fig. 4, an empirical formula is obtained:

where H and C are hardness of the α-phase and Sn content, respectively. From this formula, we can easily and accurately get the hardness of the α-phase corresponding to certain Sn content.
When Sn content is above the maximum solid solubility (15.8 wt.%), the hardness of the α-phase is almost invariant around 2 GPa and form a plateau in Fig. 4. This is because the extra Sn begins to precipitate as a hard δ-phase from the α-phase matrix firstly along the grain boundaries and then into the grain, and Sn content keeps constant in the α-phase. However, when Sn content is too high, a large amount of the δ-phase will precipitate, which make a difficult to measure the hardness in a single α-phase. Therefore, steeply increased hardness is arisen due to the mixture of α-phase, δ-phase, grain boundary, and phase boundary.
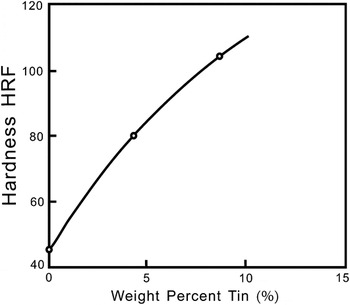
Comparing with the widely referenced curve measured by using a Rockwell method, as shown in Fig. 6,Reference Joseph3 the present results contain more data with higher precision and accuracy, due to high spatial resolution and high sensitivity of nanoindentation measurement. The research on this area has not been reported elsewhere.
Relationship between hardness and Sn content of the α-phase in Cu–Sn alloys measured by using Rockwell hardness tester.Reference Joseph3

As an inherent parameter, Young’s modulus (E) is determined by two factors, i.e., atomic bond and lattice structure. It can be expressed by the following equation:

where k and m are material constants, r is lattice parameter. In general, Sn content variation has a limited effect upon Young’s modulus values, due to limited variation of the lattice parameter, which is attributed to the difference of atomic radius between Cu and Sn. However, research has indicated that the Young’s modulus values for Cu (111) and Cu (100) surfaces are 190.3 and 66.7 GPa, respectively, due to its high anisotropy.Reference Schmidt and Boas23 Recently, Dub et al.Reference Dub, Lim and Chaudhri24 obtained the Young’s modulus of Cu (111) and Cu (100) surfaces as 170 and 52 GPa, respectively, by using nanoindentation technique, according to the unloading curves (Oliver–Pharr model) and the ISO 14577 method.25 On the other hand, the first-principle calculations based on the density-functional theory indicated that the elastic modulus of Cu3Sn and Cu6Sn5 were 134.16 and 125.98 GPa with a variation 5.75 and 7.8 GPa, respectively.Reference Chen and Lai26 However, An et al.’s calculations based on the Voigt–Reuss–Hill method showed that the elastic modulus of Cu3Sn was 147 GPa with a difference of 44 GPa between its maximum and minimum values.Reference An, Wang, Tian and Wu27 Therefore, the present results, as shown in Fig. 5, are considered to be attributed to the orientation changes during solidification.Reference Guo, Wang, Yang, Jiang, Ma and Song28
IV. CONCLUSIONS
In this study, the hardness and Young’s modulus of the α-phase in Cu–Sn alloys have been measured by using nanoindentation. Several general conclusions are summarized as follows:
(1) There exist a linear relationship between hardness and Sn contents in the α-phase when Sn content in Cu–Sn alloy below the maximum solid solubility (15.8 wt.%) with a empirical formula H = 0.0757C + 0.8916, which indicates that the solid solution for Cu (Sn) model is in a good agreement with the Friedel–Mott–Suzuki theory.
(2) The fluctuation of Young’s modulus of the α-phase with Sn contents is in a narrow range of 120–130 GPa, which is caused by orientation variation of the α-phase in the Cu–Sn dendrites.
This work provides the fundamental data for applications of Cu–Sn alloys in industry and analyzing ancient bronzes.
ACKNOWLEDGMENTS
This work was supported by the Department of Culture of Wuhan, China, and the Higher education of scientific research project Foundation of China (No. 20070486016).