


Introduction
Contemporary global attempts to prevent child labor such as the 1989 United Nations Convention on the Rights of the Child (UNCRC) and country-specific attempts are likely to draw inspiration from the virtual elimination of child labor in currently developed countries.Footnote 1 While the lower child work participation rate in developed countries is not disputed, the way these countries have achieved this goal remains a contentious issue.
In recent years, there has been a rapid increase in the amount of empirical work on child labor.Footnote 2 Despite this explosion, analyses of the historical trajectory of child labor are limited. Indeed, the bulk of the papers that do provide a historical account are limited to the United States and to the core European economies while the evolution of child labor outside the prosperous European core has rarely been investigated. For example, historical accounts of the evolution of child labor in the United States are provided by Goldin (Reference Goldin1979), Brown et al. (Reference Brown, Christiansen and Philips1992), and Moehling (Reference Moehling1999). Bolin-Hort (Reference Bolin-Hort1989), Nardinelli (Reference Nardinelli1990), Horrell and Humphries (Reference Horrell and Humphries1995), and Cunningham (Reference Cunningham, Cunningham and Viazzo1996) analyze the British experience, while studies on Belgium are provided by Scholliers (Reference Scholliers1995) and De Herdt (Reference De Herdt, Cunningham and Viazzo1996). In addition, two books attempt to summarize the literature. Hindman's (Reference Hindman2009) atlas on child labor contains several contributions on the topic, however, peripheral Europe comprises a very small fraction of the developed country literature (3 articles and 14 pages out of a total of 54 articles and 203 pages). Lieten et al. (Reference Lieten and Meerkerk2011) provide a more balanced picture with four chapters focusing on peripheral Europe (out of 14); however, only two of these contain quantitative evidence.
The aim of this paper is to address this gap by examining the case of Portugal, a peripheral European country for most of the last two centuries. Not long ago, high levels of child labor marked the country and it was only in the second half of the twentieth century that the country experienced a rapid and progressive decline in child labor. The relatively recent transition of Portugal to developed country status and the speed with which child labor has declined suggests that in addition to being of interest, a study of the Portuguese case is likely to yield insights on the effectiveness of various policy options currently being pursued by developing countries.
This paper analyzes the evolution of child labor in Portugal over the period from 1850 to 2001. Data from censii, labor force, and household surveys and qualitative information such as the testimonies of various stakeholders and news articles is used to provide an assessment of the evolution of child labor. This assessment is set against the wider economic and political background to identify the main factors that may have influenced child labor to provide an overall understanding of events and policies that shaped the trajectory of child labor in Portugal.Footnote 3
The paper unfolds by providing, in the next section, a discussion of concepts, methods, and data sources. This is followed by a description of the patterns of child labor. Having laid out the patterns we explain the factors responsible for the trajectory of child labor experienced in Portugal. The paper's last section synthesizes and contains concluding observations.
Concepts, Data Sources, and Approach
First, it is necessary to discuss key concepts such as child and child labor. Child and childhood are concepts that vary across time, space, and strata and there are disagreements on the precise thresholds between childhood and “adulthood.” The general reference for this matter is the 1989 UNCRC, which considers children as individuals who are less than 18 years old. In this paper, for the most part we work with this threshold and provide information on the work participation of individuals in the 10 to 14 and 15 to 19 age ranges. Given that our aim is to provide a historical perspective, these categories are used to enhance temporal comparability—as for many periods under analysis data is only available for these age intervals.Footnote 4 While it is clear that the definition of child and childhood does not remain constant over time, and while one may wish to provide an analysis that allows for period-specific age thresholds, this is unlikely to be a fruitful exercise, hence we opt for a fixed age-based approach. This is also consistent (and comparable) with traditional census age groups.
The next challenge is to pin down the definition of child labor. To draw a distinction between the popular and pejorative use of child labor versus child work, some scholars only employ the term child labor when they refer to the detrimental activities performed by the child, while activities that may or may not have harmful consequences are characterized more neutrally as child work (Boyden et al. Reference Boyden, Ling and Myers1998). This has led to the interesting but strenuous task of creating an inventory of what is good or bad for the child by the International Research on Working Children research institute. Distinguishing between good, inoffensive, or harmful child labor especially in the context of a historical analysis, such as this paper, is likely to be a complex exercise (Heywood Reference Heywood and Hindman2009) and perhaps not very meaningful.
In this paper, we use child labor and child work synonymously—reflecting its contribution to the production process, whether in a firm or farm or within the household. There is no overt intention of associating work with a harmful or harmless effect and the aim is to identify the main activity status of the child. In what follows we divide the main activity of a child into two distinct categories, that is, whether a child is employed (engaged in paid work) or occupied (unpaid work on the family firm/farm/house). Child labor is disaggregated by its position in relation to the labor market, distinguishing between employment and other activities.
We use qualitative and quantitative data to depict and understand the evolution of child labor in Portugal. Systematic detailed accounts of the existence and practice of child labor are scarce for the second half of the nineteenth century and therefore for this earlier period we draw upon reports written by labor and education inspectors and lawyers (Campinho Reference Campinho1995; Cardoso Reference Cardoso2001; Carneiro Reference Carneiro2003; Carvalho Reference Carvalho2001; Mónica Reference Mónica1978). Newspapers are also a good source of information and we consider reports that appeared in official government newspapers (Diário de Notícias) and those that appeared in Avante, the journal of the Portuguese Communist Party, to understand how the Communist Party, which was a member of the opposition, viewed the topic. We searched its historical records using the key words (in Portuguese): child, labor, and child labor (criança/infantil, trabalho, and trabalho infantil).
The first quantitative accounts of the extent of child labor are provided by two nationwide industrial surveys conducted in 1852 and 1881. The 1852 survey was an indirect survey—questionnaires were sent to firms—and included factories with 10 or more workers. The 1881 survey used a direct and indirect approach, that is, relied both on visits in loco and questionnaires sent to firms and included factories regardless of the number of workers. While the 1881 survey was an improvement over the 1852 survey, some firms did not respond to the queries while others provided responses without always distinguishing between minors and adults or minors and women. While both surveys perhaps underestimate industrial labor and the use of child labor, they are the best sources available. Nevertheless, industrial surveys ignore by default child labor engaged in agriculture and service activities.
From 1890 onward we draw on information collected in various censii conducted by the Portuguese government to provide estimates of child labor force participation. We identify three main periods in terms of data availability. The first period (1890–1911) corresponds to limited availability of data regarding age and types of work. For the second period (1920–30) there is no available information regarding work status disaggregated per age. The third period (1940 onward) coincides with the creation of a national statistical institute (INE) and is a period for which systematic data is available.Footnote 5
Throughout the paper, we aim to identify the percentage of working children in the age groups 10 to 14 and 15 to 19, although the data on activity status for the years 1890, 1900, and 1911 is only available for the age group below 20 years. When possible we distinguish between age groups (10–14, 15–19), sectoral (agriculture, industry, others), and type of work (paid, unpaid) composition.
In addition to census data, we also use labor force surveys canvassed by the Portuguese INE. We derive information from 14 labor surveys conducted between 2001 and 2004. Each labor survey provides comprehensive information on 45,000 to 50,000 individuals regarding their relationship with the labor market. The surveys enquire about past labor market experiences and their age of entry into the labor market. Using information on these adults and their working patterns while they were children, we can derive continuous series of the patterns of child labor during the second half of the twentieth century. Based on the response to the question, “When did you start working for the first time?,” we compute work participation rates for the age groups 10–14 and 15–19 (see figure 1).Footnote 6 Finally, for recent years, we use figures from household surveys designed specifically to identify the extent of child labor that were conducted by the Ministry of Labor and the International Labour Organization (INO) in 1998 and 2001 (Lopes and Goulart Reference Lopes and Goulart2005).
Child labor in Portugal, 1937–94. Work participation rates were calculated based on responses to the question, “When did you start working for the first time?”

Patterns of Child Labor in Portugal
The first industrial survey conducted in 1852 revealed that about 25 percent of surveyed workers in industry were below the age of 16 (3,147 children). According to the 1881 survey, the absolute number of working children rose to 5,998 while child participation as a percentage of surveyed workers fell to 7 percent. In terms of sectoral distribution, data from both the surveys shows that about 50 to 55 percent of the minors worked in the textile and weaving industry—cotton, wool, and silk. The dangerous pyrotechnics industry was the most “minor intensive” with minors accounting for almost 63 percent of its labor force. Most of the reported child workers in industry were concentrated in Oporto district indicating its early industrial development. Districts specializing in specific products also relied heavily on children. Examples include Guarda and Covilhã in wool weaving, Portalegre in cork, Leiria and Marinha Grande in glass, and Santarém in paper (for more details see Goulart and Bedi Reference Goulart and Bedi2007).
In addition to these industrial surveys, reports by labor inspectors and lawyers are additional sources of information on the work contribution of children in industry. A participant at a national congress of jurists in 1898, Sebastião Centeno, denounced the practice of male and female children as young as seven years old working for 9 or 10 hours per day, or three or four hours per night in the industrial centers, especially faraway from Lisbon (Cardoso Reference Cardoso2001). A 1904 report by a labor inspector illustrates the widespread use of child labor:
[I]t is enough to enter, by surprise, any factory, even humble (and maybe even more in small industrial establishments) to recognize the falseness of the reports;. . . in some of the employment registers of each of the establishments, appear minors who are less than ten years and in one registry there was even the naïve observation: “In addition to the registered individuals, when there is need of work some women and minors are temporarily called.” (cited in Campinho Reference Campinho1995: 27)
While these industrial surveys and reports provide useful information, this was a period of limited industrialization (Reis Reference Reis and Reis1993a), and most minors worked in agriculture and services. Although there is no quantitative data to confirm this, several reports suggest the widespread use of children in these sectors. Carneiro (Reference Carneiro2003) presents insightful reports written on children's lives in the mid-nineteenth century by Portuguese educational inspectors that suggest the primacy of work in their lives. For example, in 1863, Francisco Dinis, an inspector in a county located in the central region of the country, noted changes in the school timetable as “the children needed to walk the cattle” (ibid.: 465). Another school inspector (António Carvalho) in the same region and year noted that children's failure to attend school is
related to the students’ parents poverty and in part to their negligence, very often they see the need of occupying their children in services, either domestic, or rural. (ibid.: 455)
In 1863, a school inspector Manuel Barradas, on an inspection in the Alentejo was surprised to find zero enrollment:
The teacher assured me that after the harvest [of grapes] is finished, maybe some students will apply to come to school. . .; before that it would be impossible, because their own mothers would beat them up if they want to attend school. (ibid.: 458)
From the turn of the century, for most years, censii data is available and allows us to provide an idea of the prevalence of child labor between 1890 and 2001 (table 1).Footnote 7 These data show that between 1900 and 1911, 45 to 48 percent of children in the age group 10–19 were engaged in paid work. Thereafter, between 1940 and 1960, child activity rates (paid and unpaid work) remained stable and lay between 43 and 46 percent for children in the younger age group (10–14) while for the older age group (15–19) activity rates were in the range of 82 to 91 percent. More than 85 percent of the labor was concentrated in agriculture and services (see table 2).
Child and youth labor, 1890–2001

Source: Authors’ calculations based on census data and a 2001 household survey (for the 10–14 age group in 2001). Notes: The incidence of child labor is defined as the percentage of children/youth who are employed or occupied in the respective age group. The total is the sum of those who are employed, that is, engaged in paid work and those who are occupied, that is, engaged in unpaid work, including economic and domestic activities. Unemployment rate is the share of unemployed over the active children and youngsters.
a Between 1890 and 1911, disaggregation into two age groups is not possible. We provide a lower and upper limit for the incidence of child labor. The upper limit is calculated by dividing the working population under 20 by the population in the age group 10–19. The lower limit is calculated dividing the working population under 20 by the total population in the age group 0–19. As children are more likely to work as they age, it is likely that the 10–19 employment rate is closer to the upper limit.
b Figures are for the age group 12–14 and not 10–14.
c In 1970, only 20% of the information collected was analysed.
d In 1991 and 2001, the employed category includes paid and unpaid economic work while occupied refers to domestic work. Methodological changes in measuring employment occurred over the years: (1) The concept of employment was sharpened during the 1890–1911 period through the adoption of the concept of main employment (1900) and a clearer conceptualization of employment (1911) (Carrilho Reference Carrilho1996). (2) From 1950 and onward, the introduction of a close-ended question reduced the subjectivity of self-reported labor status (Torres Reference Torres2009).
Sectoral distribution of child and youth labor in Portugal, 1890–1960

Source: Authors’ calculations based on censii.
Notes: The figures are restricted to those engaged in paid work/employed. Labor incidence is the distribution of children in various sectors and is obtained by dividing the number of persons working in a specific age group by the total number of persons in that age group. Percent in labor force is calculated by dividing the number of persons working in a specific age group by the total number of persons in a sector.
Between 1960 and 1970 there was a sharp decline in the work participation of children especially in the younger age group and from an activity rate of 43 percent in 1960 the activity rate in this age range fell to 16 percent. For the older age group the decline was much smaller—84 to 74 percent. For both groups, the decline emanated from a sharp reduction in the use of children in unpaid work. Between 1970 and 1981 the participation rate of children in the younger age group remained steady (17 percent) while for the older age group the decline accelerated and their activity rate fell from 74 to 54 percent during this decade. The 1991 census revealed a sharp decline in child activity rates. For the younger age group the activity rate fell to about 9 percent and for the older age group it dropped to 40 percent. Just as had been seen for the younger age group between 1960 and 1970, the decline for the older age group may be attributed mainly to the sharp decline in child engagement in unpaid work between 1981 and 1991. Between 1991 and 2001 the downward trend continued, and by 2001, child activity rates in the age group 10–14 fell to 4 percent while it remained at about 23 percent for the older age group (15–19).
In addition to the censii we also used retrospective information from 14 labor force surveys to determine activity rates for children in the younger and older age group. These series, which cover the period 1937 to 1994, display patterns that are similar to that obtained from the census data.Footnote 8 Child labor in the younger age group displays a steady decline and by 1980 it is less than half the level seen in 1937 while for the older age group the decline begins only in the mid-to-late 1980s (see figures 1 and 2). To summarize, the overall picture emerging from our construction of the child labor series is one of persistence in the use of child labor between 1890 and the 1950s, a steady decline thereafter, and a sharp decline only in the last 20 years of the twentieth century.
Child labor growth rate. Annual growth rates based on figure 1.

While the focus of the paper is on the long-term trends in child labor, the secular decline tends to hide sectoral and regional differences. Throughout the period, agriculture accounted for the largest share of child workers and even as late as 1998 more than 50 percent of child workers were in agriculture (Goulart and Bedi Reference Goulart and Bedi2005). In terms of geography, child labor tended to decline faster in areas of the country (the Alentejo) characterized by large plots of land and where it was easier to deploy machinery as compared to areas in the northern and central parts of the country where plot sizes were smaller.Footnote 9 Based on a 1998 household survey, Goulart and Bedi (Reference Goulart and Bedi2008) reported that the northern and central regions accounted for more than 80 percent of child labor.
Explaining the Patterns
An examination of historical analyses of child labor suggests that several factors are likely to have contributed to the virtual elimination of child labor in currently developed countries. These include the economic growth and structure of a country including the use of technology, demography, education and educational policy, and labor legislation and activism. While some authors accord primacy to a legislative approach driven by socially aware campaigners in reducing child labor (see Cunningham and Viazzo Reference Cunningham and Viazzo1996), this “traditional view” has been challenged (see Horrell and Humphries Reference Horrell and Humphries1995; Nardinelli Reference Nardinelli1990).
In the case of Portugal our aim is to understand what led to the relative stability of child labor between 1890 and 1970 and the sharp decline thereafter. We focus mainly on three factors and while these are intertwined we first discuss each explanation in isolation and thereafter provide a synthesis. The three factors include (1) the economic growth and structure of the country and especially the role played by technology in shaping the demand for child labor; (2) educational policy and availability and quality of schooling as it may be expected that increases in access and quality of education raise the opportunity cost of working and translate into reductions in child labor; and (3) working age legislation, labor rights, and activism.
Economic Growth, Economic Structure, and Technology
At the beginning of the nineteenth century, economically, Portugal began lagging as the rest of Europe pursued industrialization. As table 3 shows, between 1820 and 1913, Portuguese per capita gross domestic product (GDP) declined from 77 percent of Western European GDP per capita to 36 percent.Footnote 10 The cause of the delay is a disputed issue. Competing explanations include instability during the Constitutional Monarchy (1820–1910), the lack of a key resource for industrialization such as coal, or simply losing its main source of wealth with Brazil's independence.Footnote 11 Regardless of the causes, Portugal's late industrial takeoff meant limited economic progress during the nineteenth century (see Reis Reference Reis and Reis1993b). Indeed, by the beginning of the twentieth century Portugal had become one of the poorest countries in Europe.Footnote 12
Per capita GDP evolution

Source: Maddison (Reference Maddison2003: 260, 262–263) for Portugal and Spain. Figures for Greece are based on Madison (Reference Maddison2003: 54–57, 66–69).
Notes: Per capita GDP valued at 1990 international Geary-Khamis dollars. Rates of growth are annual average compound growth rates (in percentages).
a Western Europe refers to an unweighted average for 29 Western European countries.
As may be expected, during this period, the country's economic structure was largely agrarian with about 60 percent of the population engaged in agricultural activities (1890–1910) and about 18 to 20 percent employed in industry (see figure 3). The period was characterized by increasing deployment of resources for agricultural purposes, and between 1875 and 1920 the amount of land used for agriculture rose from 21 to 36 percent and consequently so did demand for labor. Portuguese industry continued to lag in terms of technology and labor training. For instance, in 1881, technological progress in Portugal was still based on introducing innovations from the first industrial revolution. The major delay was in application rather than theoretical knowledge (Pedreira Reference Pedreira, Lains and da Silva2005: 34). In terms of the degree of mechanization, by 1914 Portuguese figures for horsepower per capita were about 1/3 of the corresponding figure for France, 1/6 as compared to Belgium and Germany, and 1/18 as compared to the United Kingdom (Mateus Reference Mateus, Lains and da Silva2005: 131).
Labor by economic sectors, 1890–2000. Share of employment in agriculture and industry.

In 1926, a military coup led to a conservative dictatorship that restrained industrialization until the postwar period.Footnote 13 On the economic front there was a continued reliance on low-tech agriculture and limited structural changes. Portugal remained a rural country well into the twentieth century, with strong rural lobbies and investments focusing on agriculture (Amaral Reference Amaral1994; Mónica Reference Mónica1978). In continental Portugal, the land surface brought under cultivation increased from 37 percent in 1929 to 54 percent in 1951, while the introduction of new techniques such as the use of fertilizers remained low.Footnote 14 At the same time, a declining death rate and a relatively stable birth rate meant high natural population growth rates and plenty of labor supply (see figure 4). As for the industry that did develop, it was characterized by unsophisticated consumer goods. The mode of production was predominantly artisanal and required intensive use of low-skilled labor (Aguiar and Martins Reference Aguiar, Martins, Lains and da Silva2005). The bulk of the population continued to work in agriculture (about 50 percent in the 1950s) while the share of industrial employment rose marginally to about 24 percent (see figure 3).
Annual average population growth rate by decade.

Following the end of World War II, the conservative regime began promoting economic and social reforms. After an initial rejection of the Marshall Plan, following the prevalence of industrialist lobbies the regime passed seminal legislation on postwar industrialization in 1944–45 (Amaral Reference Amaral1994) and formalized a development plan for the 1949–51 period (Garoupa and Rossi Reference Garoupa, Rossi, Lains and Silva2005). Key aspects of this plan included internationalization, and industrial and agricultural development through upgrading of production technology. From an emphasis on agriculture, industrial development was promoted and low agricultural wages and low cereal prices were used to transfer surpluses from agriculture to industry—see Confraria (Reference Confraria, Lains and da Silva2005) and Soares (Reference Soares, Lains and da Silva2005). Set in the context of a post-World War II European boom, two key economic events during this period were Portugal's entry into the European Free Trade Agreement (EFTA) and the signing of bilateral labor supply agreements with France and The Netherlands and the German Federal Republic.
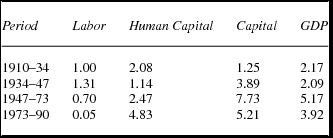
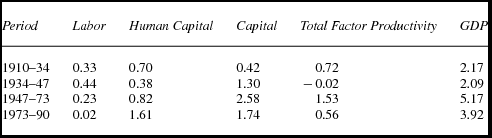
In 1960, Portugal entered the EFTA. The subsequent increase in exports to European countries led to industrial specialization and increases in imports of investment goods led to the access and adoption of more advanced production technologies (Mateus Reference Mateus, Lains and da Silva2005).Footnote 15 For example, in agriculture, machines like the thresher, harvester-thresher, and tractors became increasingly common. As shown in table 4, the use of tractors in agriculture rose almost 17-fold between 1950 and 1975, the use of threshers doubled, and the use of combine-harvesters quadrupled during this period. The continued utilization of machinery during this period led to a sharp reduction in agricultural labor demand and between 1950 and 1973 the percentage of the workforce engaged in agriculture fell from 48 percent to 27 percent. The contribution of a technology-driven growth path is confirmed by Lains (Reference Lains2003) who shows that between 1947 to 1973 the growth of physical capital was responsible for about 50 percent of Portuguese annual GDP growth of 5.17 over this period (see tables 5 and 6).
Technology in agriculture

Source: Authors’ calculations based on E. Nunes in Valério (Reference Valério2001) and A. Nunes in Valério (Reference Valério2001).
a Continental Portugal (8,894,000 hectares) until 1951. Continent plus Portuguese islands (9,198,200 hectares) thereafter.
Growth of factors and GDP, 1910–1990 (annual growth rates,%)
Source: Lains (Reference Lains2003).
Growth accounting for Portugal: Sources of growth and output growth, 1910–90 (%)
Source: Lains (Reference Lains2003).
In both agriculture and industry, technological innovation meant the adoption of labor-saving technologies and a reduction in the demand for labor. The decline in labor demand added to a high birth rate and a steady death rate (see figure 4) may have been expected to lead to a growth in labor supply and a wage squeeze. However, the decline in labor demand was matched by massive emigration flows. A booming European economy urgently needed workers. Portugal signed bilateral labor supply agreements with France and The Netherlands in 1963 and the German Federal Republic in 1964 (Veiga Reference Veiga, Lains and da Silva2005). Subsequent (legal and illegal) emigration flows meant that more than 1.7 million or about 18 to 20 percent of the Portuguese population left the country between 1950 and 1973.Footnote 16 The direct effect of mass emigration of youngsters and adults on the country's demographics as well as the indirect effect due to the emigration of the population in the fertile age group served as a check on population growth and translated into negative total population growth rates in the 1960s, in spite of the historical peak in natural growth rates during this period.Footnote 17 Additionally, migration from rural to urban areas across the country accelerated in the 1940s and 1950s (Nunes Reference Nunes, Pereira and Mata1996). Increases in capital intensity and the decline in growth of labor translated into sharp wage increases in industry and particularly in agriculture. Between 1958 and 1972, wages in urban areas doubled and rural wages trebled (see figure 5).Footnote 18
Real wages indices, 1931–91. Real wages were obtained by deflating the wage indices by a price index.

After 1974, in the early years of the postdictatorship period, in a context of greater openness and labor abundance the economy experienced a resurgence of specialization in labor-intensive, low-skilled, and low-growth sectors (Lains Reference Lains2003). The currency experienced a sliding devaluation from 1977 (Aguiar and Martins Reference Aguiar, Martins, Lains and da Silva2005), and trade agreements with the European Economic Community (EEC) in 1973 and 1977 made exports to Europe and subcontracting from European companies more attractive leading to an economic boom in some regions. The influx of population after decolonization and the end of emigration to Europe led to a sharp growth in population in the 1970s (see figure 4). A restrictive governmental policy coordinated with the International Monetary Fund (IMF) targeted macroeconomic imbalances in 1979, with the share of social expenditures declining until 1982 and a reduction in real wages witnessed up to the mid-1980s.
In 1986, after nine years of negotiations, Portugal joined the EEC. The country received substantial flows of European funds that allowed increases in public expenditure, supported further restructuring of the economy, and supported a continuation of the process of technological upgrading. Between 1975 and 1995, the use of tractors in agriculture doubled while the share of labor involved in agriculture continued to decline. While the 1970s and the early 1980s had been marked by a return to low-tech manufactures, after European Union accession the complexion of Portugal's exports and manufacturing employment became increasingly high tech. From 1988 to 2006, the share of exports from low-technology firms halved, declining by 29 percentage points, while employment in low-technology firms in the industrial sector only declined by 5 percentage points (Alexandre et al. Reference Alexandre, Bação, Cerejeira and Portela2011). After the mid-1980s the real wages also started increasing.
In terms of the overall picture of economic growth during this period, the country grew at a faster pace than the rest of Western Europe. From a per capita GDP, which amounted to 36 percent of Western European GDP in 1913, by 2001, Portugal's per capita GDP had risen to 74 percent of Western European GDP. Lains (Reference Lains2003) shows that during the period from 1973 to 1990, capital stock grew at an annual rate of 5.21 percent and was responsible for 44 percent of the country's output growth during this period. A remarkable change as compared to the rest of the century was the increasing importance of human capital in promoting economic growth (41 percent) and a sharp decline in the contribution of labor, which was almost negligible over this period (see tables 5 and 6).
Educational Policy and Educational Developments
In education, despite the passage of a compulsory education law in 1840, Portugal lagged behind its European counterparts. In 1850, the literacy rate was 15 percent. By 1900 this figure had risen to 25 percent, a modest level as compared to the 95 percent literacy rate in Nordic counties as well as the 40 percent achieved in Spain, Italy, and Poland (see table 7). Consistent with the increase in literacy rates, primary school enrollment rose from 28 to 48 percent between 1864 and 1890 and rose further to 69 percent by 1930.Footnote 19 While enrollment rates rose, the quality of schooling was often said to be very poor.Footnote 20 For example, in 1888 the primary school student teacher ratio was 58 (see table 8). Despite timely diagnoses of educational needs, execution was tardy (Reis Reference Reis and Reis1993c).Footnote 21
Literacy rate in Europe, 1850–2001
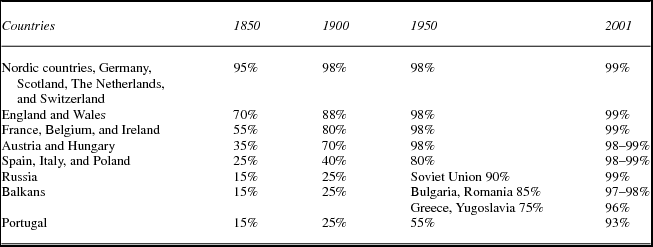
Source: Johansson in Candeias (Reference Candeias2004) and http://world.bymap.org/.
Note: Estimates are based on census data, literacy rates of conscripted and condemned individuals, and matrimonial records.
Schooling in Portugal, 1864–2001

Source: Authors’ calculations based on Mitchell (Reference Mitchell2007) and Lains (Reference Lains2003) for numbers before 1960 and Pordata and GIASE (2006) for data after 1960. Information on average school years is from Valério (Reference Valério2001).
Note: Primary school includes first to fourth grade. Secondary school includes fifth to twelfth grade.
a Data for primary schools is restricted to public schools.
b Data for secondary schools is restricted to public schools until 1955.
c After 1949, students at Technical High schools are included in tertiary Education.
d The calculations are based on gross enrolment rates in primary and secondary schooling and assumes that students fulfil the level enrolled (i.e. each student enrolled in primary school completes 4 years) and, therefore, should be viewed as an upper limit.
The Republican period (1910–26) witnessed greater attention being paid to education, such as the creation of a Ministry of Public Instruction and the reinforcement of teacher's pay, but due to instability in the government implementation remained poor. For instance, the Ministry of Public Instruction had 49 ministers in 14 years and consequently zigzag reforms were quite common.
A parliamentary discussion of education laws in 1938 provides compelling information on how education was understood by some. For example,
The teachings of abstract things are absolutely in discordance with the environment the student lives in. In a village a boy that becomes distinguished in primary schooling is a boy lost to his family. — Teixeira de Abreu, Member of Parliament (in Carvalho Reference Carvalho2001: 765)
. . . I would try to reproduce today the environment that I met fifty years ago in the rural school of my village. — Fernando Borges, Member of Parliament (in ibid.: 766)
While gross primary school enrollment rose from 69 percent in 1930 to 99 percent in 1950, net enrollment rates were lower. Additionally, schooling was characterized by low quality with crowded classrooms of an average of more than 40 students per teacher (figure 6). The average years of schooling of the labor force increased marginally from 0.9 in 1940 to about one year in 1950 (see table 8). Higher education was intended for a minority, which included urban and rural elites and a growing urban middle class. Mónica (Reference Mónica1978: 255) suggests that for lower classes the opportunity cost of education was high while the perceived future benefits of schooling were low. The rationale was that the family could not afford to spare children's work or salary and there was no room for upward mobility in the regime's rigid social structure: “In an illiterate society, ignorance does not constitute . . . a disadvantage; and it is also not a stigma because illiteracy is the rule, not the exception” (ibid.: 255).
Student-teacher ration. Primary school includes first to fourth grade. Secondary school includes seventh to twelfth grade. Data for primary schooling is restricted to public schools up to 1939. Data for secondary schooling is restricted to public schools up to 1955.

Unsurprisingly, in terms of literacy rates, by the 1950s Portugal lagged even further behind its European counterparts (Candeias Reference Candeias2004). From a literacy rate of 25 percent in 1900, Portugal recorded a literacy rate of 55 percent in 1950. This increase in 30 percentage points, while not small, pales in comparison with the increase in literacy rates from 25 to 90 percent in Russia and other eastern and southern European countries (table 7).
After 1950, the focus was on increasing investments in primary schooling and the training of technicians (Carvalho Reference Carvalho2001). Driven by the needs of the modernization strategy and especially the adoption of skill-biased technologies, unskilled labor began to be viewed in a considerably different light by employers and the regime. Education was now needed for a prepared labor force and consequently educational expenditure increased in the 1950s. In 1956 and 1960, compulsory education was increased from three to four years of schooling first for boys and later for girls. In 1964 it was raised to six years (table 9). At the same time, there was an increase in school quality as reflected in the pupil-teacher ratio, which fell from 43 in 1950 to 31 in 1970 and which provided further incentives to acquire schooling (see table 8). The average years of schooling that had remained at about one year between 1940 and 1950 more than doubled to about 2.1 years by 1970 (table 8).
Working age and compulsory schooling laws

Source: Williams (Reference Williams1992); Campinho (Reference Campinho1995).
a The law was approved in 1986 and the batch entering school in that year was the first to have nine years of compulsory schooling. By 1995, when this cohort reached ninth grade, the law was universally applicable.
After 1974, following the end of the dictatorship, emphasis on education was enhanced. Educational expenditures rose and in 1976 the educational budget surpassed the military budget (figure 7). A school milk program became a powerful weapon against absenteeism and hunger (Silva Reference Silva1991). School conditions improved with the pupil-teacher ratio falling from 31 to 14 at the primary level and 19 to 10 at the secondary level. At the same time, increasing returns to education provided a strong incentive to acquire education—at all education levels net enrollment rates increased until the early 1990s (table 8).Footnote 22 School attainment increased and average years of schooling of the active population rose from 2.1 in 1970 to 4.3 in 1991 (table 8). Compliance with EEC norms led to an increase in compulsory education from 6 to 9 years of schooling in 1986.
Budget of the Ministry of Education, 1914–98.

Rights, Labor Legislation, and Activism
In Europe in the nineteenth century, rising social unrest propelled by progressive urban elites and unions led to the demand for better working conditions and reinforced the need to regulate child labor. In Portugal, after rejecting a proposal on regulating child labor in 1881, legislation designed to prevent industrial child labor was adopted in 1891. After centuries of “natural” work contribution by children, Campinho (Reference Campinho1995: 31) attributes the need to regulate child labor in Portugal to rising social unrest. Proximate causes included a workers’ revolt in Porto, demanding better working conditions. Later in the year, the Catholic Church issued an Encyclical in the same vein.Footnote 23 Because of this legislation, the minimum working age for industrial employment was set at 12 years (agriculture was excluded), with an exception of 10 years with completed fourth grade education for metallurgists. A major feature of these laws was their focus on industry while leaving other activities unregulated.
This ambivalence between the rhetoric and policy across types of child labor is quite interesting. Legislators and unions focused on the ills of child labor in industry and accordingly the 1891 law only restricted child labor in the industrial sector, while the bulk of child labor was in agriculture and “services.” An earlier legislative attempt in 1881 had failed as the industry was then more dependent on child labor. Additionally, the approval but nonimplementation of other laws, such as the one on compulsory education, raises doubts about the state's willingness to implement such laws.
During the dictatorship, there was all-round support for child labor as may be inferred from the attitude toward schooling and the idealization of a rural and simple life. In 1938, Pacheco de Amorim, a parliamentarian, stated, “Child labor is a good school of responsibility” (Mónica Reference Mónica1978: 248). In contrast to rural labor, the “cruel” industrial working conditions were denounced by an urban elite. For example, newspaper articles in Diário de Notícias, the regime's newspaper of record, highlighted cases of industrial labor and reported that “children of 10/12 years old that earned 11 escudos per week, underfed, and working excessively long hours” (ibid. 250–51). Despite denouncing industrial child labor, new legislation on preventing child labor introduced in 1934 and 1936 simply extended the prohibition of work amongst children under 12 years old from industry to commercial enterprises (Campinho Reference Campinho1995: 30). Work performed within the household or in a rural setting continued to be allowed.
The Communist Party, which was in opposition, also tended to support child labor, even though it also emphasized education. In 1936, Avante, the journal of the Portuguese Communist Party, pledged that the “Portuguese Communist Party. . . struggles for the liberation of adults and the salvation of children.” In 1938 it denounced the differences between children of different classes. While some children could go to school, others had to work, selling newspapers or vegetables. Six- or seven-year-old children worked in quarries near Lisbon, “earning painfully their bread, those children that never knew where there was a school.” In 1937, it reported a work accident in Aveiro, where stone mines used almost exclusively 7 to 14 year olds as workers, who received salaries varying between one-fourth to two-fifths of the adult pay. In 1941, the neorealist novel Esteiros written by a communist militant described the harsh life of child workers in a brick factory.Footnote 24 However, while the Communist Party denounced the use of child labor in “harsher” sectors, it did not comment on the use of child work in agriculture.Footnote 25
In sum, despite the growing concern in some sectors of the Portuguese population of the hardship of child labor and particularly the exclusion of schooling, (agricultural) work was seen as normal or at least a necessity, and therefore a lesser evil. Nonetheless, in terms of working conditions, while the situation in agriculture and domestic services may not have been as poor as in industry, they were certainly not harmless. Colectivo 9° ano (2006) presents the life stories of men and women who lived in the Alentejo from 1920 to 1974 and had migrated to Setúbal, a town in the coastal area.Footnote 26 According to these life histories,
[C]hildren did not stay long in school and girls were worse off because of prejudice and of their usefulness for other tasks. Most children started working when they reached nine years, sometimes sooner. The ones who did not go to school used to work full time while those who did attend school worked after school hours. Girls worked in domestic services for the big landowners, or would go to the nearest village, city or even Lisbon. Often there was no remuneration and the work only assured their meals. Boys started by taking care of cattle, chicken and pigs and by twelve or thirteen, they could try to work in the fields. The tasks were harvesting olives or wheat, and children were always included in large groups of workers, but earned less. The money would go to the family or more likely to the father. Children would usually get up at five o'clock in the morning, eat something before work and then walk many miles to the fields. The work finished at sunset and they reached home nine, ten o'clock in the evening. Girls could still have domestic chores to do. (ibid.: 55–56)
Thus, despite introducing legislation at a time when child labor was widely used, attempts to implement the 1891 law were limited, and for about 80 years (1891–1969) the law was left unchanged (table 9). In 1969, the minimum working age was increased to 14, that is, during a period when child labor amongst the younger age group had already started declining (see table 1 and figures 1 and 2). Furthermore, the law only dealt with regulating the minimum working age for children involved in industry, which by 1960, comprised only 17 percent of total child labor (see table 2), while the decline in child labor took place mainly through a reduction in the use of children in unpaid unregulated intrahousehold work. Both the timing and the source of the decline suggest that the passage of the law may have been a consequence of the decline instead of a key factor determining the reduction in child labor witnessed during this period.
During the late 1980s and 1990s, promoted by European Union accession, a more demanding and internationally aware society began denouncing child labor. Unions and Catholic organizations highlighted and disparaged child labor and several reports in the national and international popular press continued to highlight the plight of working children (Eaton and Pereira da Silva Reference Eaton and da Silva1998). In marked contrast to the views expressed by parliamentarians in 1938, in 1989 the Portuguese president referred to child labor as a “true scourge” (Williams Reference Williams1992). In 1991, the minimum working age was raised to 16.Footnote 27 Under increasing national and international scrutiny the government undertook three main measures. Information was collected to place the child labor debate on an informed footing. In cooperation with the ILO, two household surveys especially designed to gather information on working children were conducted in 1998 and 2001. A special program, Plano para a Eliminação da Exploração do Trabalho Infantil (PETI), was launched to study and fight child labor.Footnote 28 The labor inspection regime was tightened, and between 1997 and 2002 the number of factory inspections increased from 1,500 to about 11,000 visits per year (IGT 2007).Footnote 29
While these measures are likely to have further increased the pressure to reduce child labor, as is evident from table 1, the reduction in child labor was well under way by 1991 and indeed the bulk of the reduction in child labor for the older age group occurred between 1970 and 1991 (reduction from 74 percent to 40 percent) rather than after 1991 (40 to 23 percent), and it is hard to believe that an increase in the minimum working-age law was a key factor responsible for reducing child labor during this period. Not only was change under way, but the law forbidding work under 16 years did not cover the bulk of the older age group (15–19).
Synthesis and Discussion
There are several points about the Portuguese experience with child labor that should be highlighted. From 1820 to 1910, Portugal lagged behind most of Europe in economic and social terms. By 1950 it started catching up economically, although lagged further behind in social terms. The second half of the twentieth century was marked by an economic and social recovery, with an emphasis on economic growth in the first quarter and an emphasis on social achievements in the second quarter. As the data presented in the paper show, child labor remained stable over the period from 1890 to 1950, thereafter it began to decline with the sharpest changes occurring in the last twenty years of the twentieth century.
Set against the economic and political narrative provided in the previous sections, the stability of child employment between 1890 and 1950 and the trigger for the decline thereafter may be readily understood. In the first half of the twentieth century, a reliance on low technology and a rural way of life made child labor possible and necessary (in terms of demand). At the same time, demographic growth guaranteed a generous supply of labor. While educational access did increase during this period, limited opportunities for those who did acquire schooling ensured that schooling did not interfere with work. From the perspective of rights and laws, minimum working-age laws did not change during this period while compulsory schooling laws weakened. Ensuring a steady agricultural labor supply was crucial as rural elites feared labor shortages, and this was amply reflected in the politically consensual view on children working in rural areas.
After 1950, the sharp decline in child labor force participation amongst the younger group especially in terms of involvement in unpaid work (the main source of decline) is most likely to have been driven by the increased use of mechanization in agriculture and the consequent reduction in (child) labor demand. At the same time, the improvement in educational quality is likely to have increased the opportunity cost of working and provided an incentive to substitute schooling for working especially for the younger age group. The relatively smaller decline for the older age group may be attributed to the effects of the sharp emigration experienced during the 1960s. An 18 to 20 percent decrease in the Portuguese population implies a more than proportionate decrease in the labor force as most emigrants were individuals in the age group 20 to 44 (Valério Reference Valério2001). Thus, despite the labor demand decreasing effects of mechanization and increases in rural wages, the effect of the emigration flow is likely to have worked in an opposing direction resulting in a smaller decline in labor participation amongst the older age group.
Since the 1980s, the involvement of all children in the labor force has displayed a sharp decline. These declines are likely to have been a result of continued technological upgrading in agriculture and industry, interacting with the effects of educational investments to increase economic growth that in turn reduced the need to rely on child labor (demand reduction). At the same time, increase in wages, educational returns, and declines in fertility are likely to have contributed to a reduction in the supply of labor. National and international pressure also promoted changes in social norms. Changes in educational and labor legislation promoting schooling and increases in educational quality and eventually labor inspections further contributed to the rapid reduction in child labor.
Overall, our findings suggest that the long-run evolution of child labor in Portugal was determined mainly by the needs of the economic structure of the country, which in turn determined the pattern of labor demand. We argue that it was the progressive adoption of skill-biased technologies that pushed children away from work and while the passage of compulsory schooling and minimum working-age laws may have provided additional impetus, they were not the main drivers as changes in these laws tended to follow declines in child labor. More generally, if countries rely on low-skill and low-wage labor to generate economic growth then relying on a legislative approach to deal with child labor is unlikely to be effective.
Acknowledgments
We thank the comments of participants at the Fifth Economic Business Historical Society 2010, the Fifth Iberian Cliometrics Workshop 2011, the Portuguese Economic History Workshop 2011, and the ISEG Economics Department Seminar 2013. We particularly thank the comments of Ben White, Catarina Grilo, Jaime Reis, Judith Stein, Linda McPhee, Luciano Amaral, Lynne Doti, Michael Grimm, Michael Huberman, Robert Sparrow, Tiago Mata, and two anonymous referees for helpful comments and suggestions. Goulart gratefully acknowledges the financial support from Fundação para a Ciência e Tecnologia, Portugal through grant SFRH/BD/31342/2006.



