Introduction
Wheat (Triticum spp.) is a cosmopolitan crop due to its cultivation in all the major agro-ecological zones of the world. It is the second most important cereal crop after rice and accounts for about one-third of global grains production (Tandon, Reference Tandon2000). Ninety per cent of the world's wheat acreage is occupied by T. aestivum ssp aestivum L, while remaining comes from other two species T. turgidum ssp durum (Desf.) Husn. and T. turgidum ssp dicoccum (Schrank ex Schubl) Thell. (Priya et al., Reference Priya, Diyali, Mukherjee and Srinivasarao2015). During the course of evolution, farmers selected array of characters such as plant height (PH), higher number of spike and grains, spike weight and 1000-grain weight (Peng et al., Reference Peng, Sun and Nevo2011). Local landraces evolved in diverse ecosystem are important source of genetic variation, which greatly contributes to the improvement of wheat varieties (Simmonds, Reference Simmonds1979). Many landraces from India have been identified for specific traits, such as Muzaffarnagar white for high yielding, Mundia for drought tolerance, Halna for heat tolerance, Naphal suitable for biscuit making. The wheat landrace Daruma from Japan is a source of reduced PH in majority of modern cultivars (Reitz and Salmon, Reference Reitz and Salmon1968). The landraces are adapted to specific niche and having specific attributes preferred by the farmers. Genetic variation in the experimental material provides an information base of traits to the breeders for utilization in hybridization programme. Studying the diversity among the genotypes, landraces and varieties is useful for improving and increasing genetic variation, and to develop strategies for the conservation and management of genetic resources and its utilization in breeding programmes (Priya et al., Reference Priya, Diyali, Mukherjee and Srinivasarao2015). Therefore, information about diversity within the germplasm collection has a significant impact on crop improvement and is essential for the development of eco-friendly, disease resistant, high yielding wheat varieties suitable for diverse climatic conditions (Wani et al., Reference Wani, Sheikh, Najeeb, Iqbal, Kordrostami, Parray and Jeberson2018). Even for developing hybrid wheat, requires complete understanding of diversity in floral structure (Maniee et al., Reference Maniee, Kahrizi and Mohammadi2009). Landraces are important genetic resources that can be used in development of high yielding varieties especially under changing climatic condition (Jaradat, Reference Jaradat2013). Further, they have a closer association with new cultivars and main constitution of primary genepool thus can be used for widening the genetic base of the wheat crop especially under changing climatic condition. To study the genetic relationship among the genotypes multivariate statistical algorithms is an important approach (Mohammadi and Prasanna, Reference Mohammadi and Prasanna2003). Several researchers have proposed various multivariate statistical tools to study the diversity in wheat including the cluster analysis and principal component analysis (PCA) (Jamali and Ali, Reference Jamali and Ali2008; Degewione and Alamerew, Reference Degewione and Alamerew2013). Cluster analysis method can also be used for the assessment of valuable economic and adaptive traits (Ali et al., Reference Ali, Khan, Hussain, Atiq and Ahmad2019; Adilova et al., Reference Adilova, Qulmamatova, Baboev, Bozorov and Morgunov2020) and selection of high-performance genotypes. It was also used to determine the morphological similarities between genotypes (Awan et al., Reference Awan, Khurshid, Afzal, Ahmed and Chaudhry2014; Yadav et al., Reference Yadav, Singh and Malik2015).
Further, in cluster analysis based on morphological similarities, the groups are formed and on the basis of genetic distance among groups, divergent genotypes are identified for hybridization programme. The hybridization among genetically different parents is likely to give higher heterotic expression in next-progeny (Shekhawat et al., Reference Shekhawat, Vijay and Singhania2001). The degree of heterosis obtained in the offspring is proportional to the genetic distance between parents (Wani et al., Reference Wani, Sheikh, Najeeb, Iqbal, Kordrostami, Parray and Jeberson2018). PCA can convert some potentially correlated variables into a small number of variables called principal components (Mujaju and Chakuya, Reference Mujaju and Chakuya2008). In addition, the analysis describes the maximum variance in the data set by including the total variance of the variable and function as a linear variable (Mecha et al., Reference Mecha, Alamerew, Assefa, Assefa and Dutamo2017).
The utilization of plant genetic resources has been emphasized by various authors (Dempewolf et al., Reference Dempewolf, Baute, Anderson, Kilian, Smith and Guarino2017; Hasan et al., Reference Hasan, Hasibuzzaman, Abdullah, Kallol, Salgotra and Zargar2020) for the development of superior varieties and sustainable food production. Landraces are considered important from adaptability and genetic study point of view (Villa et al., Reference Villa, Maxted, Scholten and Ford-Lloyd2005). During the past two decades, characterization and evaluation of landraces are being considered as an important activity in any genetic resources project. The characterization of population structure (landraces/released cultivar) in wheat germplasm is essential to understand diversity. However limited studies are conducted in evaluation of landraces of wheat in India. The purpose of this study was to assess the diversity among released wheat varieties and wheat landraces collected from various parts of India by using cluster analysis and PCA and to identify the superior genotypes for utilization in hybridization programme.
Materials and methodology
Plant material
For the present study, 120 diverse wheat genotypes were obtained from germplasm resource unit of ICAR-Indian Institute of Wheat and Barley (ICAR-IIWBR), Karnal. Of the 120 wheat genotypes, 95 were landraces, 7 were trait specific registered genetic stocks, 14 were released and notified varieties, 3 were improved genotypes (Advance lines) and 1 was exotic material. Of the 95 landraces, 42 were collected from Gujarat, 24 from Madhya Pradesh, 12 from Uttarakhand, 7 from Rajasthan, 3 from Assam, 2 from Maharashtra and one each from Himachal Pradesh, Andhra Pradesh, Arunachal Pradesh, Delhi and Uttar Pradesh.
Experimental site and design
The material was evaluated consecutively for two winter seasons during 2019–2020 and 2020–2021 at research and experimental farm of ICAR-IIWBR, Karnal (latitude 29°.42’ N and longitude 76°.59’E) situated at an elevation of 240 m above sea level. The experiment was carried out in randomized block design with two replications. Each genotype was grown in 1.25 m long three rows plot with row to row spacing of 25 cm between rows and 5–6 cm between plants. A basal dose of N:P:K @50:60:40 kg/ha was applied at the time of sowing. Another dose of Nitrogen@50 kg/ha was top dressed at tillering stage. Plots were irrigated at 20–25 days interval. Weeds were controlled manually. Propicanazole (25EC@0.1%) was sprayed at flag leaf opening stage (Zadoks growth stage 47) and kernel water ripe stage (Zadoks growth stage 71) to control yellow and brown rust. Crop was harvested manually by cutting above ground.
Data recording
Data were recorded on 14 agro-morphological traits. Days to heading (DH), days to anthesis (DA), days to maturity (DM) and grain filling period (GFP) were recorded on plot basis. DH was recorded as the number of days taken from sowing to when ear emergence was observed in 50% of plants, DA was recorded as the number of days taken from sowing to when extrusion of anthers from the spikelets was observed in 50% plants, DM was recorded as number of days taken from sowing to when physiological maturity was observed in 75% plants showed and GFP was counted as number of days taken from anthesis to maturity. Five plants were randomly selected from the centre row and observations on PH, spike length (SL), spikelet number per spike (SlPS) and spike dry weight (SDW) were recorded from it. PH of the main tiller was measured in cm from ground level to the top of the spike excluding awn at maturity, SL was recorded in cm from the base of the spike to the tip excluding awns, SDW was weighed in gram after harvesting spike from main tiller, SlPS were counted as number of spikelets on a single spike of the main tiller, seed number per spike (SNS) were counted as number of seeds on a single spike and weighed for seed weight per spike (SWS). Number of tillers in a meter (TN) were counted and recorded; weight of randomly selected 1000 grains from each plot was recorded as thousand-grain weight (TGW). All the plants from each plot were harvested above the ground level and weight of total produce was recorded as Biomass (BM) and grains were threshed separately and weighed from each plot and recorded as grain yield (GY).
Statistical analysis
Pooled analysis of variance was performed on replicated two years data recorded for each trait. The non-significant Genotype x Year effect was observed for all the traits except SNS, SWS, BM and SDW. As a result of this analysis, mean values from the two years data was calculated for each trait and used in further analysis. The clustering method and PCA programme of Statistical Package for Agricultural Research (SPAR1) was used for grouping the genotypes. Different cluster solutions were compared using a sequential F-ratio test as described by Beale (Reference Beale1969) and elaborated by Sparks (Reference Sparks1973). Mean, standard deviation and coefficient of variation (Zhong and Qualset, Reference Zhong and Qualset1995) were calculated for each group as well as for released varieties and landraces. R software was used for plotting graphs (R Core Team, 2020).
Results
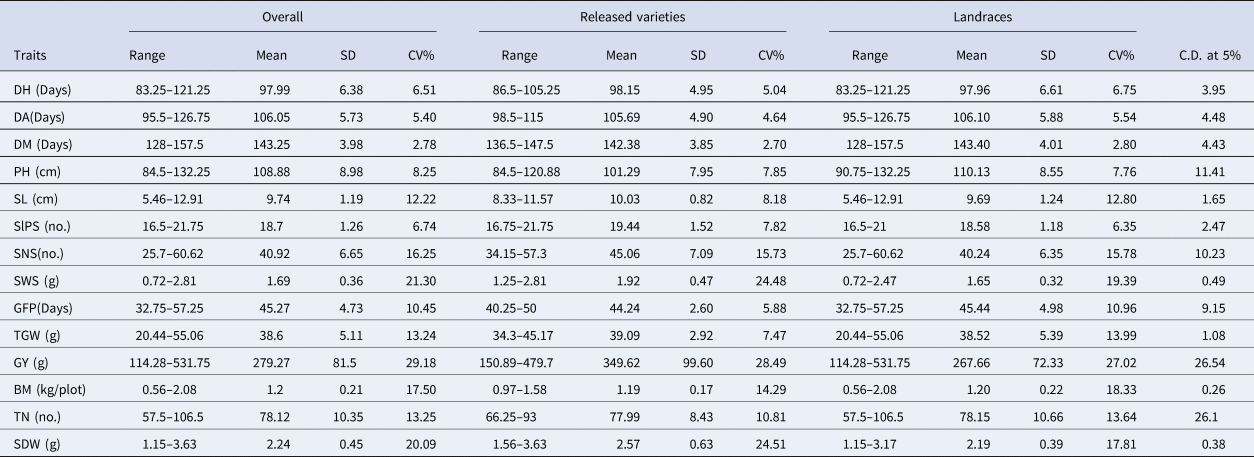
The mean values, range, standard deviation and coefficient of variation (CV%) for each trait as well as on overall mean basis vis a vis for released varieties as a group vs landraces as a group were calculated and presented in Table 1. The highest CV values was observed for GY followed by SWS on over all mean basis as well as in released varieties and landraces groups. The lowest CV value was observed for DM indicating the least variation among all accessions for this trait. The released variety group exhibited significant superiority over landrace's group for GY and SWS, whereas landrace's group exhibited numerically higher value for PH, TN and BM as compared to released varieties.
Descriptive statistics for 14 agro-morphological traits on an overall basis vis a vis released varieties versus landraces

Grouping of genotypes
The cluster analysis program of SPAR1 grouped 120 genotypes into nine clusters namely cluster A, B, C, D, E, F, G, H and I. Maximum number of genotypes were found in cluster ‘F’ (30) followed by cluster ‘I’ (27 genotypes) while Cluster ‘B’ had only two genotypes. Cluster ‘A’ contained 15 genotypes mainly collection from Gujarat and Madhya Pradesh and registered genetic stocks. Cluster ‘B’ contained two genotypes namely Kapargaon local (T. aestivum ssp sphaerococcum (Perc.) Mac key) and Mangura local. Cluster ‘C’ had nine wheat genotypes mainly comprising of released varieties, registered genetic stocks. The collection from Uttarakhand was grouped in cluster ‘D’, while Cluster ‘E’ and ‘G’ contained eight and 15 genotypes, respectively and mainly collection from MP and Gujarat. Cluster ‘F’ comprised of landraces collected from Gujarat, Madhya Pradesh, Rajasthan, Uttarakhand, Assam and Maharashtra. Cluster ‘H’ comprised of landraces collected from Gujarat, Rajasthan, Uttarakhand, Assam and Madhya Pradesh. Cluster ‘I’ covered accessions collected from Gujarat, M.P., Rajasthan, Assam, Andhra Pradesh and Arunachal Pradesh.
Intra cluster values and inter-relation of cluster
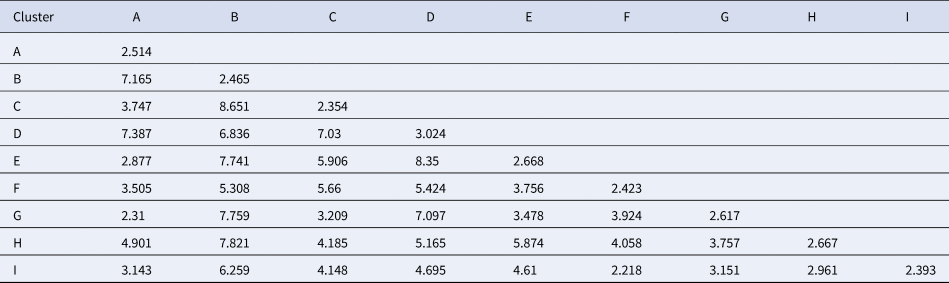
The inter-cluster distance varied from 2.218 to 8.65. The minimum inter-cluster distance was observed between cluster ‘F’ and cluster ‘I’ (d = 2.218) indicating that the genotypes of these two clusters were closely related. The maximum inter-cluster distance was observed among cluster ‘C’ and ‘B’ (8.65) followed by cluster ‘D’ and ‘E’ (8.35), cluster ‘B’ and ‘H’ (7.82), cluster ‘B’ and ‘G’(7.75), cluster ‘B’ and ‘E’ (7.741), cluster ‘A’ and ‘D’ (7.387) (Table 2). Intra-cluster distance range varied from 2.39 to 3.02.The maximum intra-cluster distance was observed in cluster ‘D’ (3.024) followed by cluster ‘E’ (2.668) and cluster ‘H’ (2.667).
Intra and inter-cluster distance between nine clusters in wheat genotypes

Note: intra cluster distance (diagonal and bold) and inter cluster distance (off-diagonal).
Cluster mean analysis
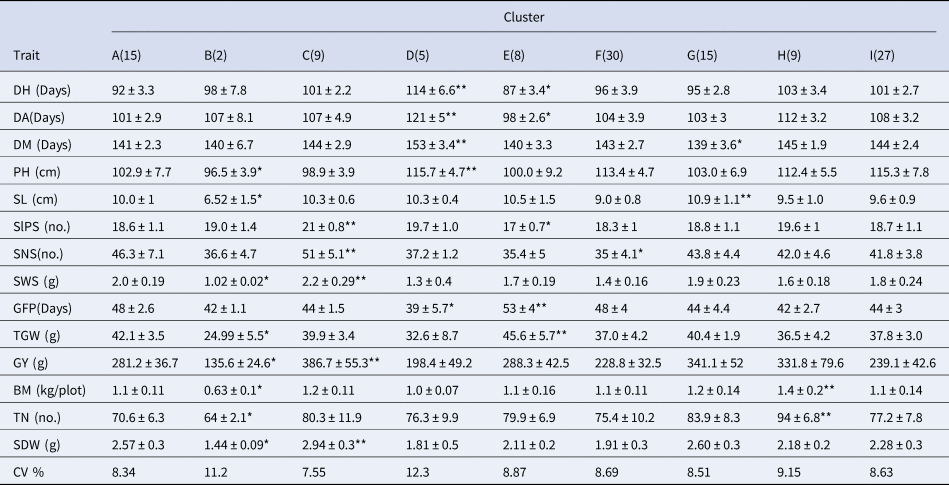
Cluster mean and standard deviation of each trait were tabulated in table 3. Cluster ‘B’ comprised of only two accessions with 1.66% of the population and covering population with short PH (96.5 ± 3.9), lower value for SL (6.52 ± 1.5), lower value for SWS (1.02 ± 0.02) and TGW (24.99 ± 5.5), GY (135.6 ± 24.6), BM (0.63 ± 0.1), TN (64 ± 2.1), SDW (1.44 ± 0.09). Cluster ‘C’ had higher value for SlPS (21 ± 0.8), SNPS (51 ± 5.1), SWS (2.2 ± 0.29), GY (386.7 ± 55.3) and SDW (2.94 ± 0.3). The cluster ‘D’ depicts 4.16% of the population and comprised five genotypes which showed higher value for DH (114 ± 6.6), DA (121 ± 5) and DM (153 ± 3.4) and lower value for GFP (39 ± 5.7). Cluster ‘E’ contributed 6.6% of the population with eight genotypes, having higher value for GFP (53 ± 4) and TGW (45.6 ± 5.7), while lower value for DH (87 ± 3.4), DA (98 ± 2.6) and lower value for SlPS (17 ± 0.7). Cluster ‘F’ has huge contribution i.e. 25% of the total population fall in this cluster and had lower value for SNS (35 ± 4.1). The cluster ‘G’ contained 15 genotypes and higher value for DM (139 ± 3.6) and SL (10.9 ± 1.15). Cluster ‘H’ contained 9 genotypes and higher value for BM (1.4 ± 0.2) and TN (94 ± 6.8). Cluster ‘I’ consist of 27 genotypes and had moderate mean values for all the traits.
Cluster mean and standard deviation for different agro-morphological traits

Note: *, **lowest and highest means respectively; Value in parenthesis indicates the number of genotypes in that cluster.
The mean coefficient of variation in the nine clusters exposed that maximum per cent of variation was observed in cluster ‘D’ (12.32%) tailed by cluster ‘B’ (11.17%), ‘H’ (9.15%), ‘E’ (8.87%), ‘F’ (8.68%), ‘I’ (8.62%), ‘G’ (8.51%), ‘A’ (8.33%), ‘C’ (7.55%) as compared to the complete set (9.24%).
Principal component analysis
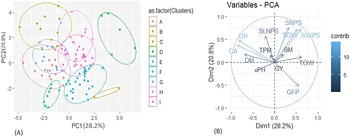
The correlation between PCA score and 14 agro-morphological traits was calculated. The first two PC axes accounted for 49.18% of the total variance. PCA 1 explained 28.29% of the total variance and positively correlated to traits DH, DA, DM, PH and SDW, while negatively correlated with SL, SNS, SDW, GFP, TGW, BM, SlPS, GY and TN. PCA 2 contributed to 20.89% of the total variation and depicted mainly positive correlation with traits DH, DA, DM, SL, SlPS, SNS, SWS and SDW. PCA 2 showed a negative association with GFP and TGW only (Fig. 1(B)).
(A) Scatter plot of 120 genotypes using PC1 and PC2 score. (B) Variable correlation plot.

A Scatter plot between PC1 and PC2 depicted a pattern of genotypes in the factor plane and plotted distinct nine clusters in the present study (Fig. 1(A)). Relationship between all the traits using traits correlation plot is depicted in Fig. 1(B). The traits were superimposed on a principal component plot as vectors (Fig. 1(B)); the relative length of the vector represents the relative rate of variation in each represented variable.
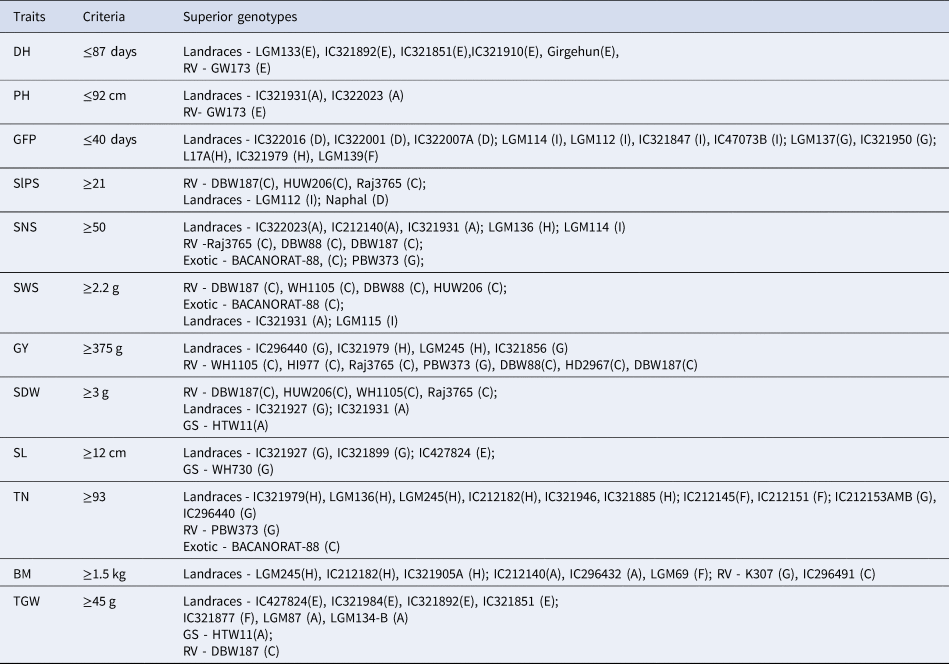
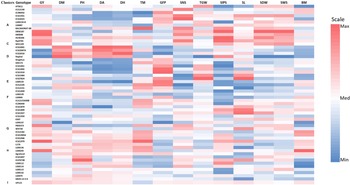
The present study helped in identifying the superior genotypes for different traits (Table 4). For example, landraces LGM133, IC321892, IC321851, IC321910 and Girgehun taken less than 87days for DH. The released variety DBW187 was found superior for SlPS, SNS, SWS, SDW, TGW, GY. A landrace IC321931 had various desirable attributes such as PH, SNS, SDW and SWS. Majority of superior genotypes for GFP, BM, TN and TGW are landraces. A heatmap of agro-morphological traits of the superior genotypes was constructed and revealed the level of diversity in superior genotypes. The colour richness related to diversity in different clusters (Fig. 2).
Superior wheat genotypes identified for different agro-morphological traits

Note: Value in parenthesis indicates the cluster number.
RV, Released variety; GS, Registered Genetic Stock.
Heat map of superior genotypes identified for various traits.

The mean values of 120 for 14 traits along with passport data are given in supplementary table S1.
Discussion
The highly significant differences was observed for genotypes for all the studied traits in ANOVA indicate that there is wide variability exist in studied traits broadly and further suggest the ample scope of genetic manipulation. Further, the landraces are an important genetic material as they are the product of natural selection by domestication carried out by farmers over the century (Al Lawati et al., Reference Al Lawati, Nadaf, Al Saady, Al Hinai, Almamari, Al Adawi, Al Hinai and Al Maawali2021). They can easily adapt to adverse biotic and abiotic pressure. Large number of landraces of wheat was collected from 13 states (Andhra Pradesh, Arunachal Pradesh, Assam, Gujarat, Himachal Pradesh, Jammu and Kashmir, Karnataka, M.P., Maharashtra, Rajasthan, Sikkim, Tamil Nadu and Uttarakhand) in India (Panwar et al., Reference Panwar, Bhatt, Dhariwal, Pandey and Jacob2014). However, landraces have been replaced by improved varieties and no longer being cultivated in states like Punjab, Haryana and western U.P. This can be evident from the passport data of the studied material that among the indigenous collection, none of the landraces have been collected from states like Haryana, Punjab and western Uttar Pradesh. Similar trend was also reported from Greece, where 95% landraces were replaced by high yielding varieties (Rufo et al., Reference Rufo, Alvaro, Royo and Soriano2019). Landraces are widely used by international organization like CIMMYT and ICARDA for increasing the allelic diversity in wheat. During the past two decades advances in research techniques such as molecular techniques, geographical information system and information and communication technologies have given new insights into the utilization of genetic diversity, which can further facilitate the widening of the genetic base of wheat.
This cluster analysis indicates a considerable amount of genetic diversity present in the studied germplasm and can be used for classifying the genotypes. The cluster analysis confiscates genotypes into clusters which exhibit intra-cluster homogeneity and inter-cluster heterogeneity. Cluster ‘C’ having nine genotypes mainly comprised of released varieties with higher values for yield, Dotlačil et al., (Reference Dotlačil, Hermuth, Stehno and Manev2000) also reported one cluster was represented by checks, while studying the European winter wheat landraces. It is evident from the results that Cluster D is the most diverse cluster than others and comprised of wheat landraces collected from Uttarakhand. In Uttarakhand, wheat is cultivated under diverse agroecological situation (valley, mid hills, higher hills, rainfed, irrigated, early sown, timely sown etc.) and generally have longer vegetative growth period, relatively shorter grain filling period, and tall (Gupta and Kant, Reference Gupta and Kant2012). This is in conformity with finding of present work that cluster D is characterized by higher value for days to heading, PH and minimum period for grain filling. Among the two landraces in cluster B, Kapargaon is T. sphaerococcum (Indian Dwarf wheat). The T. sphaerococcum species is distinguished from other wheat species by dwarf PH, small ear and semi-spherical wheat. In the present study also cluster B is characterized by dwarf PH and small ears. The archaeological remains recovered from historical site suggest that dwarf wheat is cultivated in Indian sub-continent during the period 2400-1750BC (Mittre, Reference Mittre and Hutchinson1974). T. sphaerococcum is no longer being cultivated in their native habitat but still being cultivated at 3–4 locations in Karnataka (Mori et al., Reference Mori, Ohta, Chiba, Takagi, Niimi, Shinde and Osada2013). It is evident from the results that Cluster E and G comprised of early maturing landraces collected from M.P. and Gujarat with higher value for grain filling period. Mohan et al., (Reference Mohan, Nagarajan, Singh and Shoran2001) reported that the late sown but early maturing varieties are in great demand in central zone. The central zone encompasses MP and Gujarat states, and is considered as hot spot locations for heat stress in India (Roy and Poddar, Reference Roy and Poddar2022). The agro-ecological zone with recurrence stress factors tends to exhibit more homogenous genotypes and less degree of variation. Thus, the less value for intra cluster distance in cluster E and G may be due to recurrence of heat stress in M.P. and Gujarat during grain filling stage is common phenomenon. The wheat landraces evolved in hill ecosystem (cluster D) is considered too diverse from plain. The distance is so large that they formed separate diverse cluster. All modification occurring in crop plant during the course of evolution is dependent on selection pressure (Hammer, Reference Hammer2003). The selection pressure practiced in hills is based on maturity and height while farmers in plain selected the genotypes having more grain filling duration coupled with early maturity.
The cluster H and I contained landraces mainly collected from Madhya Pradesh, Gujarat, Rajasthan, Andhra Pradesh and North Eastern region of India. Cluster analysis did not group the landraces of same origin but grouped landraces together with greater agro-morphological similarity (Gebremariam et al., Reference Gebremariam, Alamirew and Gebreselassie2022). Cluster analysis grouped different landraces together irrespective of origin indicating that geographical isolation may not be only factor causing diversity. The other factors responsible for such diversity are free flow of germplasm from one place to another (Verma and Mehta, Reference Verma and Mehta1976) genetic architecture of genotypes and climatic variability (Sharma and Hore, Reference Sharma and Hore1997).
The cumulative variance of 49.18% by first two principal component axes demonstrates that germplasm from each area has their own divergence and grouped separately. The independent grouping of all the accessions was due to variation among genotypes for different traits. Scatter plots separated different clusters in the present study and allowed natural clustering of wheat germplasm. Accordingly, the PCA and cluster analysis can be properly used for the clustering of wheat germplasm (Kraic et al., Reference Kraic, Mocák, Roháčik and Sokolovičová2009). Thus, PCA-based cluster analyses indicate the difference more precisely among wheat germplasm rather than cluster analyses not based on PCA. The largest contribution to the total variation at each axis of differentiation is reflected by PCA. When data from all the traits were subjected to PCA, out of 10 only four principal component axes (PCA) had an Eigen value more than 1 and cumulatively explained 70.01% of the entire variability among genotypes, which gives a clear idea of structure underlying the variables analysed. According to Chahal and Gosal (Reference Chahal and Gosal2002), traits with the largest absolute value closer to unity within the first PC influence the clustering more than others that are closer to zero. Our results are in conformity with results reported by Gebremariam et al., Reference Gebremariam, Alamirew and Gebreselassie2022, Poudel et al., Reference Poudel, Finnie and Rose2019 that first four PCs contributed nearly 72–76% of the total variation and had Eigen value more than unity among the wheat genotypes. The positive and negative correlation has been shown by positive and negative loading between the genotypes and traits. The trait which loads high value contributed more to the diversity. The significant positive correlation of PC1 with DH, DA, DM and PH was also reported by (Poudel et al., Reference Poudel, Thapa and Sapkota2017). The DH, DA, DM, SL, SlPS, SNS, SWS and SDW were the major traits of PC2 axis, hence, contributed more to diversity.
PCA method has been used by Wani et al. (Reference Wani, Sheikh, Najeeb, Iqbal, Kordrostami, Parray and Jeberson2018) for selection purposes in terms of different traits for example grain yield, quality parameters etc. Based on their characteristics using multivariate statistical tools could help in selecting them based on graphical plots i.e. 2-D and 3-D diagrams. In the present studies, a principal component scatter plot of 120 wheat genotypes depicts that the genotypes which are close together are perceived as being similar when rated on the fourteen variables (Fig. 1(A)) and genotypes that are further at a distance are more diverse as explained by (Hussain et al., Reference Hussain, Wahid, Zubair, Babar and Wahid2014). When the vector value of the traits was superimposed on PC plot (Fig. 1(B)) DH & DA, SDW & SWS have a close angle between them representing a positive correlation. Trait DH and DA was opposite to GFP showing a negative correlation. The angles are clear enough to draw a diagram of the correlation between the various indexes (Hussain et al., Reference Hussain, Wahid, Zubair, Babar and Wahid2014). From Fig. 1(B), it can be depicted that traits DH, DA, DM and PH contributed more to PC1 and trait GFP to PC2. The information obtained from this study can be used to plan crosses and maximized the use of genetic diversity and expression of traits as explained by Ahmad et al. (Reference Ahmad, Shahzad, Iqbal, Asif and Hirani2013).
From the present study, a number of superior genotypes were identified for different traits. There were number of wheat landraces, which were early in DH, these landraces could be considered as adapted strategy for development of early maturing, climate resilient wheat varieties. In most cases, the superior genotypes for GFP, BM, TN and TGW were landraces. Alipour and Abdi (Reference Alipour and Abdi2020) also reported that landraces possess higher variation for BM and TGW. In comparison to released varieties, landraces were having more PH. Tall type indigenous wheat was also reported by Adhikari et al. (Reference Adhikari, Kumari, Jacob, Prasad, Gangwar, Lata, Thakur, Singh, Bansal, Kumar, Bhardwaj and Kumar2022). GFP is an important parameter for temperature and drought tolerance and number of superior landraces of wheat were identified for less GFP. DBW187- a PAN India mega wheat for India released for three zones (NWPZ, NEPZ and CZ) has majority of desirable attributes. The Department of Agriculture and Cooperation got maximum breeder seed production indent of this variety during 2022–2023 (Singh et al., Reference Singh, Tiwari, Tyagi, Gupta, Kumar, Khan, Gupta, Sharma, Mishra, Kumar, Singh, Mamrutha, Kamble, Verma and Singh2022). Due to higher yield potential of released varieties, landraces are being replaced more rapidly from their area of cultivation. The released varieties exhibited superiority for grain yield over land landraces, while the landraces had higher values for TN, BM and TGW. Thus, for the improvement in TGW in released varieties, the hybridization between superior landraces for TGW from cluster E and released wheat varieties from cluster C could give desirable segregates.
The contribution of various characters toward the expression of divergence should be taken into account and analysis of the diversity of germplasm collections could be utilized for specific breeding goals. It is further suggested that multivariate methods can identify different parents, with the scope to generate transcendental segregates for future breeding strategies to improve wheat yields.
Supplementary material
The supplementary material for this article can be found at https://doi.org/10.1017/S1479262123000461.
Conflict of interest
The authors declare that they have no conflict of interest.