I. INTRODUCTION
A common technique for measuring elastic and plastic properties of bulk materials and thin films at a submicron level is instrumented nanoindentation in which the force–displacement (P–h) curves are continuously recorded throughout the experiment and analytical models are applied to extract the required properties. This technique is particularly relevant for thin films where standard mechanical property testing is not possible. One property measured using instrumented nanoindentation is the hardness (H), which is defined as the indentation force divided by the contact area, measured as the projected area of the imprint after unloading. In the conventional indentation tests, the contact area can be directly measured from the residual impression left after unloading. In nanoindentation tests, however, the size of the impression is too small to be measured directly and indirect methods are used instead. Field and Swain Reference Field and Swain1 developed a method for spherical indentation on bulk materials, which is based on the experimental load–displacement curve and indenter shape alone, without the need of measuring the impression area.
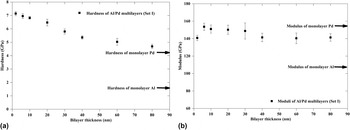
In recent times, multilayered films consisting of alternating nanometer thickness layers of two different metals (nanofilms) have demonstrated enhanced indentation hardness. Reference Barshilia and Rajam2–Reference Yashar and Sproul8 In general, this enhancement goes beyond the rule of mixtures and increases as the layer thickness decreases to a few nanometers, but there is conjecture regarding the exact mechanism of strengthening at the smallest length scale. Reference Dayal, Savvides and Hoffman4,Reference Li, Zhu, Tan, Wu and Zhang9–Reference Misra, Hirth and Hoagland11 In our previous work, Reference Dayal, Savvides and Hoffman4 indentation hardness and elastic modulus were measured for nanolayered Al/Pd thin films using a Berkovich indenter and the Oliver and Pharr's method. Reference Oliver and Pharr12 Enhancement of hardness of ∼350% was observed for a bilayer thickness of 2 nm compared to the hardness of pure Al films (Fig. 1). Reference Dayal, Savvides and Hoffman4
Reproduced from Ref. Reference Dayal, Savvides and Hoffman4. (a) Hardness as a function of the bilayer thickness of Al/Pd samples where the Al and Pd layers have equal thickness. The arrows show the hardness of 1 µm thick monolayers of Al and Pd; (b) modulus as a function of the bilayer thickness of Al/Pd samples where the Al and Pd layers have equal thickness. The arrows show the moduli of 1 µm thick monolayers of Al and Pd.

However, Oliver and Pharr's and Field and Swain's methods of hardness determination were intended for isotropic elastic–plastic monolithic materials and applying them to multilayered nanofilms consisting of alternating layers may not lead to accurate results. In multilayered thin film constructions, an additional effect can be caused by bending of layers of different stiffness. Elastic and plastic anisotropy further complicate the matter and create uncertainties in the hardness determination. Those uncertainties can be resolved by conducting finite element analysis (FEA) to simulate the indentation process, because it allows the anisotropic nature of the materials to be accounted for and the contact area to be determined to the required accuracy. Also, the phenomena of piling-up and sinking-in become evident and do not present any problem. Thus, the FEA is a good tool for assessing indentation hardness, provided that the mechanical properties of the constituent materials are determined beforehand.
The present study applied FEA to investigate the indentation behavior of Al/Pd nanolayers using a spherical indenter; for comparison, Al and Pd monolayers were also studied. The research aims at determining the dependence of indentation hardness on: (i) indentation depth, (ii) layer thickness and order, and (iii) the way the contact radius (a) is measured. The material properties of Al and Pd were ascertained using molecular dynamics (MD) simulations of extension of Al and Pd slabs, and indentation on Al, Pd, and Al/Pd slabs with a 4 nm spherical indenter. The material formulations of both Al and Pd used in the FEA simulations of indentation with a 100 nm spherical indenter were validated through FEA simulation of indentation with a 4 nm spherical indenter and comparison with the MD indentation. With the known material properties, a large number of FEA simulations were carried out, to achieve the aims listed above and ensure convergence of the results. In what follows, the MD simulations will be first presented, followed by the FEA simulations and the results. Special attention is paid to the determination of the contact radius since its values may influence the hardness estimation.
II. MD SIMULATIONS
A. Simulation procedure
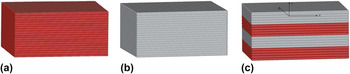
To simulate tension and nanoindentation with a 4 nm spherical indenter applying MD, the (111) slab models were constructed for the Al and Pd monolayers, and a four-layer model was constructed for the Al/Pd multilayer [Figs. 2(a)–2(c)]. The lengths of the slabs in the x- and y- directions were determined to fit the incommensurate nature of the Al and Pd lattice constants and to minimize the strains imposed on the interface due to lattice constant mismatch. Specifically, the dimensions are 240, 240, and 160 Å for the Al slab, and 233.4, 233.4, and 155.6 Å for the Pd slab in the x-, y-, and z-directions, respectively. The dimensions of the Al/Pd four-layer models are 280.7, 238.3, and 137.52 Å in the x-, y-, and z-directions, respectively. In the Al/Pd four-layer model, the thickness of the Al layer is 35.07 Å and that of the Pd layer is 33.69 Å, which results in a total height of 137.52 Å for the four-layer model. In the case of tensile loading, periodic boundary conditions were applied on the sides of the slabs in the direction of tension and sink conditions were applied on the other sides; therefore bulk material properties were obtained. This is different from extension of a single layer where beside the direction of tension, periodic boundary condition is also customary applied in the direction perpendicular to the tension in the plane. In the case of indentation loading, the boundary conditions are: periodic conditions in the plane (parallel to the surface) and sink condition out of plane (perpendicular to the surface).
Initial atomistic configurations of the (a) Al, (b) Pd (111) slabs, and (c) Al/Pd four-layer model used in the nanoindentation simulations. The red and gray circles represent the Al and Pd atoms, respectively.

In the MD simulations, the open source code LAMMPS was used. Reference Plimpton13
The accuracy of MD simulations is greatly dependent on the interatomic potential models. Reference Shen and Chen14 In this study, a newly developed long-range empirical potential (LREP) model with a cut-off distance larger than at least the fourth neighbor distance was adopted, to describe Al–Al, Pd–Pd, and Al–Pd interatomic interactions. The LREP is an extension of the Finnis–Sinclare potentials, Reference Finnis and Sinclare15 which has the same form as the embedded-atom-method Reference Daw and Baskes16 except that dissimilar elements can contribute differently to the total electron density at an atomic site. This method has been successfully applied to body-centered cubic (bcc), face-centered cubic (fcc), and hexagonal close-packed (hcp) metal systems, as well as to binary and ternary fcc metal systems. Reference Dai, Kong and Li17–Reference Li, Dai, Liang, Tai, Kong and Liu20 More details about the LREP models for Al–Al, Pd–Pd, and Al–Pd interatomic interactions can be found elsewhere. Reference Kong and Shen21
In the MD simulation of nanoindentation, the energy of the system was minimized using the conjugate gradient (CG) algorithm for the structure relaxation. The convergence tolerance for the energy minimization was set to 10−9, meaning that energy minimization stops when the energy change between two successive iterations divided by the energy magnitude is less than 10−9. After minimization, a sphere indenter of a radius of 40 Å with a contact stiffness of 246 eV/Å2 was indented into the specimen using a displacement controlled loading. A smaller contact stiffness of 24.6 eV/Å2 was also tested and the obtained force–displacement curve was found similar to that with the larger force constant. For the purpose of simulation efficiency, the contact stiffness of 246 eV/Å2 was used in the following nanoindentation simulations.
B. Simulation results
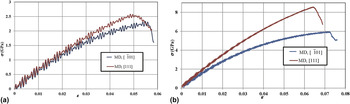
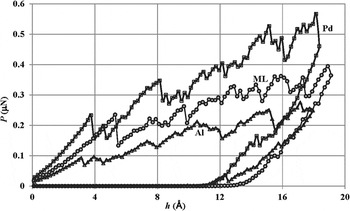
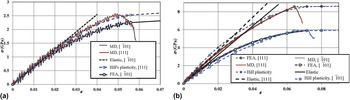
First, the stress–strain curves (σ–ε) of Al and Pd, as shown in Figs. 3(a) and 3(b), were obtained by stretching Al and Pd slabs in two directions in the MD simulations. Then, indentation was performed on the Al and Pd slabs and the Al/Pd four-layer model. It can be seen in Fig. 4 that during the entire loading process, the force–displacement curve of the Al/Pd four-layer model is located above that of the Al slab but below that of the Pd slab. It is also found that in the unloading process, the depths where the applied force becomes zero are 9.54, 10.34, and 11.09 Å for the Al slab, Pd slab, and Al/Pd four-layer model, respectively, implying that plastic deformation is much profound in the Al/Pd four-layer model so that the least elastic recovery can be obtained. In indentation, the hardness of a specimen can be estimated from the maximum applied force divided by the residual indent area after unloading. The simulated hardness values are 13.06, 25.07, and 16.46 GPa for the Al slab, the Pd slab, and the Al/Pd four-layer model, respectively. The simulations suggest that the hardness of Al/Pd multilayer is between those of Al and Pd monolayer, which is not consistent with the experiments with the Berkovich indenter, where the measured hardness of Al/Pd multilayer is higher than those of Al and Pd monolayers [Fig. 1(a)]. Reference Dayal, Savvides and Hoffman4 Also, the simulated hardness of Al/Pd multilayer and Al and Pd monolayers is much higher than the experimentally measured hardness values. Explanation for this discrepancy can be drawn from factors not considered in the present MD simulations—for example, solid phase transition processes at the interface between the layers during film deposition and different defects in the measured and simulated samples. Also, recent first-principles calculations of the Al/Pd interface energy suggest that the resulting intermetallics formed in the interface due to large negative enthalpy of mixing between Al and Pd can make huge positive contribution to the hardness enhancement of the Al/Pd thin film. Reference Kong and Shen22 It was also found that the interface between Al and Pd is transparent to dislocations, thus the image forces may also play some role.
Tensile stress–strain curve σ–ε of: (a) Al layer and (b) Pd layer.

Reaction force P on the indenter versus the penetration depth h of the indenter.

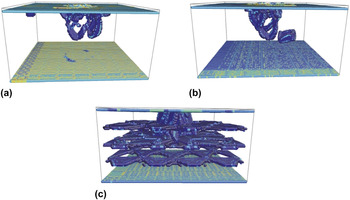
In the present simulation, due to the computational capability, defects such as vacancies, dislocations or grain boundaries were not introduced in the initial configuration. The atoms in the initial Al and Pd slabs and Al/Pd four-layer model were perfectly in their fcc crystalline position. After minimization, due to the mismatch between the lattice constants of Al and Pd, some dislocations will raise in the interface of the Al/Pd four-layer model. The different amount of the defects which leads to the discrepancy between the calculated and measured hardness values can be clearly observed from the atomistic configurations in nanoindentation. Snapshots of the atomistic configurations corresponding to similar penetration depths of 17.14, 17.15, and 17.09 Å for the Al and Pd slabs and the Al/Pd four-layer model are shown in Figs. 5(a)–5(c). The atoms are colored according to their centro-symmetry parameter values and only atoms away from their perfect fcc positions are shown. The dislocation loops can be clearly seen in the figures. A noticeable phenomenon in the Al/Pd four-layer model is that the amount of dislocations formed during the nanoindentation is much larger than that in the Al and Pd slabs. Moreover, the generated dislocations are networked in the Al/Pd four-layer model. It can be found in the Al/Pd four-layer model that all dislocations nucleated under nanoindentation are confined in the first Pd and second Al layers, and there are no new dislocations formed in the third Pd and fourth Al layers except for the initial dislocations in the interface due to lattice constant mismatch. It is known that hardness is conventionally regarded as the resistance to plastic deformation and its value is limited by the smallest resistance to plastic deformation. Since there are a large amount of defects in the measured samples, the calculated hardness from the present nanoindentation simulations cannot be directly compared with the measured one. Instead, the calculated values give the upper bound to the hardness values.
Snapshots of the atomistic configurations of the (a) Al, (b) Pd (111) slabs, and (c) Al/Pd four-layer model under nanoindentation. The penetration depths are 17.14, 17.15, and 17.09 Å for the Al and Pd slabs and Al/Pd four-layer model, respectively. Atoms are colored according to their centro-symmetry parameter values and are not shown if they are in perfect fcc lattices. The dislocation loops are clearly seen.

III. MATERIAL PROPERTIES OF Al AND Pd
In the present study, the Young's modulus (E) and yield stress (σy) of bulk Al and Pd were derived from the MD simulations of tension [Figs. 6(a) and 6(b)]. The tensile σ–ε curves were fitted with smooth curves and the Young's moduli and yield strengths were determined in two directions, that is in the plane of the film and perpendicular to it. It appears that both Al and Pd are stiffer and stronger in the transverse direction than in the plane of the films. The properties of Al are: in the plane of the film E = 63.6 GPa and σy = 2.3 GPa, and perpendicular to it E = 71.9 GPa and σy = 2.6 GPa. Pd appears stronger and stiffer: in the plane of the film E = 160.3 GPa and σy = 5.9 GPa, and perpendicular to it E = 184.4 GPa and σy = 8.6 GPa. A material formulation capable of accounting for directional yield strength is the Hill's plasticity material model, according to which one direction is assumed as the reference direction and the properties in the other direction are scaled by a constant. The reference direction here was chosen to be the
 $\left[ {\bar 101} \right]$
direction and the stress values in the [111] direction were scaled 1.12 and 1.45 times for Al and Pd, respectively. For both materials, the Poisson's ratio was chosen to be 0.3, which is a common value for metals. It can be seen in Figs. 6(a) and 6(b) that after the peak point, the stresses in the MD simulations decrease with the decrease in the strain while they slightly increase in the FEA simulations. This is so because the material model in the FEA simulations cannot accept softening, for which reason a small tangent modulus was introduced.
Tensile stress–strain curves σ–ε used in the FEA simulations: (a) Al and (b) Pd.

IV. VALIDATION OF THE MATERIAL FORMULATION USING FEA
Validation of the material properties of Al and Pd and the material formulation of Hill's plasticity was performed by comparing the results of indentation on Al and Pd monolayers and the Al/Pd four-layer film carried out with MD, as detailed above and illustrated in Fig. 4, and FEA software. The FEA model was developed using the general purpose software ANSYS: the size of the Al monolayer was taken to be 16 × 24 nm and the size of the Pd monolayer was taken to be 15.56 × 23.34 nm; the spherical indenter was of 4 nm radius; the multilayered film consisted of two Al layers each of them 3.4 nm thick and two Pd layers each of them 3.5 nm thick, the length of the multilayered film was 23.34 nm.
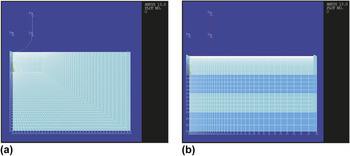
The assumption that Al and Pd are transversely isotropic in the film plane simplified the simulations and reduced the 3D problem of indentation to an axisymmetric problem. Thus, only half of the film cross-section was modeled and the indenter was simulated as one line and hence assumed to be rigid. The cross-section was meshed with a mapped mesh of 2D quadrilateral elements—the areas of Al and Pd were meshed with 2D four-node linear structural solid elements (PLANE 182) having axisymmetric stress behavior, and the indenter was modeled with 2D rigid target elements (TARGET169). The contact between the indenter and the solid was modeled with 2D contact elements (CONTA171). The friction coefficient at the contact was assumed negligible, at 0.04. Fixed translational boundary conditions were imposed the bottom and on the sides of the films. In the multilayered film, the interface between the Al and Pd nanolayers was assumed perfect. Figures 7(a) and 7(b) show the FEA models of the monolayered and multilayered films. 4842 elements were used to simulate the Al and Pd monolayers [Fig. 7(a)] with the smallest element being 0.69 × 0.46 (Å) and 5242 elements were used to simulate the four-layered Al/Pd film [Fig. 7(b)] with the smallest element being 0.67 × 0.098 (Å).
The FEA model in indentation on MD specimens of: (a) Al (Pd) monolayers and (b) Al/Pd multilayers.

The indentation loading was imposed in terms of a vertical displacement applied on the indenter downward. On unloading, the indenter was moved upward until the contact was lost, which corresponds to a contact force of zero. The indentation force was determined as the reaction force on the rigid indenter. The maximum indentation depth imposed on the specimens was 2 nm in the Pd monolayer and Al/Pd multilayer, and 1.9 nm in the Al monolayer. A large number of loading steps were specified, in both loading and unloading, to obtain smooth P–h curves.
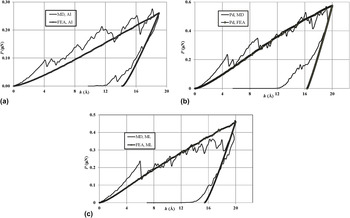
The P–h curves from the FEA simulations were compared with those from the MD simulations and were found to closely fit, which validates the material properties and the material formulation [Figs. 8(a)–8(c)]. Noticeably, the MD simulations of indentation of the multilayer predict softening at deep indentations while the FEA hardening. A possible explanation is the material formulation in the FEA model, which cannot resemble softening, as mentioned above in Sec. III.
P–h curves in indentation simulated using MD and FEA on: (a) Al monolayer, (b) Pd monolayer, and (c) Al/Pd multilayer.

V. FEA ON Al AND Pd MONOLAYERS, AND ON Al/Pd MULTILAYERS
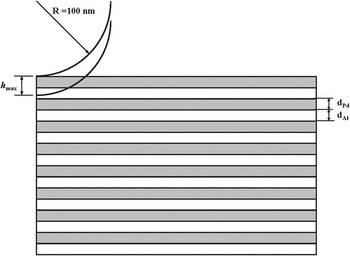
With the validated material properties of Al and Pd, indentation could be simulated on Al and Pd monolayers and Al/Pd multilayers of a geometry used for experimental nanoindentation. Thus, the effect of indenter shape and indentation depth on the hardness values can be ascertained and compared with experiments. A large number of FEA simulations were carried out with a spherical indenter of 100 nm radius—the estimated tip radius of a diamond Berkovich indenter. The thickness of the Al and Pd monolayers was chosen as 500 nm, sufficiently large to avoid any boundary effects. The layer thickness in the multilayered films was varied from 2.25 to 43 nm. The maximum indentation depth (h max) was varied from 3 to 54 nm, to cater for a large range of shallow, intermediate, and deep indentations. It is a practical rule of thumb that h max should be less than 10% of the total film thickness to minimize the substrate effect on the measured mechanical properties. The present study imposed a more stringent rule—the stresses at the boundaries were outputted and when any boundary effect was noticed, the film thickness was increased. The width of the films was also checked against the stresses at the boundary and increased when required. An additional requirement for the multilayered films is that h max should be greater than the thickness of one layer, to account for the multilayered nature of the film. In this study, h max was set to at least 1.25 times the layer thickness (Fig. 9). For all those reasons, and to decrease the computer time required in the simulations, the size of the FEA models varied with h max. The FEA models were simplified to axisymmetric and the same element types were used as in the FEA study in Sec. IV. The convergence of the FEA results was checked by carrying out simulations on models with different element sizes.
Schematic of a multilayered film indented with a spherical indenter.

The present study sought to answer the following questions “how is indentation hardness influenced by: (i) layer order, (ii) layer thickness, (iii) indentation depth, and (iv) the way the contact radius is measured?” Although most of the FEA simulations were carried out for multilayers having Pd as the top layer and Al as the bottom layer, to answer question (i), some simulations were performed with the inverse order—Al was placed at the top and Pd at the bottom. To answer question (ii), multilayered films of various layer thickness were studied, i.e., 2.25, 3.75, 5.5, 7.5, 10, 14, 15, 20, 25, 29, 36, 39, and 43 nm. Question (iii) above was answered by indenting the films to various depths, spanning from 3 to 54 nm. To reveal if hardness at a particular depth was layer-thickness dependent, some simulations were conducted for two or three different film structures, at the same maximum indentation depth. For example, the h max of 18.75 nm was achieved in two ways—by indenting a multilayer of a layer thickness d = 7.5 nm to h max = 2.5 × d and by indenting a multilayer of d = 10 nm thick layers to a depth of h max =1.875 × d. An additional consideration was the number of the layers—a sufficient number of layers were taken to avoid any boundary effect: 12, 16, 24, 28, 32, and 48 layers. Apart from Al/Pd multilayered films, Al and Pd monolayers were also indented to the same h max. Question (iv) above was answered by determining the contact radius in three ways, that is, (i) by Field and Swain's formula, (ii) at the point of inflection of the imprint at the maximum indentation depth, and (iii) at the point of inflection of the imprint after unloading.
It needs to be noted that, although care was taken to ensure computational accuracy of the results, the main objective of the study was not the accuracy of the hardness determination but rather qualitative outcomes. Also, the material properties of Pd and Al were extracted from MD simulations and may not necessarily be the material properties of experimentally deposited films. It is well recognized that the elastic modulus is essentially scale-independent; however, the material strength at the nanoscale is significantly higher than the one at the macroscale. Nevertheless, using MD to provide information which otherwise is unavailable at the macroscale proves a valuable tool in obtaining a deeper insight into the material behavior of thin films.
VI. RESULTS
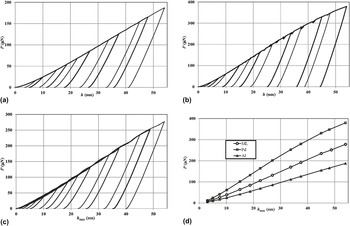
The indentation force–displacement curves for the Al and Pd monolayers and the Al/Pd multilayers are shown in Figs. 10(a)–10(c). The maximum indentation forces in Figs. 10(a)–10(c) are also plotted versus the maximum indention depths h max [Fig. 10(d)]. Nevertheless, caution needs to be applied when using the results at the shallowest indentation depth, which are based on the 2.25 nm Al and Pd films. The MD simulations provided bulk material properties for specimens as thick as 3.37 nm (Pd) and 3.51 nm (Al) and size effects at the smaller scale were not considered.
P–h curve in indentation with a spherical indenter of radius 100 nm on (a) Al monolayered film, (b) Pd monolayered film, (c) Al/Pd multilayered film, and (d) comparison between maximum indentation forces.

It is clearly seen in Fig. 10(d) that the Pd monolayer provides the greatest resistance to indentation, followed by the multilayered film, and the Al monolayer resists least. The increase of P with h max is close to linear for all the film structures. Several FEA simulations were also conducted for the multilayered film in a reverse order of the layers, at a shallow, intermediate, and deep indentation. The result was that the P–h curves did not change—apparently, the layer order has no influence on the P–h curves, and, therefore, on the hardness. Additional FEA simulations were performed on films of different thicknesses to the same maximum indentation depth h max. It was established that the P–h curves, and thus hardness, are independent of the layer thickness. Therefore, films of alternating layers can be characterized only by the materials of the films, provided that the layer thickness is the same for both materials. However, no investigation was made on the effect of different layer thickness of Al and Pd.
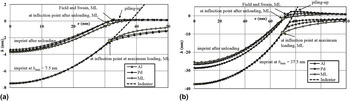
Comparison between the deformations of the three types of films shows that in loading to a shallow depth, the multilayered film deforms least, due to the effect of bending of the layers, and the Pd monolayer most owing to its rigidly plastic behavior [Fig. 11(a)]. Upon complete unloading, piling up appears slightly more significant in the Al and Pd films than in the multilayers. The residual indentation depth appears the deepest in the multilayers, followed by the Pd monolayer, and the Al monolayer recovers most thus leaving the shallowest residual mark—Fig. 11(a) illustrates the above relationships. However, the behavior is somewhat different for deeper indentations [Fig. 11(b)]. In loading, the multilayers deform most, followed by the Al monolayer, and the Pd monolayer deforms least. The multilayered film leaves the shallowest indentation mark, followed by the Al monolayer, and the deepest imprint is established in the Pd monolayer. The Pd monolayer piles up most while the multilayers sink in.
Comparison between imprints: (a) at h max = 7.5 nm and (b) at h max = 37.5 nm.

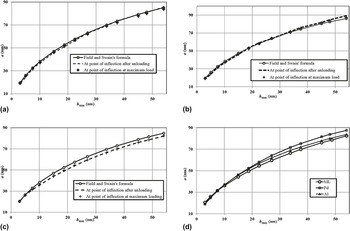
In this study, it is of interest to elucidate the difference between the imprint radius at the maximum indentation depth and on unloading [Figs. 12(a)–12(c)]. The comparison showed that the points of inflection of the imprint at the maximum indentation depth and after unloading provide almost identical radii. Also, Field and Swain's formula overestimates the contact radius a by no more than 3% in the Al monolayer, 6% for the Pd monolayer in deep indentations, and 6% for the multilayers. The values of a appear largest for the Pd monolayer and smallest for the multilayers [Fig. 12(d)].
Contact radius a versus indentation depth: (a) Al monolayered film, (b) Pd monolayered film, (c) Al/Pd multilayered films, and (d) comparison between a at the point of inflection in loading, for the three film structures.

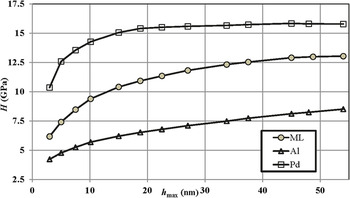
The small difference of a in the way it is measured is reflected in the small difference in the hardness values—Field and Swain's formula underestimates the hardness (H) by no more than 6% for the Al monolayer, 10% for the Pd monolayer, and 12% for the multilayers. It is obvious that the indentation hardness increases with the indentation depth, at a higher rate for shallow indentations (Fig. 13). This dependence of H on h is in contrast to indentation with, for example, a Berkovich indenter where H is independent on the indentation depth owing to the specific area of the indenter tip. Nevertheless, H in this study tends to a constant value at deep indentations. Comparison between the hardness values shows that H for the multilayers is higher than for the Al monolayer by up to 40% and lower than for the Pd monolayer by up to 70%.
Comparison between indentation hardness of the three film structures; the contact radius is taken at the point of inflection in loading.

It should be clarified that since the FEA simulations are based on the σ–ε curves for bulk Al and Pd obtained by MD simulations of tension of large specimens, the flow stress is independent of the layer thickness. A more realistic material formulation should consider the size effect, which will be the focus of future studies.
VII. CONCLUSIONS
This study investigated the hardness with a spherical indenter in Al/Pd multilayered films compared to Al and Pd monolayers. It was found that:
-
(1) the layer order, number of layers, and layer thickness have no effect on the hardness values of the multilayers;
-
(2) the indentation hardness in all film constructions increases with increasing depth and tends to a constant value at very deep indentations;
-
(3) among the three constructions, the Pd monolayers are the hardest while the Al monolayers the softest;
-
(4) no enhancement in hardness values was found in very thin multilayered films, as established for very thin multilayers when indented with a Berkovich indenter. Reference Dayal, Savvides and Hoffman4 Thus, the latter phenomenon cannot be explained with stress analysis alone if bulk material properties of Al and Pd are considered in the FEA model. The MD simulations also cannot provide such explanation if only the effect of a free surface and interface between layers are considered.
Therefore, future research on Al/Pd multilayers needs to reflect factors such as defects in the layers during film deposition, dislocations and grain boundaries, as well as the resulting intermetallics formed in the interface due to large negative enthalpy of mixing between Al and Pd.
ACKNOWLEDGMENT
The authors gratefully acknowledge the support they received from the ARC Centre of Excellence for Design in Light Metals. All the MD simulations were carried out on the supercomputers in NCI National Facilities in Australia.