Implications
The chemical composition of pig carcasses is an important aspect of quality and economic value, and the differences between sex types should be explored. The use of immunocastrated males is increasing in some countries, although their composition and growth development have not yet been completely defined. This paper shows the ability of computed tomography to measure the carcass chemical composition in vivo and postmortem in a non-invasive and accurate way. It also provides useful information on the influence of a pig’s sexual condition on the chemical components and their development, which could help producers to optimize pig profitability.
Introduction
The main chemical constituents in the pig carcass are moisture, protein, fat and ash. Of these, protein and fat are essential parameters in pig growth models (de Lange et al., Reference de Lange, Morel and Birkett2003). These models can be used in pig production systems to predict daily essential amino acid and energy intake requirements, and also the carcass muscle and fat tissue (Schinckel et al., Reference Schinckel, Mahan, Wiseman and Einstein2008). Calcium and P are essential nutrients that play a major role in the development and maintenance of the skeletal system. Consequently, modelling the change of the chemical composition during growth will provide useful information on the nutritional requirements, skeletal system development, growth efficiency and carcass and cut value.
Previous studies have reported differences among boars, gilts and barrows in the growth of chemical components (Schinckel et al., Reference Schinckel, Mahan, Wiseman and Einstein2008; Arthur et al., Reference Arthur, Barchia, Giles and Eamens2011). The use of immunocastrated males is increasing in some countries as an alternative to surgical castration, although the chemical composition and growth of this type of male have not yet been completely explored.
Chemical composition has been traditionally assessed by grinding the entire carcass and conducting analyses in the laboratory. These procedures are accurate but laborious, expensive and time-consuming, and they also require the slaughter of the animal. Computed tomography (CT) is a non-invasive technology that is based on the attenuation of X-rays as they pass through body tissues. Previous studies have proven that CT is a suitable method to estimate body composition in live pigs (Szabo et al., Reference Szabo, Babinszky, Verstegen, Vangen, Jansman and Kanis1999; Font-i-Furnols et al., Reference Font i Furnols, Teran and Gispert2015) and carcasses (Font i Furnols et al., Reference Font-i-Furnols, Carabús, Pomar and Gispert2009). Szabo et al. (Reference Szabo, Babinszky, Verstegen, Vangen, Jansman and Kanis1999) and Arthur et al. (Reference Arthur, Barchia, Giles and Eamens2011) showed the potential of this technology to measure the main chemical body components, but information on the relationship between CT and chemical composition is still limited. Moreover, to our knowledge, there are no studies focused on predicting specific mineral components.
Therefore, the aims of this study were (1) to evaluate the ability of CT to predict the chemical composition of live pigs and carcasses, (2) to compare the chemical composition of four different sex types at a commercial slaughter weight and (3) to model and evaluate the chemical component growth of these four sex types.
Material and methods
Animals and experimental design
This study was carried out with 92 animals from 24 litters, all with the same genetic origin (Pietrain×(Landrace×Duroc)), from four different sex types (one pig of each sex/litter): 24 entire males (EM), 24 surgically castrated males (CM), 20 immunocastrated males (IM) and 24 females (FE). The animals were reared at the IRTA-Monells experimental farm and were fed ad libitum with a commercial diet. The immunocastration vaccine Improvac® (Zoetis, Spain) was injected twice (at 12 weeks of age and 5 weeks before slaughter).
Of these 92 pigs, 48 (12 per sex) were scanned in vivo at four different target BWs: 30, 70, 100 and 120 kg. After the last scanning at 120 kg, they were slaughtered. This group of animals was considered to be the monitoring group. The remaining 44 pigs were scanned in vivo and slaughtered immediately after scanning. In that case, 12 pigs were scanned and slaughtered at 30 kg (4 EM, 4 CM and 4 FE), and 16 pigs each at 70 kg and 100 kg target BW (4 EM, 4 CM, 4 IM and 4 FE). There were no immunocastrated males at 30 kg because the vaccine had not yet been injected.
CT scanning and slaughtering
The animals were fasted for a minimum of 8 h and anaesthetized prior the procedure (by intramuscular injection of azaperone at 0.1 mg/kg and ketamine at 0.2 mg/kg, and intravenous injection of propofol at 0.2 mg/kg only at 100 and 120 kg target BW). The in vivo CT scanning procedure is described in detail by Font-i-Furnols et al. (Reference Font i Furnols, Teran and Gispert2015). Then, they were scanned with a General Electric HiSpeed Zx/I tomograph (GE Healthcare, Madrid, Spain) located at the IRTA-Monells facilities. The instrument settings were: 140 kV, 145 mA, axial (1 s), 7-mm thick at 30 kg and 10-mm thick at 70, 100 and 120 kg target BW. The IRTA’s ethical committee approved the procedure.
After scanning, the animals from the monitoring group were returned to the experimental farm, while animals from the other group were slaughtered. The experiment concluded when the monitoring group animals were scanned and slaughtered at 120 kg target BW. Meat of both groups was discarded because anaesthesia was used. Slaughtering was carried out following standard procedures at the IRTA-Monells slaughterhouse. The carcasses were kept for 24 h postmortem at 2°C. The left side of each carcass was prepared and scanned with the CT equipment. The acquisition parameters were the same as those used for the live animals, except that the images were acquired helically (1 pitch) (Font-i-Furnols et al., Reference Font-i-Furnols, Carabús, Pomar and Gispert2009). The right carcasses were stored at −20°C until the mincing process.
Image analysis
The images were obtained in the DICOM format, and they were imported and analysed using Matlab software (version R2008b; The MathWorksTM Inc., Natick, MA, USA). A specific program was developed to obtain the frequency of the voxels associated with each Hounsfield unit (HU) within the range from −1100 to +1400 HU. Viscera were not removed from the images because the correlation of volumes from images with and without viscera is high (R 2=0.99). Then, the voxels were transformed into volume to homogenize the data using the DFOV value, matrix size and image thickness as described by Font i Furnols et al. (Reference Font-i-Furnols, Carabús, Pomar and Gispert2009).
Carcass chemical analysis
The right side of each carcass (n=92) was used for the chemical composition analysis. First, the frozen carcasses were reduced into small pieces using a cutting guillotine (Model D, Spain). The teeth were removed during this step. Then, the different pieces were gradually placed in an industrial mincer (Grinder Cato-pa160, Spain). After mincing and homogenization, the samples were vacuum-packed and stored at −20°C.
The determination of the protein content was based on the Kjeldahl total nitrogen content using a nitrogen/protein analyser (Büchi Distillation Unit B-324 and Digester Unit B-414, Flawil, Switzerland). The fat content was determined by solvent extraction with petroleum ether (Soxtec 2050, Tecator, Höganäs, Sweden). The moisture content was determined by sample drying in an oven at 100°C to 105°C until constant weight. The determination of the ash content was performed by heating the sample in a muffle oven at 550°C for 2 to 3 h. Finally, the Ca and P content were determined by inductively coupled plasma-optical emission spectroscopy (ICP-OES; spectrophotometer Optima 4300 DV, Perkin Elmer Inc., Wellesley, MA, USA). The sample was previously mineralized in a microwave (MARSXpress, CEM, Matthews, NC, USA).
Statistical analysis
The prediction equations of the chemical composition were developed using SAS software (version 9.2; SAS Institute Inc., Cary, NC, USA) from live pig and carcass images, separately. Partial least square regression was applied to obtain the prediction equations for the chemical components. Cross-validation was used to select the optimal number of partial least square factors. The variables used in the models were volumes associated with attenuation HU values. Initially, the range was −149 to +140 HU for the live animals and −100 to +120 HU for the carcasses, according to previous studies carried out on live pigs (Font-i-Furnols et al., Reference Font i Furnols, Teran and Gispert2015) and on carcasses (Font-i-Furnols et al., Reference Font-i-Furnols, Carabús, Pomar and Gispert2009). The ranges were extended to +411 HU for the prediction of ash, Ca and P to include part of the bone region. The root mean square error of prediction (RMSEPCV) was obtained by leave-one-out cross-validation using the macro presented by Causeur et al. (Reference Causeur, Daumas, Dhorne, Engel, Font i Furnols and Højsgaard2003).
The allometric growth of the chemical components in relation to BW was modelled using the power function originally described by Snell in 1891 and extended later by Huxley and Teissier in the 1920s and 1930s (Gould, Reference Gould1971):
 $$Y=aX^{b} $$
its logarithmic transformation was applied for the calculations as follows:
 $$\log Y=\log a{\rm {\plus}}b{\times}\log X$$
where Y is the weight of the tissue, X is the BW, a is a constant, and b is the allometric growth coefficient that describes the relationship between the two tissues. The growth parameters, a and b, were estimated using a PROC GLM procedure with SAS software for each animal.
Bayesian inference was used to study the differences between sex types for the carcass chemical composition and allometric growth coefficients. The data were analysed using a model with sex effect (with 4 levels: EM, CM, IM and FE). The data were tested to be normally distributed. Bounded flat priors were used for all of the unknown parameters. Marginal posterior distributions for all of the unknowns were estimated using Gibbs sampling. The Rabbit programme (Blasco, Reference Blasco2012) developed by the Institute for Animal Science and Technology (Valencia, Spain) was used for all procedures. Chains of 60 000 samples with a burn-in period of 10 000 were used. One sample out of every 10 was saved to avoid high correlations between consecutive samples. Convergence was tested using the Z-criterion of Geweke. The details of the procedure can be found in Blasco (Reference Blasco2001). The marginal posterior distributions of the differences among sex types for the chemical content and allometric growth coefficient were computed. Then the following parameters were obtained: the median of the marginal posterior distribution of the difference; the probability of sex types being different (the probability of the difference being greater than 0 when this difference is greater than 0 or the probability of the difference being less than 0 when this difference is less than 0); the highest posterior density region at 95% probability; the guaranteed value of a difference with a probability of 80% (limit of the interval [k, +∞) when the difference is greater than 0 or the limit of the interval (−∞, k] when the difference is less than 0) (k80%); and the probability of relevance (probability of the difference being greater than a relevant value) (ProbR).
Results
Descriptive chemical data
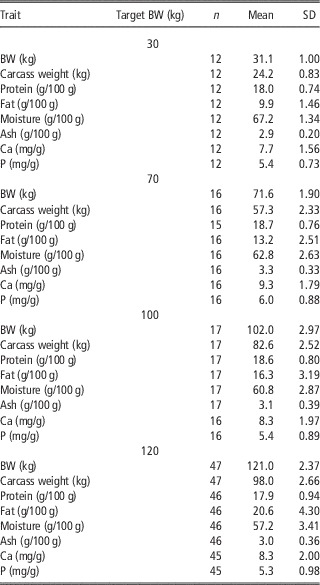
The descriptive statistics of the BW, carcass weight and carcass chemical composition are summarized in Table 1. The average BW of each group fits well with its corresponding target BW. Therefore, the pigs were scanned and/or slaughtered at similar weights within each group. Each carcass was mainly composed of moisture (average of 60.2 g/100 g), protein (average of 18.2 g/100 g) and fat (average of 17.1 g/100 g). Minerals were also present, although at a lower proportion, with an average ash content of 3.1 g/100 g. Within the mineral composition, the concentrations of Ca and P were important, with values of 0.8 and 0.5 g/100 g, respectively.
Descriptive statistics of the BW, carcass weight and carcass chemical composition of pigs at different target BWs

CT prediction equations
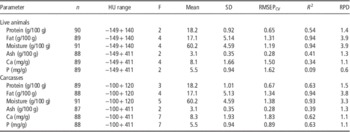
Table 2 shows the statistics of the CT prediction equations for the carcass chemical composition. In general, the statistics for the main chemical components were similar for both types of CT images: live animals and carcasses. The most accurate equations were obtained for the fat and moisture content, with a RMSEPCV for fat of 1.31 and 1.34 g/100 g for live animals and carcasses, respectively, and for moisture of 1.19 and 1.38 g/100 g, respectively. The Residual Predictive Deviation (RPD) statistic, used to evaluate the predictive ability of the models, was higher than 3 for both components and methods. This is the value recommended in the literature for suitable prediction models (Williams, Reference Williams2001). The R 2 of the regression between the fat and moisture content measured in the lab and those predicted by CT were also high for both types of CT images (from 0.93 to 0.94). The equations for protein were less accurate and the RPD values were also low (1.4 and 1.5) for both types of CT images. The equations for the ash and Ca content had higher prediction errors and lower RPD (between 1.1 and 1.3). The equations for the P content were inaccurate using CT scans of live animals (RPD=0.6 and R 2=0.09), but the accuracy was higher when using the carcass CT scans (RPD=1.1 and R 2=0.63).
Statistical parameters of computed tomography predictions for the carcass chemical composition of pigs using live animal and carcass images

HU=Hounsfield units; F=number of partial least square factors; RMSEPCV=root mean square prediction error of cross validation; RPD=SD/RMSEPCV.
Comparison between sex types
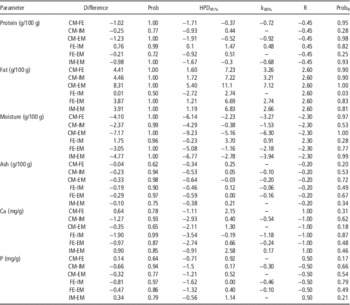
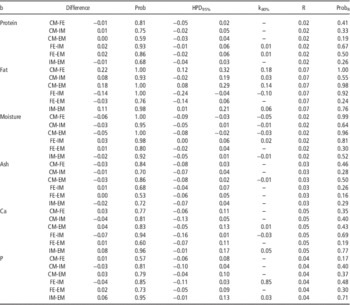
The features of the estimated marginal posterior distributions of the differences between sex types for chemical carcass composition are shown in Table 3. The differences have been studied at 120 kg target BW because this is close to the commercial slaughter weight and also because there were more measurements available. The present results cannot be uniquely related to a sex effect because the animals were not compared at the same stage of maturity but at the same weight. Nevertheless, these results are interesting from a commercial point of view. For the carcass protein content, CM and IM had lower values than FE and EM and these differences were relevant (ProbR from 0.82 to 0.98), considering one-half of the SD of the trait to be a relevant difference. No relevant differences were found between CM and IM (ProbR=0.28) or between FE and EM (ProbR=0.25). Regarding the fat content, CM had higher values than the other sex types, with a difference of at least 7.1 g/100 g with a probability of 80% (k80%) compared to EM and 3.2 g/100 g compared to FE and IM and a ProbR from 0.90 to 1.00. Females and IM presented intermediate and similar values (ProbR=0.03). Finally, EM had a lower content than FE and IM (k80%=2.7 g/100 g with a ProbR of 0.83 and 0.81, respectively). The moisture content showed an inverse behaviour. The CM had lower content than the FE and EM (ProbR of 0.97 and 1.00, respectively), but the ProbR for the difference between CM and IM was intermediate (0.53), indicating low evidence for its relevance. The FE and IM had similar moisture values (ProbR=0.28). Finally, EM had a higher moisture content than IM and FE (ProbR of 0.99 and 0.77, respectively). For the ash content, EM showed higher values than FE and CM, and these differences could be relevant (ProbR of 0.67 and 0.72). The IM had intermediate values (ProbR from 0.34 to 0.53). The Ca and P content showed a similar behaviour with differences between IM and FE that can be relevant (ProbR of 0.87 for Ca and 0.79 for P).
Features of the estimated marginal posterior distributions of the differences among sex types for carcass chemical composition of pigs at 120 kg target BW

Difference=median of the marginal posterior distribution of the difference; Prob=probability of the difference being greater than 0 when DH-L>0, and probability of the difference being lower than 0 when DH-L<0; HPD95%=highest posterior density region at a 95% probability; k80%=limit of the interval [k, +∞) when DH-L>0 and (−∞, k] when DH-L<0 at an 80% probability. It is displayed in the table only when DH-L and k80% have the same sign; R=relevant value defined as one-half of the SD of the trait; ProbR=probability of relevance (probability of the difference being greater than R); CM=castrated males; FE=females; IM=immunocastrated males; EM=entire males.
Growth of the chemical components and a comparison between sexes
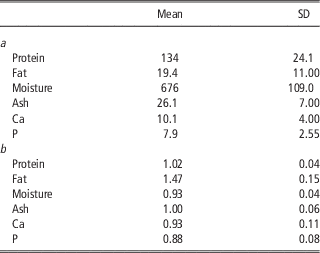
Accurate equations have been obtained for the protein, fat, moisture and ash content (kg) using CT images of the live animals (Table 4), with RPD from 3.2 to 13.6 and R 2>0.90. The predictions for Ca and P were less accurate (RPD of 1.7 and 2.0 and R 2 of 0.66 and 0.76, respectively), although they were better than the equations for mg/g carcass tissue (Table 2). These equations were applied to the animals of the monitoring group at 30, 70 and 100 kg target BW. The descriptive statistics of the chemical components are provided as Supplementary Table S1, and the results are similar to those presented in Table 1. Then, the allometric growth was studied using all of the data presented in Supplementary Table S1. The allometric coefficient for protein presented a value close to unity (1.02) (Table 5), indicating a proportional growth rate of protein with respect to BW. Regarding fat, b was 1.47, indicating a proportionally fast growth rate of fat in relation to BW. Conversely, moisture has a proportionally slow growth rate (b=0.93). Ash presented isometric growth (b=1.00), while Ca and P had a negative allometry, with b of 0.93 and 0.88, respectively.
Statistical parameters of computed tomography predictions for the absolute carcass chemical components of pigs using live animal images

HU=Hounsfield units; F=number of partial least square factors; RMSEPCV=root mean square prediction error of cross validation; RPD=SD/RMSEPCV.
1 Values obtained as the proportion of each component (g/100 g) and the carcass weight.
Allometric growth of the carcass chemical components (g) of pigs in relation to the BW (kg)Footnote 1

1 Equation has the form of Y=aXb, where a is a constant and b is the allometric coefficient.
An influence of the sexual type was found on the allometric growth of fat, moisture, Ca and P, while protein and ash were not affected (Table 6). Regarding fat, CM presented a higher b coefficient than FE and EM, with a k80% of 0.18 and 0.14, respectively. Moreover, the differences were relevant (ProbR of 1.00 and 0.98). As for the chemical composition, one-half of the SD of the b was considered to be a relevant difference. This difference in b would imply a difference of 6.6 and 9.1 kg of fat at 100 and 120 kg BW, respectively (simulated data). These values account for ~45% of the total amount of the fat of the carcass at weights close to the commercial slaughter weight (between 100 and 120 kg). The IM presented a higher b value than FE (ProbR=0.92). Conversely, for moisture CM had a lower coefficient than FE and EM (ProbR of 0.99 and 0.96, respectively). These differences would imply a difference of 4.8 and 5.9 kg of moisture at 100 and 120 kg BW, respectively (simulated data), which represents ~10% of the total amount of moisture in the carcass. The IM presented a lower b than FE (ProbR=0.81). No relevant differences were found for the allometric coefficients of protein (ProbR from 0.19 to 0.67) and ash content (ProbR from 0.16 to 0.50). Finally, the growth of Ca and P minerals showed a similar pattern. The IM had higher allometric coefficients for Ca and P than FE and EM although with intermediate-high ProbR (from 0.69 and 0.77).
Features of the estimated marginal posterior distributions of the differences between sex types for the allometric growth coefficient (b) of the carcass chemical components of pigs

1 Difference=median of the marginal posterior distribution of the difference; Prob=probability of the difference being greater than 0 when DH-L>0, and the probability of the difference being lower than 0 when DH-L<0; HPD95%=highest posterior density region at a 95% probability; k80%=limit of the interval [k, +∞) when DH-L>0 and (−∞, k] when DH-L<0 at an 80% probability. It is displayed in the table only when DH-L and k80% have the same sign; R=relevant value defined as one-half of the SD of the trait; ProbR=probability of relevance (probability of the difference being greater than R); CM=castrated males; FE=females; IM=immunocastrated males; EM=entire males.
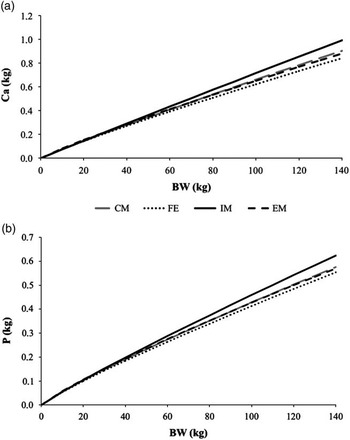
The allometric growth of the different chemical components is illustrated in the Figure 1 and Figure 2. The CM had a faster deposition of fat than the other sexes (Figure 1a). Females had a deposition rate parallel to EM, although the whole amount was higher for FE due to the higher a parameter in FE (data not shown). The IM and EM showed a similar deposition rate until ~80 kg BW, but after that point, the rate increased in IM, probably due to the effect of the second vaccination (at 70 kg BW). For moisture growth (Figure 1b), CM had a lower deposition rate than the other sex types. Likewise, IM and EM showed a similar deposition until ~80 kg, when IM started to decrease. The FE and EM also showed a parallel deposition rate, but in this case, EM had a higher whole amount due to the higher a in this sex (data not shown). The deposition of Ca and P showed a similar pattern (Figure 2), with IM showing the fastest development. In this case, the differences in the deposition rates are not as evident as for fat or moisture, in agreement with the results described above. Nevertheless, IM showed the highest whole mineral amount. This differentiation started earlier, between 50 and 60 kg BWs and therefore could be related to the effect of the first vaccination.
Allometric growth of the carcass fat (a) and moisture (b) content of different sex types (castrated males (CM), females (FE), immunocastrated males (IM) and entire males (EM)) in relation to BW.

Allometric growth of the carcass Ca (a) and P (b) content of different sex types (castrated males (CM), females (FE), immunocastrated males (IM) and entire males (EM)) in relation to BW.

Discussion
CT prediction equations
Different types of prediction equations have been developed to estimate the carcass chemical composition. On one hand, there are prediction equations of chemical component percentages (g/100 g carcass tissue) that will allow direct comparisons between groups independent of body or carcass weight. Moreover, these will provide a direct prediction of the relative chemical composition with its prediction error. On the other hand, there are prediction equations of chemical component weights (kg or g). These data can be used later to model the growth of different components in relation to body or carcass weight.
Accurate equations were obtained for fat and moisture percentages, and less accurate were obtained for the other components. There have been very few studies on the estimation of the pig chemical composition using CT technology. Szabo et al. (Reference Szabo, Babinszky, Verstegen, Vangen, Jansman and Kanis1999) showed R 2 values for the fat (0.89), protein (0.83) and water (0.82) content in live animals, although they did not present prediction error values. The lower accuracy for protein can be explained by the narrow range of variation of the protein content in the present study in accordance with Prieto et al. (Reference Prieto, Roehe, Lavín, Batten and Andrés2009) in NIRS, and also by analytical differences between the Kjeldahl methodology and CT. The available studies in the literature have focused on predicting the main carcass chemical components, but little is known about the prediction of the mineral content. More recently, Arthur et al. (Reference Arthur, Barchia, Giles and Eamens2011) presented equations for predicting the protein, fat and ash content in vivo using CT. These authors showed accurate models for fat and protein (R 2=0.98 and 0.92, respectively) and less accurate for the ash content (R 2=0.69). In that case, the chemical data were expressed in quantity (kg), and the explanatory variables were CT tissue weights (kg). The equations developed in the present study for chemical composition expressed in quantity (kg or g) were more accurate than those for percentages. It is important to highlight the higher accuracy for the ash content in this study compared to that found by previous authors. Furthermore, to our knowledge, this is the first study that attempted to predict the content of specific minerals (Ca and P) by using CT.
In comparing CT predictions using live animals and carcasses, similar prediction parameters have been found for the main chemical components. This is an interesting result because it shows the possibility of predicting the carcass chemical composition in vivo with almost the same accuracy as in the carcass. Viscera were included in the images of the live animals; therefore, we can conclude that, within the HU values considered in the present study, the viscera do not interfere. A different situation was obtained for P, which can be predicted in a more efficient way by scanning the carcass.
CT in vivo measurements of the carcass composition can allow farmers to determine the optimal slaughter time and weight and therefore to produce the best product, which better meets industry and consumer demands. In addition, they would be of particular interest for genetic programmes (Bünger et al., Reference Bünger, Clelland, Moore, McLean, Kongsro and Lambe2014; Konsgro, Reference Konsgro2014). CT can be applied on selection candidates, allowing direct selection schemes that could increase the selection response.
Differences between sex types in carcass chemical composition
The use of Bayesian inference in meat quality analyses was proposed by Blasco (Reference Blasco2005). The main advantage compared with classical techniques is the use of probability, which provides a higher precision about the uncertainty of an estimation and allows for the construction of several types of probability intervals. The probability of relevance is provided in this study to know whether the differences are important from an economic or biological point of view. One-half of the SD of each trait has considered to be a relevant value because for most productive traits the economic importance of a difference is relevant when it ranges between one-half and one-third of the SD (Blasco, Reference Blasco2011).
The chemical carcass composition varied with the sexual condition. The differences obtained are in line with the differences for fat, lean and bone volumes measured in vivo using CT in the same animals (Carabús et al., Reference Carabús, Sainz, Oltjen, Gispert and Font-i-Furnols2015). At 120 kg, CM had more fat and less lean volume than the other sex types. Females and IM presented intermediate volumes, and EM had less fat and more lean. The EM and IM presented higher bone volumes than FE and CM. The bone volume can be related to the ash, Ca and P content of minced carcasses. The results of the present experiment also agree with previous studies comparing the body composition (Fàbrega et al., Reference Fàbrega, Velarde, Cros, Gispert, Suárez, Tibau and Soler2010) and carcass and meat quality (Gispert et al., Reference Gispert, Oliver, Velarde, Suarez, Pérez and Font-i-Furnols2010) of these four sex types.
Growth of chemical components, a comparison between sex types
A common way to model growth and development is the use of allometric functions. The allometric coefficients obtained in this study are in line with the allometric growth of dissectible fat, lean and bone tissues estimated in the same animals (Carabús et al., Reference Carabús, Sainz, Oltjen, Gispert and Font-i-Furnols2015), with coefficients >1 for fat tissue, close to 1 for lean mass and <1 for bone. In addition, our results are in agreement with those obtained by Schinckel et al. (Reference Schinckel, Mahan, Wiseman and Einstein2008) and Arthur et al. (Reference Arthur, Barchia, Giles and Eamens2011) for protein, fat, moisture and ash. Comparisons of mineral growth are difficult because little information has been found in growing pigs.
The comparison among the sex types showed differences in the allometric growth of fat, moisture, Ca and P. Two groups were differentiated: CM with a higher allometric coefficient for fat and a lower allometric coefficient for moisture and EM and FE with the opposite situation. These results agree with the study of Schinckel et al. (Reference Schinckel, Mahan, Wiseman and Einstein2008), who reported higher allometric coefficients for moisture and lower coefficients for fat in FE compared with CM. These authors also found no differences in the allometric coefficients of ash, but found differences for protein, with higher values for FE. In the present study, IM showed an intermediate behaviour for fat and moisture accretion, between CM and EM, with lower evidence of the relevance of the differences. This fact can be related to the effect of the vaccine. In the early stages of growth, IM had the same deposition pattern as EM, and after the second dose (at ~70 kg BW), their development changed and appeared more like that of CM. This had a major impact on fat tissue because fat is a late maturing component. Carabús et al. (Reference Carabús, Sainz, Oltjen, Gispert and Font-i-Furnols2015) previously defined this change in body fat and lean tissue deposition in vaccinated males.
Protein and fat are key variables in pig growth models (de Lange et al., Reference de Lange, Morel and Birkett2003) because they are directly related to the efficiency of energy utilization in growing pigs (Noblet et al., Reference Noblet, Karege, Dubois and van Milgen1999). Accordingly, the differences in fat accretion obtained in the present study could have an effect on the cost and feed required per kg of carcass and also on the composition of the carcass (kg of lean and kg of fat).
Mineral allometric growth was also different among the sex types, with higher coefficients for Ca and P in IM and lower in EM and FE. Calcium and P are essential elements that are mainly present in bones and teeth. As teeth were not included in the minced carcasses, the higher growth potential found in IM should be related to a higher bone development. The growth models obtained in this study suggest that IM differs from EM in fat content after the second vaccine but in mineral content after the first vaccine. Nevertheless, the Ca and P values have an estimation error (Table 2), and this should be taken into account when interpreting the results.
Conclusions
Accurate prediction equations were obtained for the relative fat and moisture content by using live animal and carcass CT images, and less accurate equations were obtained for the protein and mineral content. Better equations were developed to predict the absolute amounts of the chemical components. Similarities within the prediction parameters in vivo and in the carcass indicate the versatility of CT and the possibility of measuring the chemical composition in live animals using this technology. The sexual condition of the animals influenced the carcass chemical composition (protein, fat, moisture, ash, Ca and P) at 120 kg BW. The relative growth rates of fat, moisture, Ca and P were also different among the sex types studied. This information can be used by researchers to optimize pig productions systems by formulating an optimum diet for each sex or by designing the most adequate selection programmes for each case.
Acknowledgements
This research was funded by the Spanish National Institute of Agricultural Research (INIA) corresponding to Project No. RTA2010-00014-00-00. INIA is also thanked for the scholarship to Anna Carabús. The authors thank A. Rossell, A. Quintana, C. Francàs and C. Pedernera for their valuable technical assistance.
Supplementary Material
To view supplementary material for this article, please visit http://dx.doi.org/10.1017/S1751731115001780