

Introduction
The examination of inequality within social systems has a long history, but has recently become the subject of sustained attention. This interest is in part the result of current economic and political trajectories which have produced a significant uptick in global socio-economic inequality over the last few decades (Hardoon Reference Hardoon2015; Piketty & Zucman Reference Piketty and Zucman2014). Investigating how different forms of inequality arose and were sustained through time has been identified as a central question for the discipline of archaeology (Kintigh et al. Reference Kintigh, Altschul and Beaudry2014). In this paper we use a recently developed method based on Gini coefficients and house sizes (Kohler et al. Reference Kohler, Smith and Bogaard2017) to examine inequality in the Ancient Near East from the Neolithic to the Iron Age. During this period we see the emergence of the earliest cities, states and empires, and our dataset therefore allows us to make statements regarding the relationship between social and political complexity and inequality. Kohler et al.'s findings are based on a global dataset of 64 sites or site groups, eight of which come from the Near East region. From this they are able to demonstrate a global trend of rising inequality through time, and a marked difference between the New and Old Worlds, with inequality in the latter rising much faster than in the former after the Neolithic period. They also issue an explicit call for regional-scale studies to assess the validity of the method and the results which they obtained from their global-scale analysis. In responding to that call, this paper examines the efficacy of the technique in a Near Eastern context. We find patterns in inequality through time which are not visible in the larger global dataset, allowing us both to make claims about the relationship between complexity and inequality in the Near East and to propose new hypotheses which can be tested in other regions.
Measuring inequality in the present and the past
The study of inequality is by no means free from technical and theoretical issues. Modern inequality is commonly calculated using data on income, pay or wealth, measured in monetary value and collected at a household level through interviews and surveys (Milanovic Reference Milanovic2005; Reference Milanovic2009). This method is clearly unavailable to those studying the past. Historians and economists have used other sources of data, including modelled Gross Domestic Product (GDP), information on prices, population estimates and health proxies such as height, to push further back into the past (Bourguignon & Morrisson Reference Bourguignon and Morrisson2002; Pamuk et al. Reference Pamuk, Van Zanden, Broadberry, O'Rourke, Broadberry and O'Rourke2010; van Zanden et al. Reference Van Zanden, Baten, Foldvari and Van Leeuwen2011). Such approaches are generally reliant on types of data collected by post-Industrial Revolution nation states, and as such they are temporally limited to the later part of the eighteenth century onwards (and even later in much of the world).
Prior to these sorts of data being available, options are more restricted. Tax, inheritance and land-holding records can be used to estimate inequality at particular points in time as far back as the Middle Bronze Age in southern Mesopotamia (Scheidel Reference Scheidel2018, 48), but cannot provide the sorts of long runs of comparable empirical information needed to examine inequality systematically through time. Material culture proxies of wealth, such as burial goods, monuments and prestige material assets (e.g. high-status pottery, jewellery, personal items) are only available within societies expressing a certain level of social complexity, and thus exclude many different groups and communities from any study. Furthermore, as items such as grave goods most likely possessed non-utilitarian functions and derived their values from the specific concerns of cultural groups and even individuals, it would be difficult to compare them under the umbrella of a cross-cultural study (Papadopoulos & Urton Reference Papadopoulos and Urton2012). Although it is difficult to prove empirically, one might also suspect that the analysis of burial goods in particular would privilege elite burials over commoners simply as a result of differences in preservation. At a larger scale, Leppard (Reference Leppard2019) has used a combination of agricultural suitability indices and Piketty's theoretical work on modern societies to assess inter-regional inequality between social groups in the Mediterranean.
In contrast to the approaches taken above, Kohler et al.'s method is based on a simple assumption; that the relative size of a domestic dwelling can be used as a proxy for wealth (Kohler et al. Reference Kohler, Smith and Bogaard2017; Kohler & Smith Reference Kohler and Smith2018). This assumption not only provides an easily comparable unit of measurement, thus allowing cross-cultural analysis, but it is also in theory much more suited for archaeological sites and communities. As household space can be calculated numerically (area in square metres), rather than based on interpretations of the economic and spiritual value goods may have had in the past, it can be used to generate metrics on the distribution of wealth within a given society or community (Kohler et al. Reference Kohler, Smith and Bogaard2017; Smith Reference Smith1987). Kohler et al. make heavy use of the Gini coefficient (Kohler et al. Reference Kohler, Smith and Bogaard2017; Kohler & Smith Reference Kohler and Smith2018, 39–63). The Gini coefficient is a popular and well-established method for measuring the unevenness in the distribution of material within a given population or sample. Its simple gradient, where 0 represents equal distribution of material and 1 represents the most uneven allocation of resources, is easy to understand. The method assumes that the size of a housing unit represents the wealth of the occupants, that the number of occupants remains constant, and therefore that by comparing the sizes of all houses within a given population we can calculate inequality within that community. Through the conversion of relative inequality into an absolute measure, the method allows for the comparison of different places and periods across any scale.
A range of problems can be raised with the use of differences in house size as a proxy for inequality. Chief among these is precisely what house size can be considered to represent, and how far this remains comparable across societies with very different socio-economic forms and scales. In modern societies, houses are considered a form of wealth. Wealth is differentiated from income such that wealth represents the net value of all assets owned, while income represents the money received over a given period of time, such as salary per year. In ancient societies house size also likely reflects this definition of wealth more than income, but in more socially embedded economies may also incorporate relations which are more aptly considered through concepts such as power. Put simply, house size might be conceived of as a function of the capacity to procure space within a settlement and to mobilize materials and labour in construction, with larger house size implying greater capacity. How space, materials and labour were procured in a Neolithic village may have been very different from how they were procured in an Iron Age urban centre. Here we make the broad assumption that in both cases this sort of capacity is a proxy for more general hierarchies, and reflects some combination of economic and social power. The notion that an individual's power correlates with the size of the buildings they occupy is a common assumption in the field, albeit often implicit (Herzog Reference Herzog1997; Kempinski & Katzenstein Reference Kempinski and Katzenstein1992, 202–22; Woolley Reference Woolley1974; Woolley & Mallowan Reference Woolley and Mallowan1976; Yon Reference Yon2006, 35–62). Here power could be equated to a number of spheres, including spiritual, political or military influence, but it may also be closely associated with economic power, such that either the aforementioned privileges allow for the accumulation of wealth or the use of economic assets allows for the creation of socio-political power structures to the owner's benefit. Such an interpretation also has empirical support. Significant ethnographic and archaeological evidence from the Middle East suggests a strong relationship between the socio-economic status of individuals and the size of their domestic buildings (Daviau Reference Daviau1993, 34–7; Schloen Reference Schloen2001, 7–23; Yassur-Landau et al. Reference Yassur-Landau, Ebeling and Mazow2011, 19–25). A recent study has also found a strong correlation in Gini values based on house size and other data types, such as storage space and burial goods (Fochesato et al. Reference Fochesato, Bogaard and Bowles2019).
A further problem with this method is that it does not take into account differential values associated with the position of the house within a site. While two different hypothetical household units may express similar levels of wealth based on their equal size, their positioning within a given settlement may place them within completely different economic classes. Study of ancient purchase contracts within the Near East has shown that the cost of housing varied depending on its placement inside the city (Veenhof Reference Veenhof1996, 257–60). Archaeologists have attempted to address this issue by comparing neighbourhood and household access to services, such as markets or religious buildings (Dennehy et al. Reference Dennehy, Stanley and Smith2016), and these could be usefully combined with our inequality work. A more significant issue is that the use of household buildings as a proxy may remove particular classes of society from the equation altogether. Nomadic communities are almost certainly underrepresented, as they are throughout the archaeological record. There is some evidence that semi-permanent occupations result in a weaker relationship between wealth and household size than is commonly found in sedentary communities (Szuchman Reference Szuchman2009), but also that pastoralist and agriculturalist modes of production generate similar levels of inequality (Smith et al. Reference Smith, Borgerhoff Mulder, Bowles, Gurven, Hertz and Shenk2010), further complicating comparison. Kohler et al.'s methodology does not capture the existence of those without homes of their own, including those in extreme poverty and slaves. The prevalence of slavery, including debt peonage, in the Bronze and Iron Ages in the Near East is well documented within the textual records of the period (Van de Mieroop Reference Van de Mieroop2007, 106–8). Even if we ignore such social realities, we cannot ignore the fact that if there is a relationship between household size and relative wealth, the size of the domestic building can only be said to represent the wealth of its owner(s) or rent-paying tenants and not slaves who had minimal access to economic capital and were in fact classified as property (Van de Mieroop Reference Van de Mieroop2007, 107). This means that Gini coefficients based on house sizes systematically exclude the lowest classes of people and therefore would generally underestimate inequality at any given point. This would be of limited concern for cross-cultural comparison if the proportions of the groups not captured by the method (slaves, nomads, very low status individuals) remained the same across time and space, but this is very unlikely to be the case.
All of these issues mean that we should treat the results of this method with some caution. However, and as noted above, all proxies for assessing ancient inequality have shortcomings. In the discussion and conclusion sections below we suggest some ways of interpreting our results in the light of these shortcomings, and suggest further avenues of research which could mitigate their effects.
Materials and methods
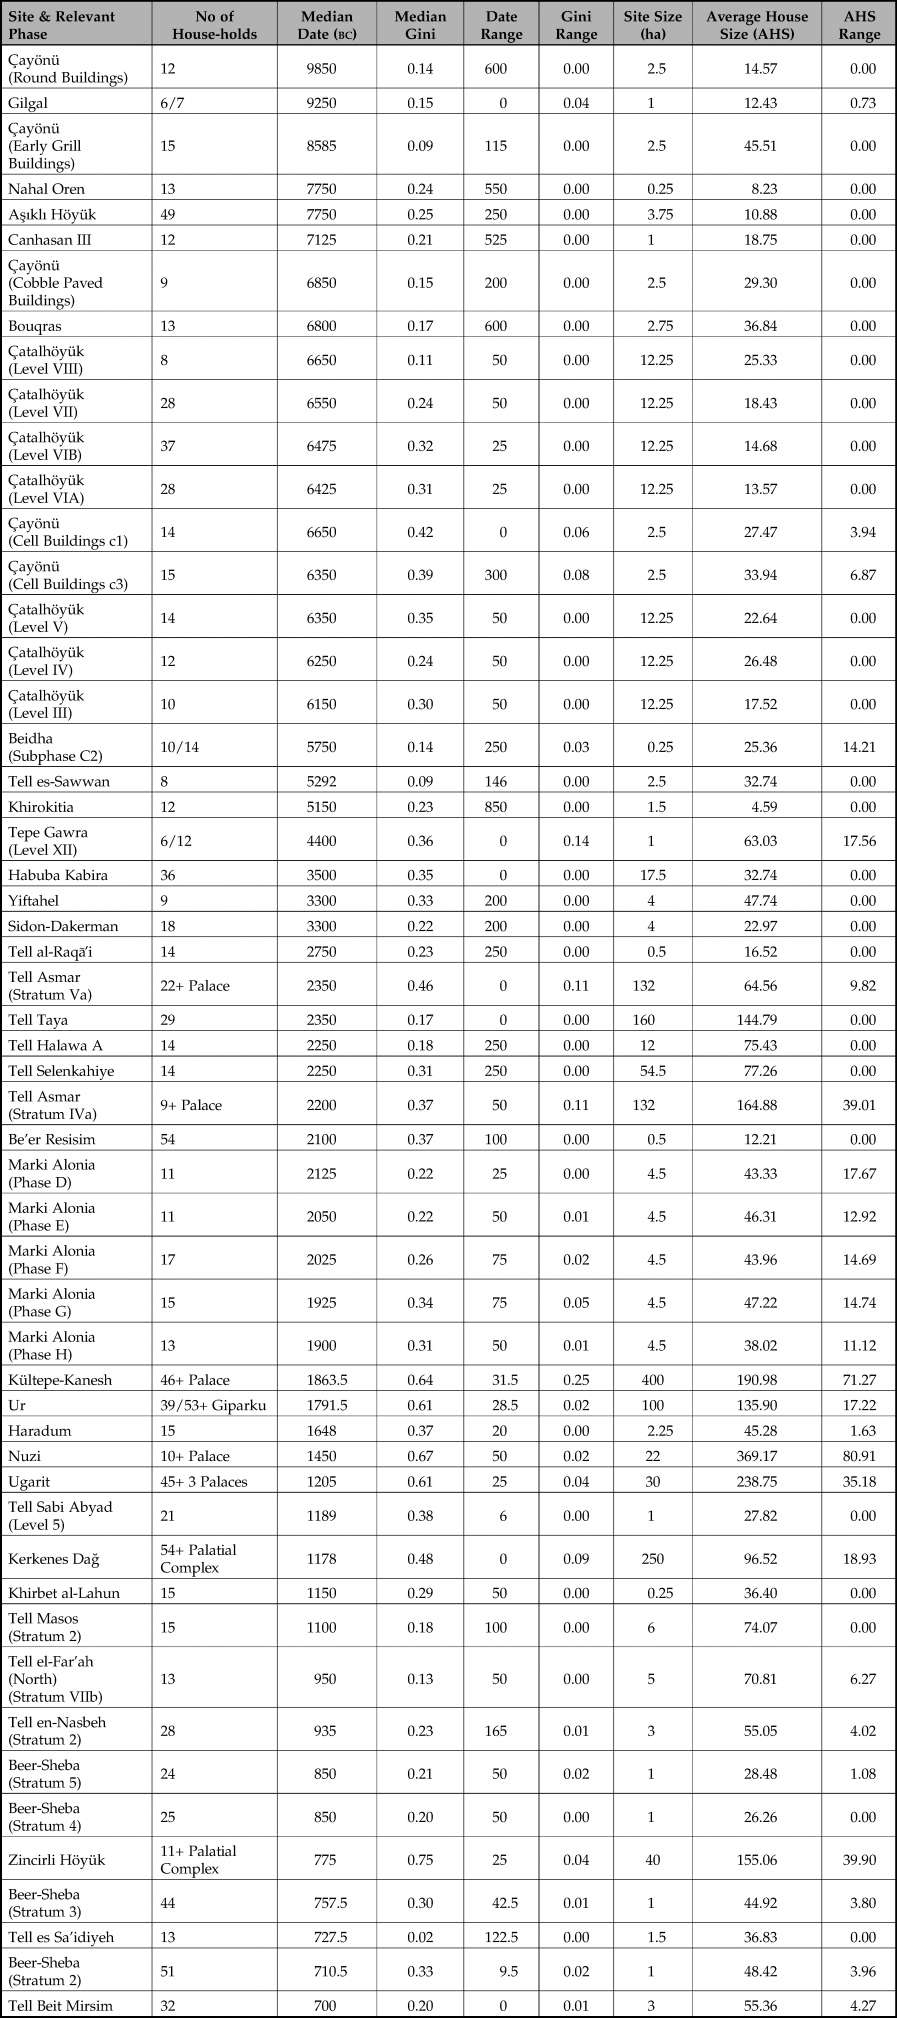
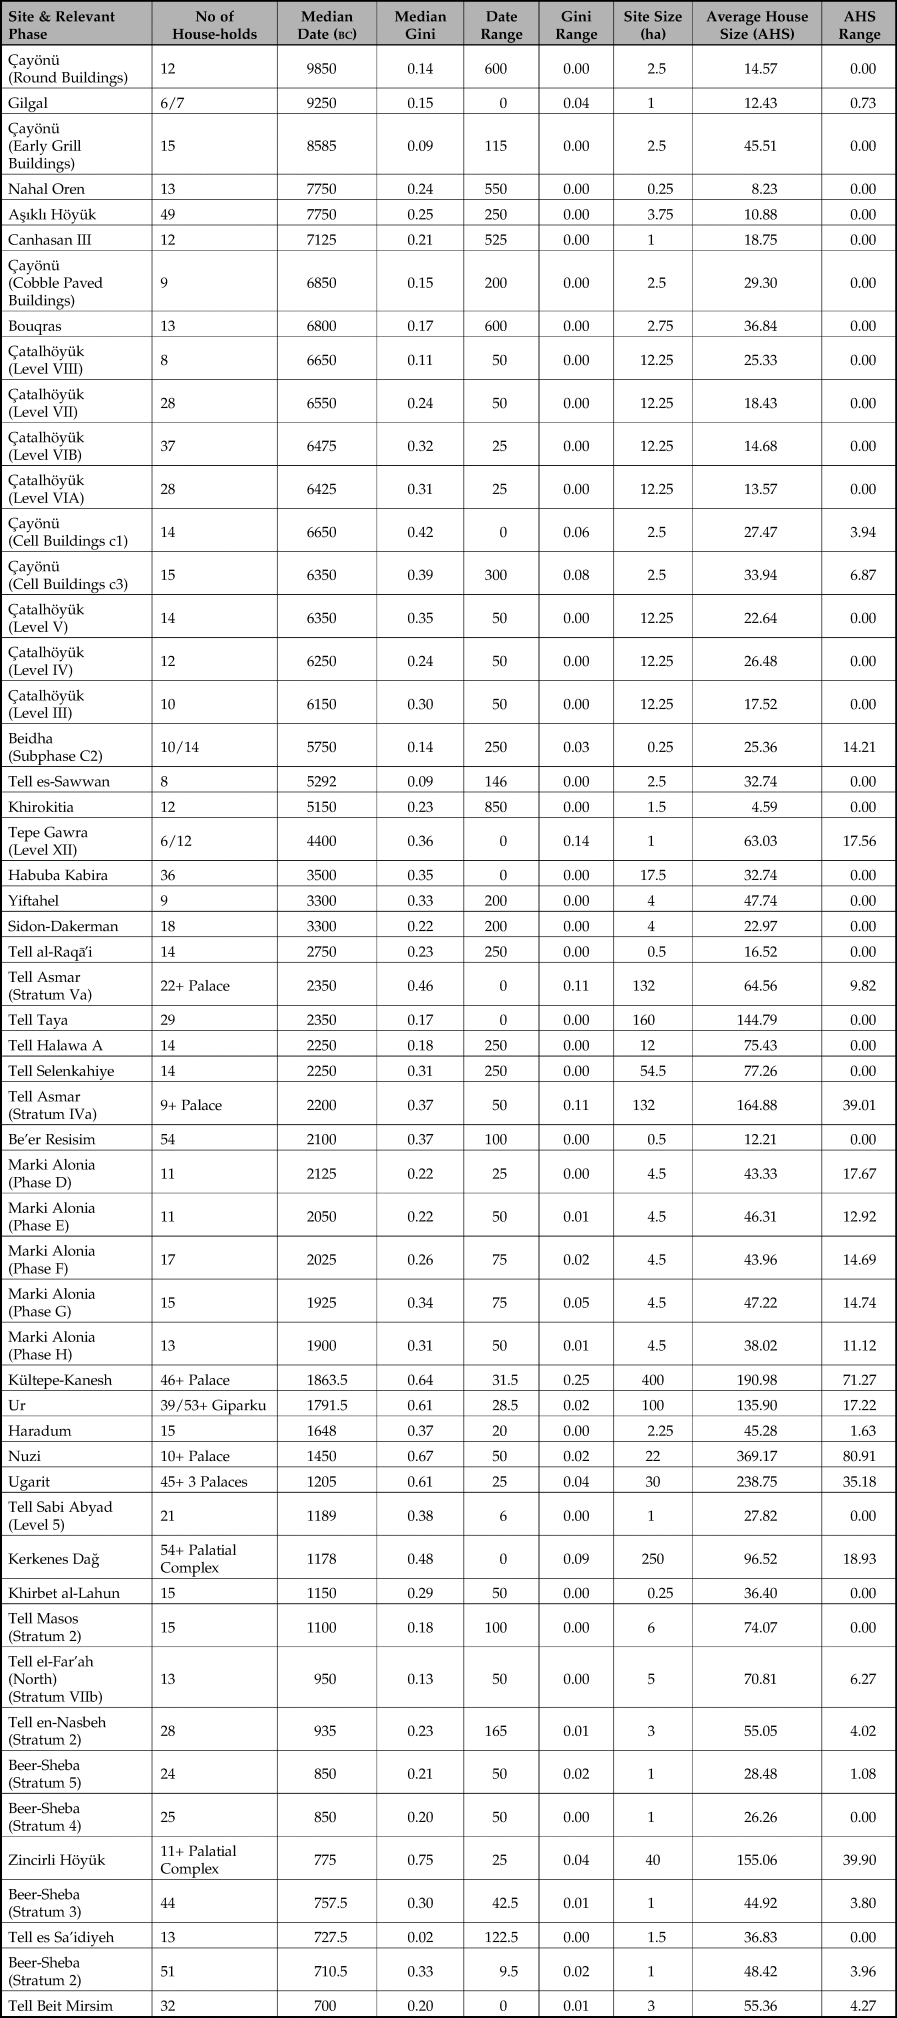
The dataset for this study comes from published records of excavated archaeological settlements with a representative number of completely exposed contemporary domestic buildings. Since archaeological settlements vary both in size and population, it is difficult to ascertain how representative of the entire population the excavated structures are. In order to ensure that the Gini coefficients calculated are at least somewhat representative, an arbitrary limit of a minimum of 10 contemporary completely excavated housing units within a single architectural phase was imposed. However, for smaller sites where the full geographic extent of the site was clearer, the minimum number of housing units required was reduced to five in order to ensure that smaller archaeological sites were not excluded from the sample. In total our dataset includes 54 Gini Values from 36 different sites within the Near East (several sites had sufficient exposures of multiple phases to provide multiple samples). Table 1 provides data on each site and phase. [More information, including references, is available in Supplementary Material 1.]
Summary of key sites and site phases used in this study. Note: Median Gini and Gini Range columns refer to sites where multiple Gini calculations were made, either due to multi-storey buildings or the inclusion and exclusion of courtyards, or both.
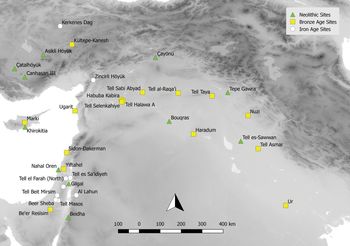
The approach taken limited the number of sites available for analysis and introduced some geographical and temporal biases in the dataset, since it required large exposures of single architectural phases. Such exposures are relatively rare in the Near East during pre-Classical periods due to the nature of the archaeology and prevailing research trajectories. Because many of the sites are tells, large settlement mounds made up of successive phases of mud-brick architecture, earlier phases are commonly buried under substantial overburden and only exposed in relatively small sondages. Smaller exposures render reconstructing even individual houses, let alone multiple structures, impossible. Much archaeological work in the region has focused on monumental and public architecture at the expense of domestic areas, while regional research trajectories have resulted in emphases on particular periods. For example, the legacy of biblical archaeology means the Iron Age is well represented in the Levant, while southern Turkey has a relative preponderance of Neolithic sites. As such it was necessary to examine a large region in order to sample sufficient numbers of sites from different phases. Here we incorporate data from across the Fertile Crescent, including southern Turkey, Syria, Iraq, Jordan and Israel-Palestine, as well as Cyprus (Fig. 1). Despite its large size, it can be argued that the region was broadly coherent from the Neolithic onwards, when we can see the long-range circulation of raw materials, such as obsidian, and ideas, such as painted pottery. By the Iron Age, massive political entities such as the Neo-Assyrian Empire held sway over almost the entire region.
Sites included in the Gini values dataset. (Basemap topography derived from NASA SRTM 3 arc-second imagery with hillshade.)

While there were some sites where the size of each household was recorded and published as part of the site monograph or an independent study, most of our dataset values were derived from the measurement of published architectural site plans. Plans were scanned at a high resolution and digitized within a Geographic Information System (GIS) environment. Structure walls were excluded under the assumption that the thickness of the walls was not a part of the ‘living space’. Once the size of each household was measured, the Gini value of each phase was calculated using the ‘ineq’ package in RStudio. Each household was treated as a single unit and size was calculated in square metres. When calculating the living space within each household, special attention was given to four important architectural aspects: multiple-storey buildings, enclosed courtyards, palaces and temples.
Although at the majority of these sites the ‘living space’ of each building was calculated by looking at the preserved walls of each household unit, which can be said reliably to represent only the ground floor of the overall architectural plan, some of the houses contained remains of staircases or markedly thicker walls, possibly indicating the existence of upper floors. The exclusion of upper floors from the study could be problematic, especially given that upper floors may indicate greater wealth. However, it is difficult to predict the size of upper floors accurately without definite archaeological evidence. In order to accommodate this issue, we produced two Gini values from all sites containing at least one housing unit with a preserved staircase. While the first calculation ignores upper floor spaces, the second incorporates the upper floors in the dataset by assuming (unless stated otherwise by the excavation team) that the households with preserved staircases had a single second floor exactly the same size as the ground floor. Both results are incorporated into the final measurement of inequality on the given site in order to establish a range of maximum and minimum Gini values.
Courtyards pose a similar problem to upper floors in that they are potentially significant parts of a household unit; but the degree to which spaces associated with specific buildings were private is often difficult to reconstruct in the archaeological record and from publications, and may not be uniform across a site. One approach would be to include courtyards clearly enclosed by walls or fences. Alongside the resulting physical exclusion, the cost of the construction involved in enclosing such spaces would suggest that these areas were private and therefore representative of household wealth. However, the absence of enclosing walls around courtyards may be due to incomplete excavation, or construction from more ephemeral materials, such as reeds. As a response to this, we have again calculated two Gini values for sites containing at least one household unit with an identified courtyard or open space, with one incorporating the area of the courtyard into the total area of the household and the other excluding courtyards. On sites where both staircases and courtyards had been identified, four Gini values were calculated.
Palaces present a specific problem in the Near East because they were more than just ‘dwelling areas’ for the ruling class, acting as both public and governmental buildings and often including workshops and storage facilities (Daviau Reference Daviau1993, 20–23; Gates Reference Gates2011, 43, 61–5; Postgate Reference Postgate2017, 137–53; Pucci Reference Pucci2008, 12). Some larger examples of these ‘palace-complexes’ housed the extended royal family and possible other elite individuals, making it problematic to argue that the size of these buildings represented the wealth of a single household (Heinrich Reference Heinrich1984; Postgate Reference Postgate2017, 137–53; Yon Reference Yon2006). In order to address this issue, we ignore spaces classed as non-domestic in the published reports when calculating the size of elite housing. This presupposes that the excavators made such a distinction, which was not always the case, and we therefore only apply this method to sites such as Zincirli Höyük (Pucci Reference Pucci2008, 12, 74). At sites where multiple elite houses or ‘palaces’ had been observed, as was the case with Ugarit and Kerkenes Dağ (Summers & Summers Reference Summers and Summers2008; Yon Reference Yon2006, 37, 52, 56, 60), two Gini values were calculated. The strong calculation assumed that all these different buildings represented the relative wealth of a single ruling-class household. The weak calculation assumed that each architectural unit represented a single elite household. These two values were then used to calculate a range of possible Gini values. Below we examine the contribution of palaces to the Gini values for sites where they have been recovered. This allows us to make statements on the extent to which the development of palatial infrastructure coincided with changes in levels of inequality in the rest of society. In other words, we can examine whether the emergence of elites occurred in tandem with greater stratification in non-elite classes.
Temples within many sites dated to the Bronze Age and later also raise some interesting questions in relation to their status as either public buildings or semi-private dwellings, and their relationship with the overall socio-economic structure of the settlement. In Mesopotamia, many leaders ruled as divine kings, either deriving their power from the local pantheon, or outright claiming to be supernatural deities themselves (Postgate Reference Postgate2017, 260–75), while temples often included areas used for tasks also associated with domestic contexts, such as food preparation. One could therefore make the argument that the size of temples should be incorporated into the overall measurement of the ruling-class household as the construction and upkeep of these structures was both an expression of kingly power and wealth and an integral tool used for the procurement and consolidation of political and economic power. In later periods, temples and palaces are often conjoined, making distinguishing between the two difficult. For this study, we sidestepped these issues by excluding all temples and other religious buildings, except for the Gipar-ku Temple at the city of Ur which also served a clear domestic function (Woolley & Mallowan Reference Woolley and Mallowan1976, 42–62). In all cases the inclusion of temples would have raised the Gini values for individual sites, meaning we can interpret our results as a minimum level of wealth inequality which may have been exacerbated by wealth inequalities manifested through religious institutions.
Results
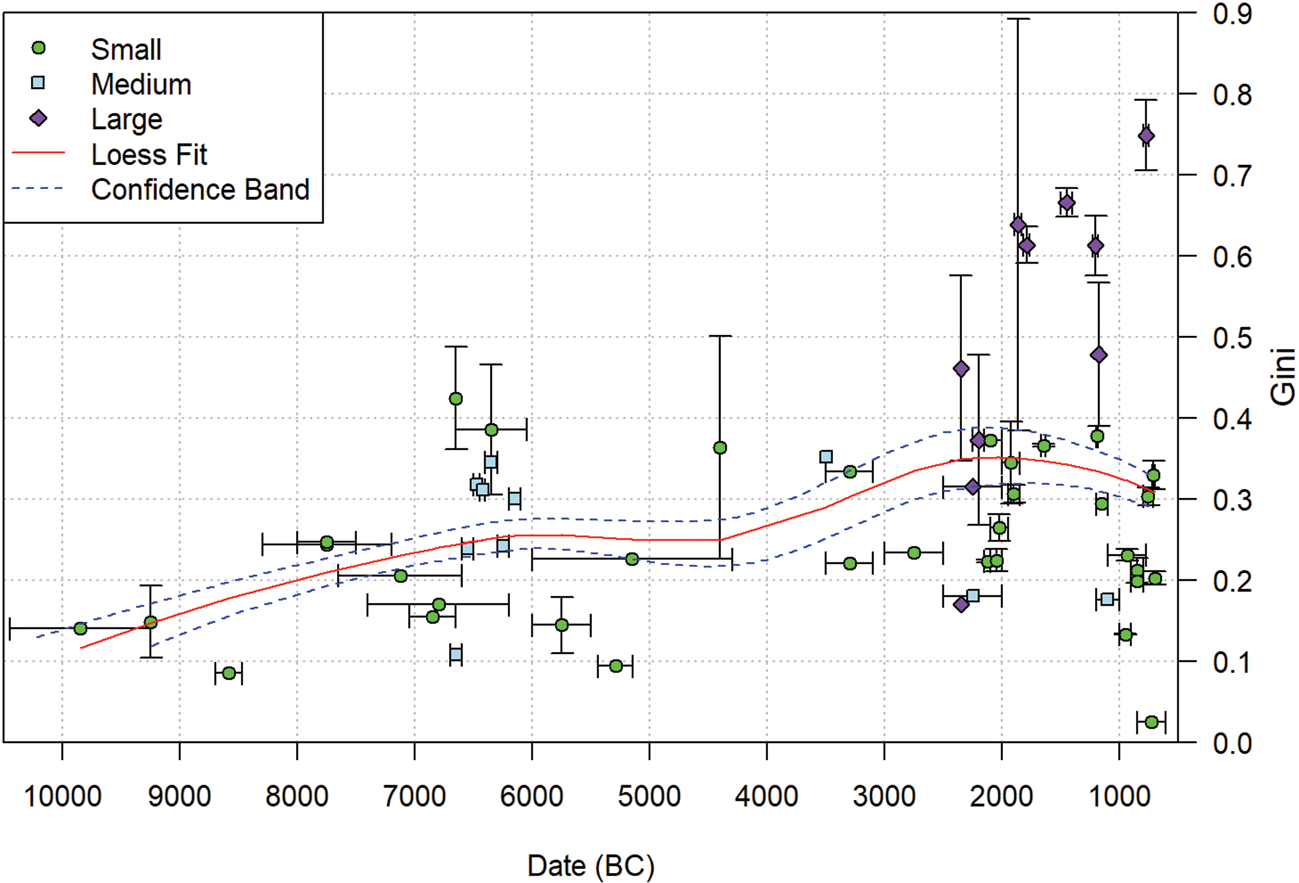
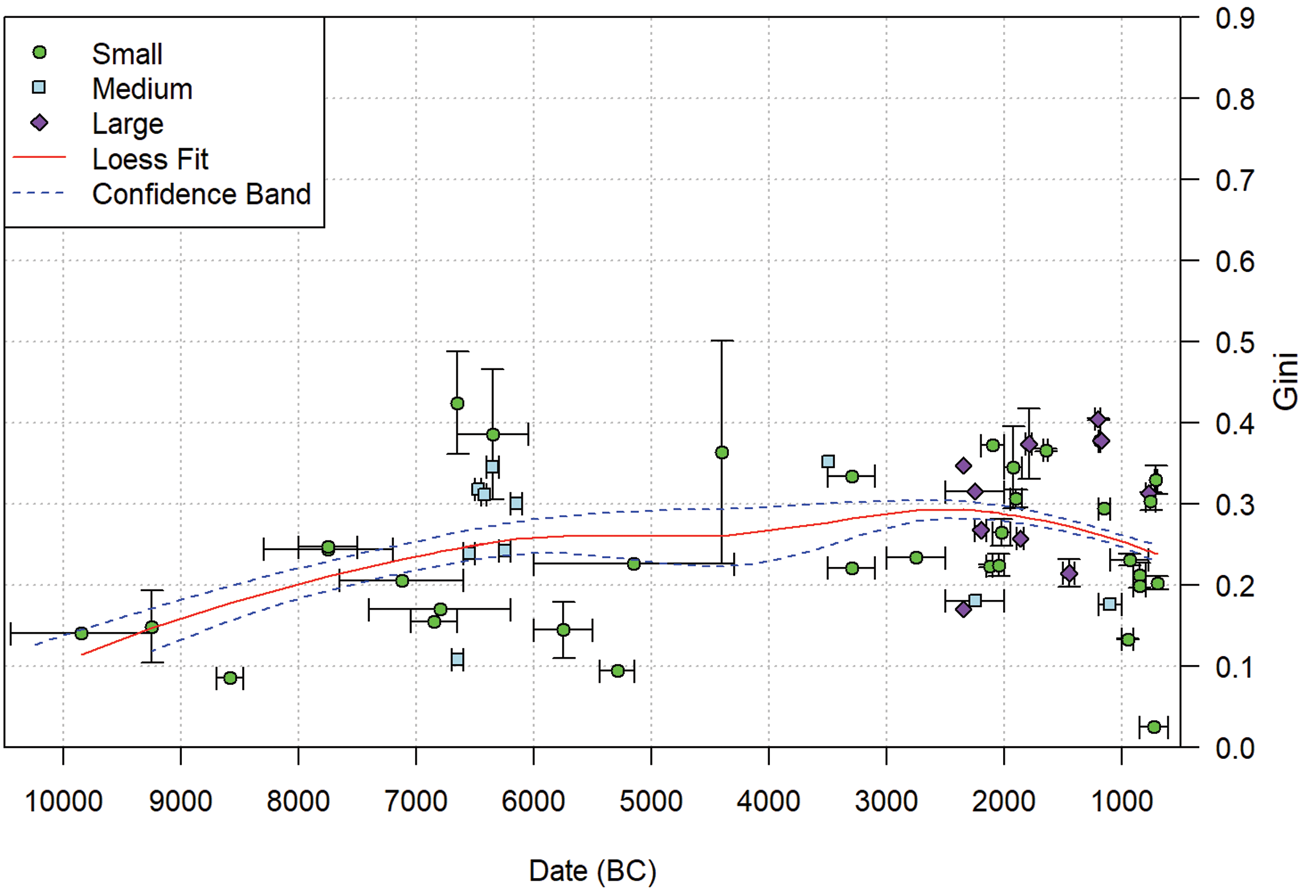
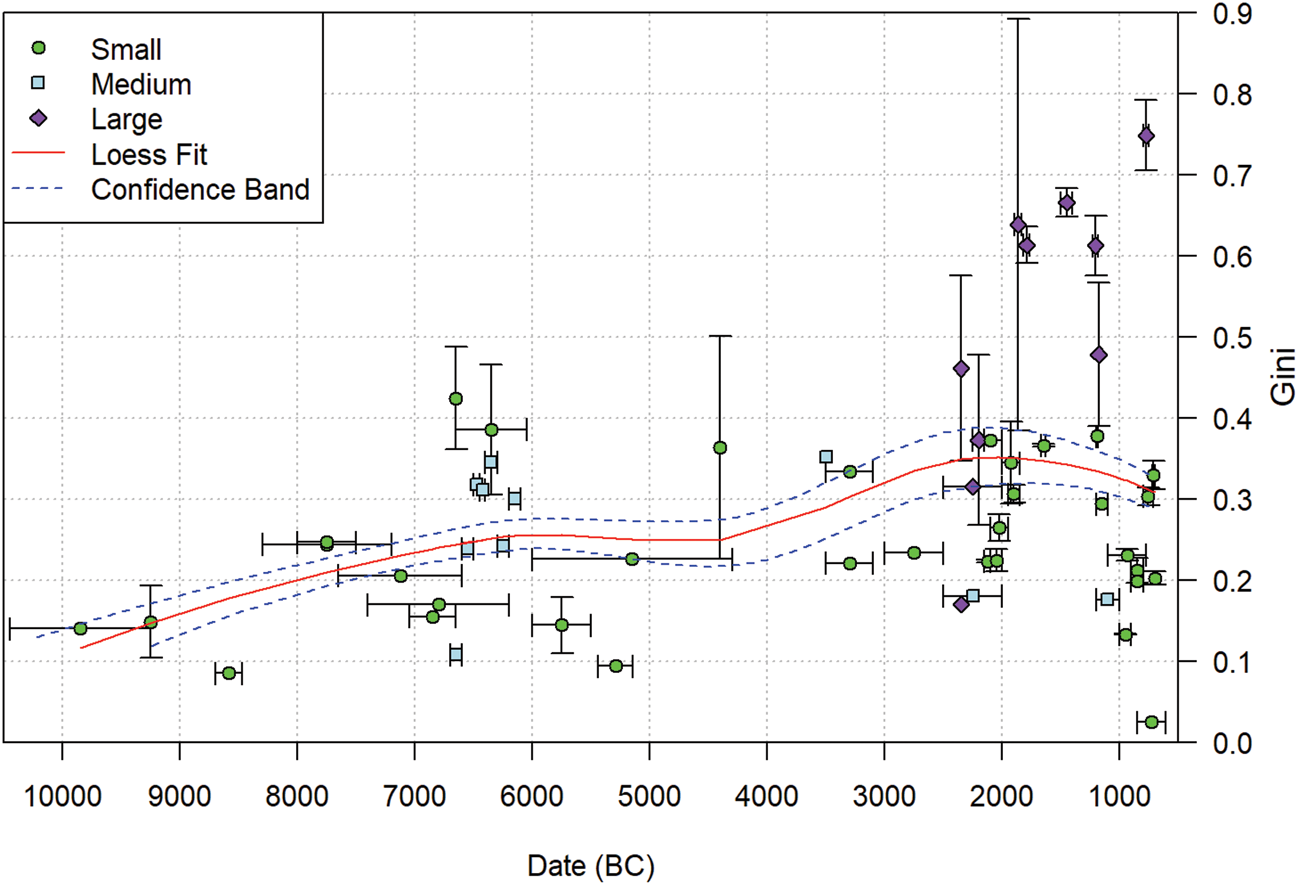
Figures 2 and 3 show the overall trends in Gini values through time, with Figure 2 including palaces in the calculations and Figure 3 excluding them. The sites in both Figures are divided into three categories: sites which are between 0 and 5 ha in size are classified as Small, sites between 5 and 20 ha are classified as Medium and sites above 20 ha are classified as Large. These categories are based on settlement size trends within the Near East which show that sites above 20 ha were rare and unstable exceptions until the beginning of the Bronze Age, thus implying that a certain socio-economic threshold had to be crossed in order to construct and maintain these large settlements (Lawrence et al. Reference Lawrence, Philip, Hunt, Snape-Kennedy and Wilkinson2016). In addition to separating sites based on the 20 ha threshold, we also decided to divide sites below 20 ha into two categories in order to observe further patterns between site size and Gini values. We present the results with robust regression lines generated by locally weighted scatterplot smoothing (Loess) using a span of 0.75. This span was chosen as the best balance between rough and smooth curves required to aid interpretation of the results. Kohler et al. (Reference Kohler, Smith and Bogaard2017) used the same smoothing method with a span of 0.5. The dashed blue lines represent the regression lines produced using the minimum and maximum Gini values for sites with upper floors or courtyards, and the start and end dates of the chronological period ranges.
Scatter graph of Gini values by site through time, divided between different site size categories. Palaces are included in the relevant site values. Red line represents Loess regression for median Gini and period ranges; dashed blue lines give outer limit of regression lines on minimum and maximum Gini values and start and end dates of period ranges.
Scatter graph of Gini values by site through time, divided between different site size categories. Palaces are not included in the relevant site values. Red line represents Loess regression for median Gini and period ranges; dashed blue lines give outer limit of regression lines on minimum and maximum Gini values and start and end dates of period ranges.
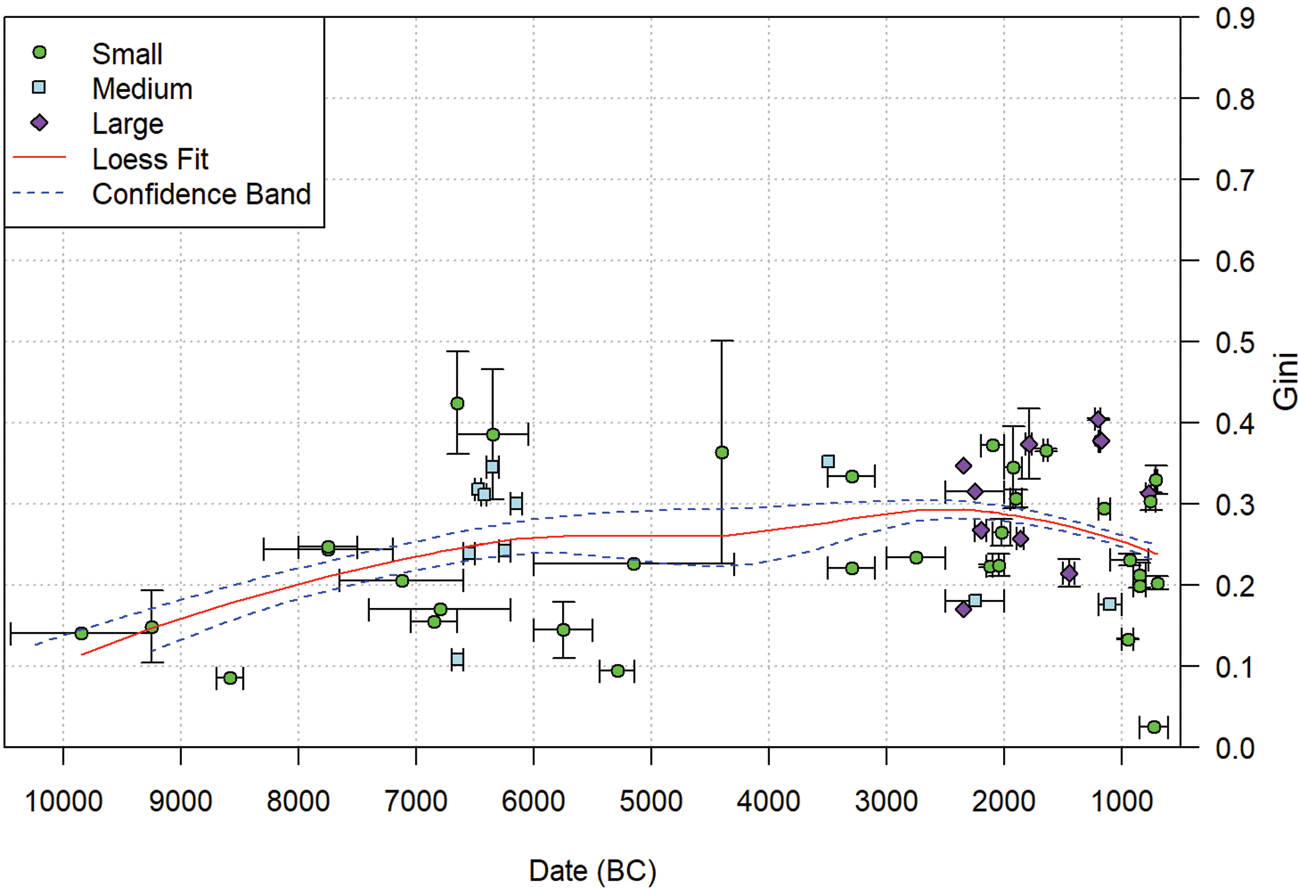
Both datasets demonstrate an increase in inequality of house size through time. The results shown in Figure 2 are similar to the trends for the entire ‘Old World’, as measured by Kohler et al. (Reference Kohler, Smith and Bogaard2017). Although their measurements place the Gini values of Iron Age Eurasia around 0.4, slightly higher than the average values we have collected for the same period, the initial Gini values and the gradual increase are comparable.
Kohler et al.'s sample does not appear to include any sites displaying very low Gini values, unlike the results of our research. In comparison to the later periods, the level of variation is lower during the Neolithic, although the results are far from uniform. During the Bronze & Iron Ages, a few sites display much higher values, while others experienced no change, or even a decrease, in comparison to earlier periods. Higher values are found at large sites which had palaces, while lower values are found across all three site size classes, with small and medium-sized sites the majority. Comparison of Figures 2 and 3 clearly indicates that palaces make a significant contribution to the Gini values. While there is a positive trend in Figure 3, the difference between the beginning of the Neolithic and the highest point in the Iron Age is approximately 0.1, only half of the increase we observe in Figure 2. In the absence of palace values, the high Gini values found at large sites largely disappear. Instead, the Gini values in Figure 3 reach a plateau of ~0.25 Gini at about 6500 bc, which rises only very slightly in the Late Bronze and Iron Ages.
Inequality and settlement size
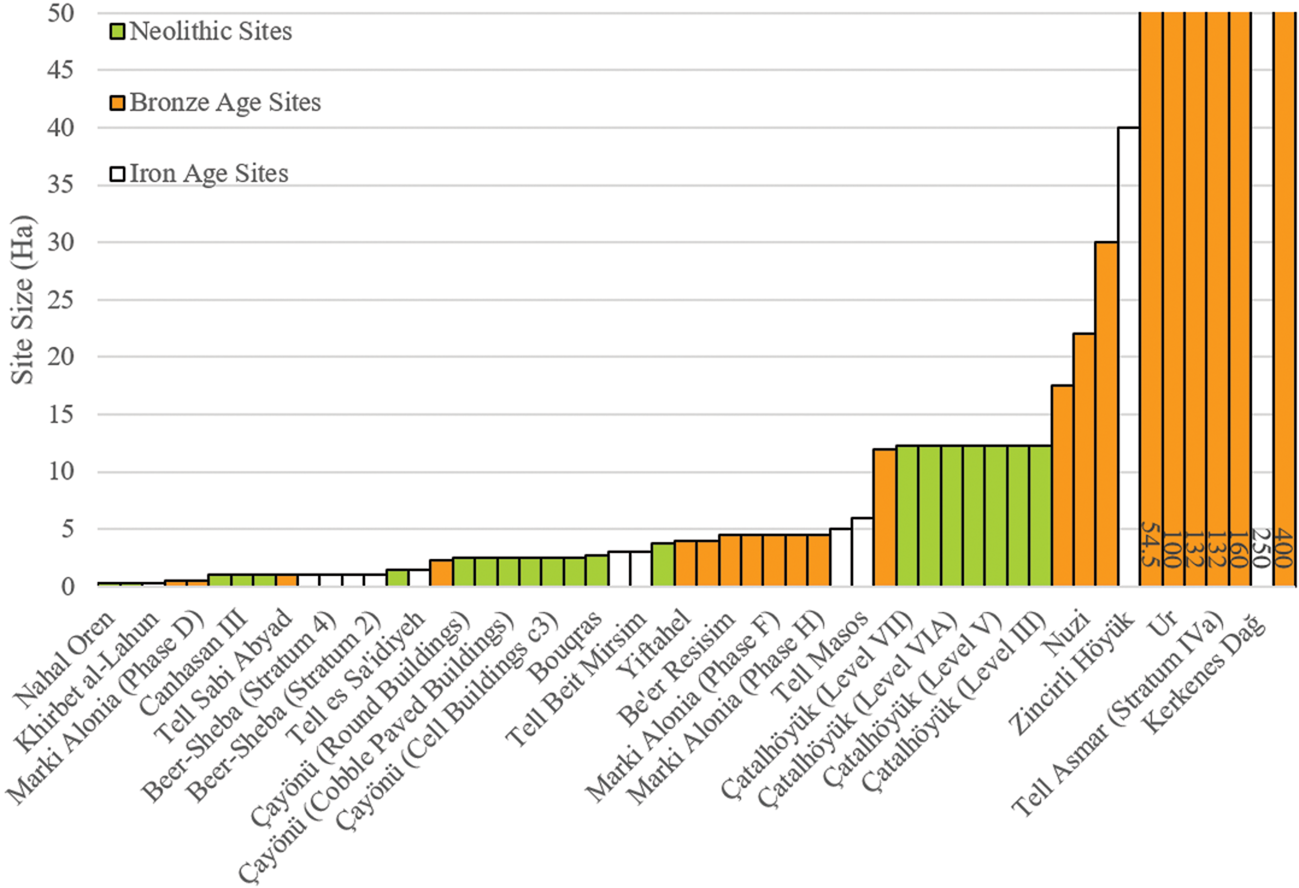
Classifying our sites into broad size categories allows us to make some statements on the relationship between house size inequality and urbanism. Archaeologists have long assumed that early urbanism coincided with increasing social, political and economic inequality. Here we use site size as a simple metric to make comparisons between different site types. Although this does not reflect the more nuanced approaches to urban definitions developed in recent years (see e.g. Cowgill Reference Cowgill2004; Creekmore & Fisher Reference Creekmore and Fisher2014; Gaydarska Reference Gaydarska2016), empirical research in the Near East (Lawrence et al. Reference Lawrence, Philip, Hunt, Snape-Kennedy and Wilkinson2016) and globally (Morris Reference Morris2013) demonstrates that site size can be taken as a proxy for social complexity. Throughout our period of study, the vast majority of sites are rural agricultural settlements under 5 ha in size (Wilkinson Reference Wilkinson2003). From the Neolithic onwards, a small number of sites grow to between 10 and 20 ha, but these do not display any of the traits commonly associated with urbanism, such as monumental buildings or evidence of elite material culture. The first evidence for such traits dates to the fourth millennium bc, while sites which can unequivocally be defined as cities become ubiquitous across much of the region during the Early Bronze Age (Ur Reference Ur2010). Although the precise nature of these urban forms depends on local conditions, all sites which might fall into this category are above 20 ha in size. Figure 4 shows the sizes of the sites in the dataset.
Bar chart of site sizes by period.
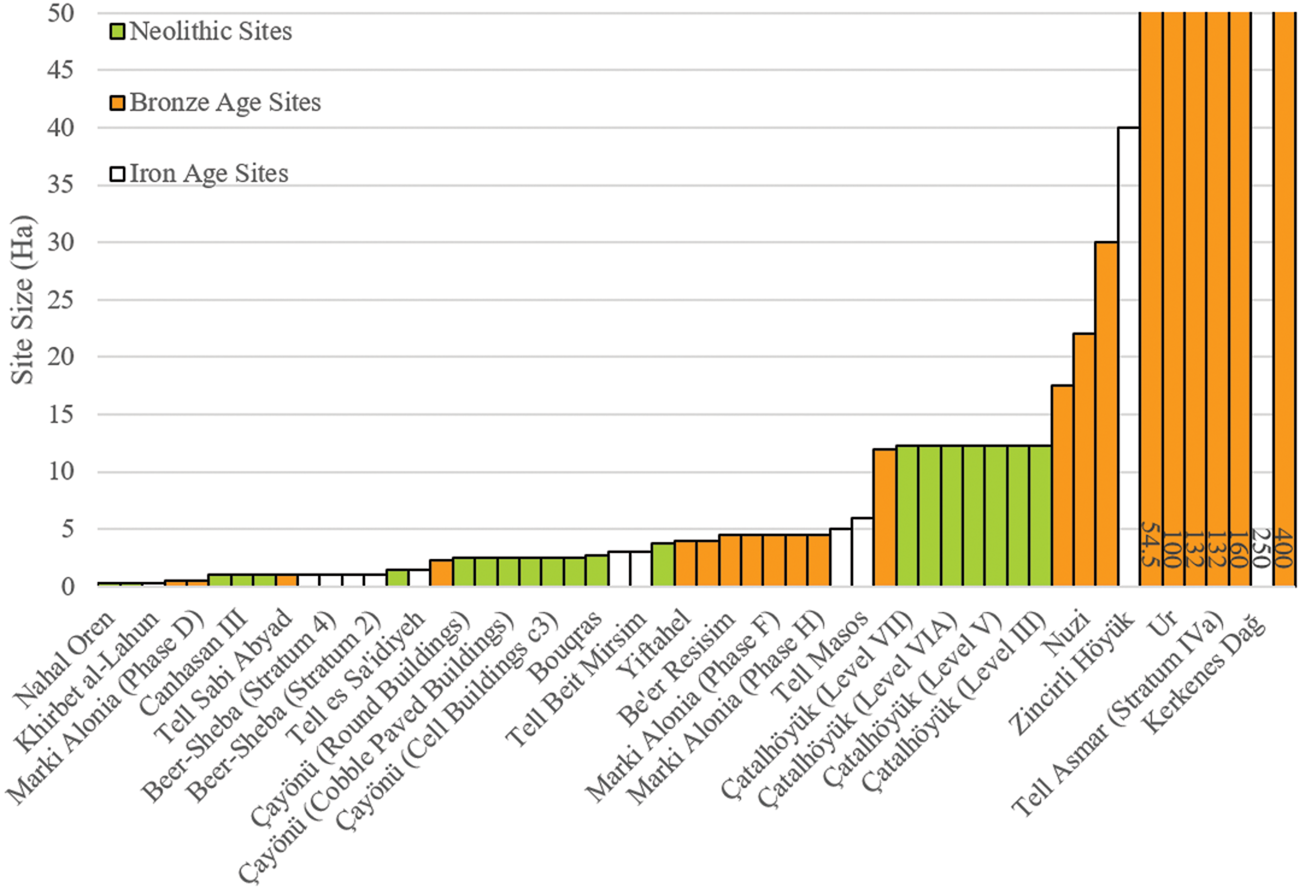
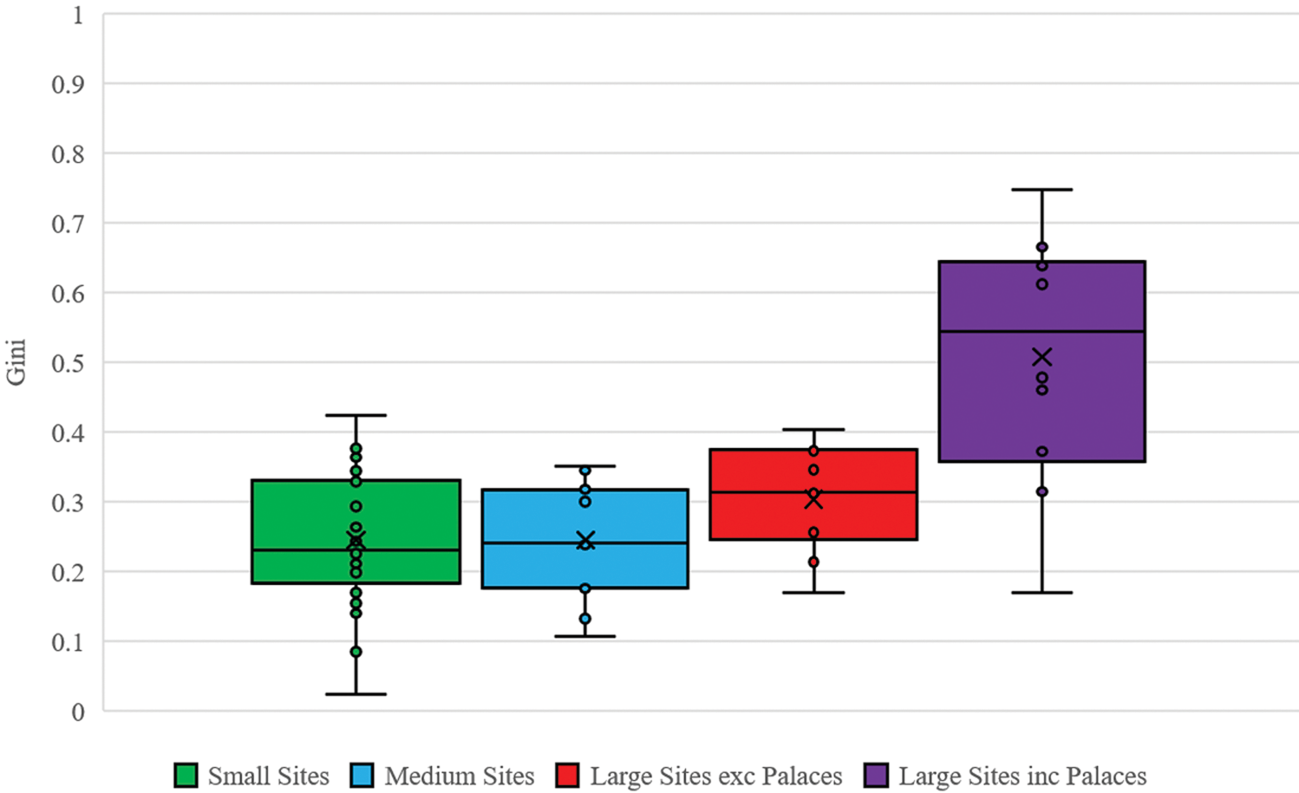
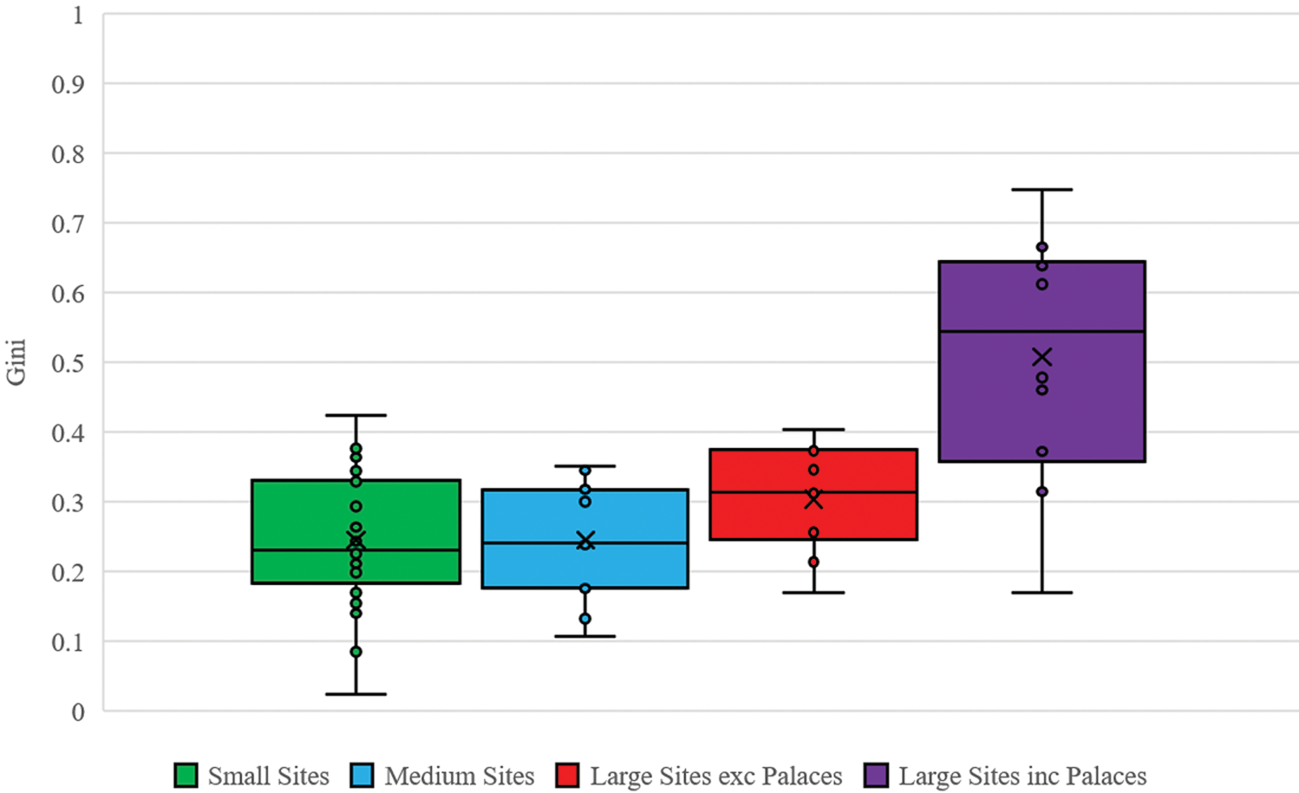
Figure 5 shows average Gini values for three settlement size categories. Small Sites are those under 5 ha, Medium Sites are between 5 and 20 ha and Large Sites are over 20 ha. We display the Large size category with and without palaces. All palaces were recovered from sites over 20 ha. It is clear that Large Sites have higher Gini values. Although palaces make a difference to the overall numbers, this trend is still visible when they are excluded, indicating that the Large Sites have greater inequality within classes even outside the elite. The distributions of values for Medium and Small Sites are very similar. Although there is a much wider range in the smallest sites, this may in part be attributed to their greater abundance in the dataset.
Box and whisker plots of median Gini values for each settlement size category. (Large, greater than 20 ha; Medium, 5–20 ha; Small, under 5 ha; with two categories for large sites, one including palaces and one excluding them.)
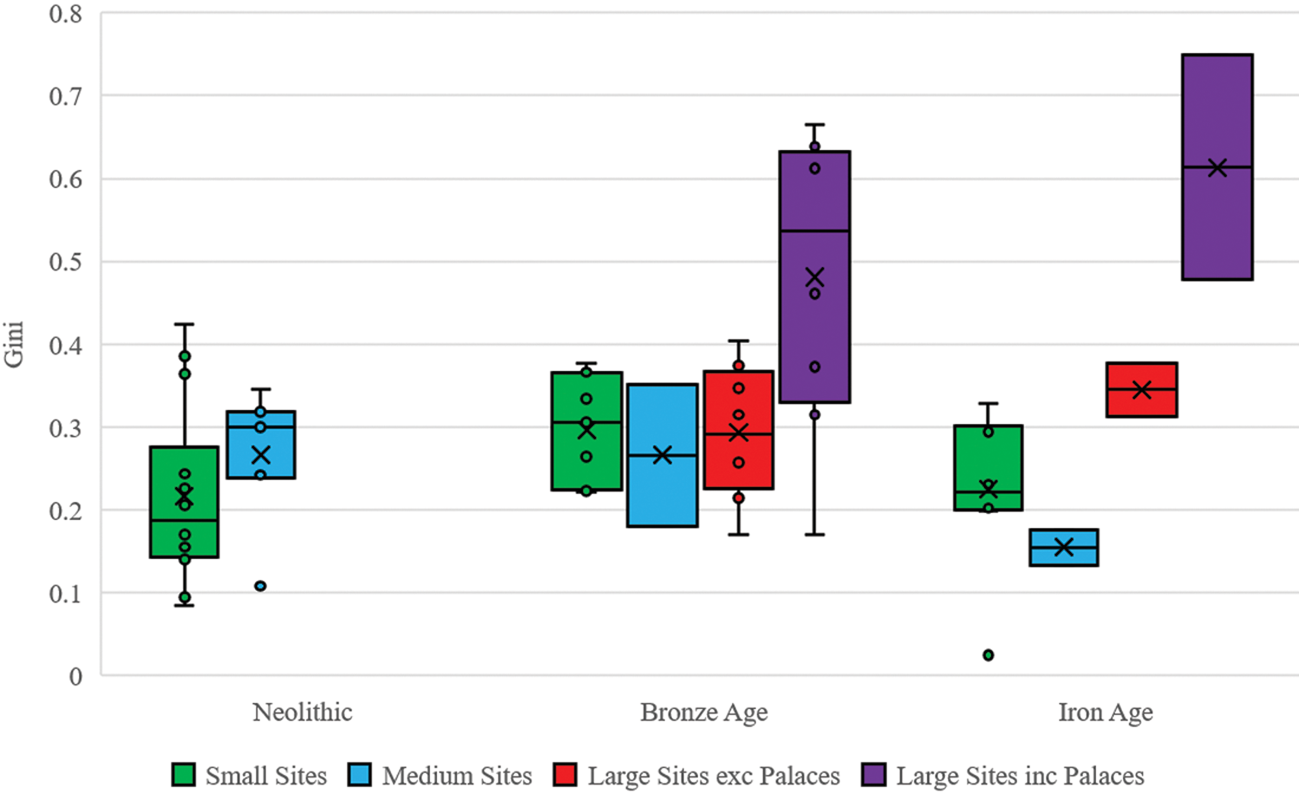
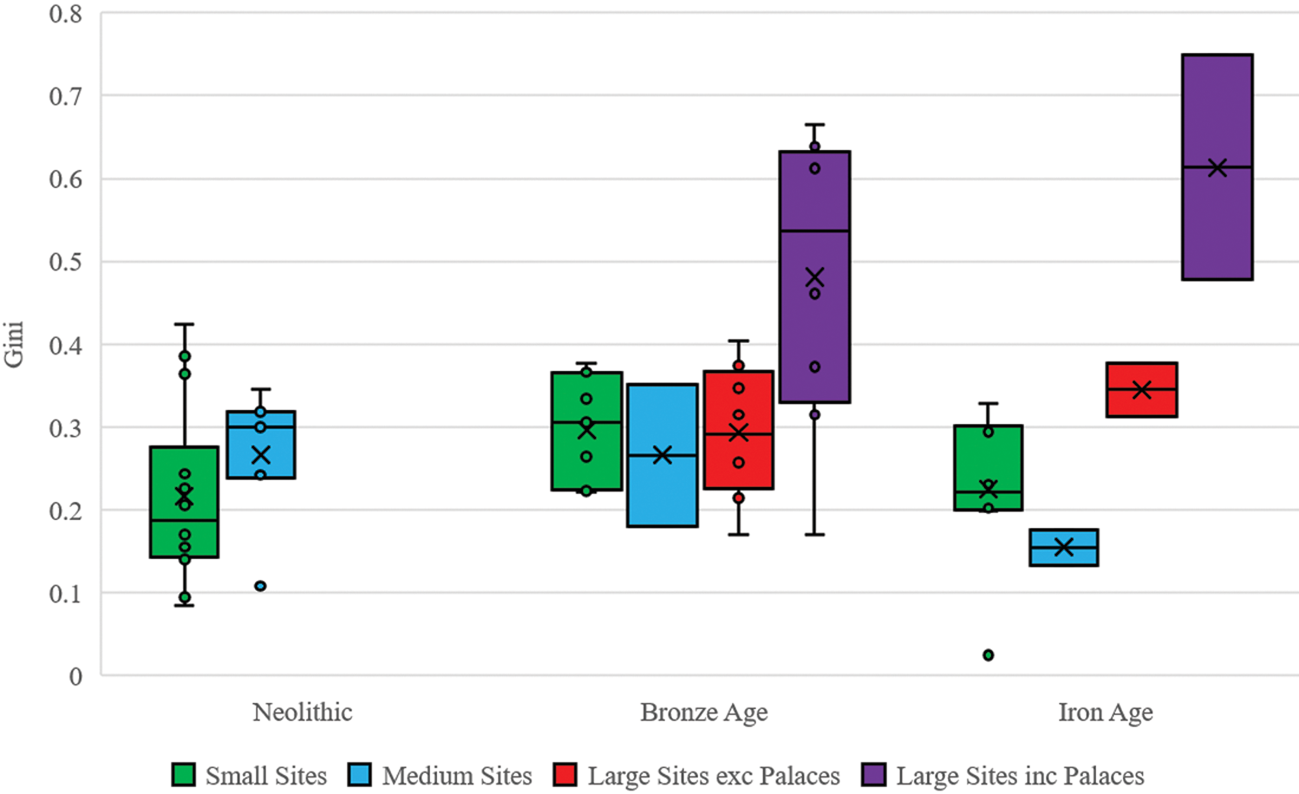
Examining average Gini values for the different settlement types during each of the three periods in our chronology (Figure 6) again shows the importance of palaces, especially during the Bronze Age. Strikingly, the Bronze Age values for Large Sites without palaces are very similar to those for the two smaller size categories, although the range is wider. The different site sizes also have difference trajectories through time. While Large Sites demonstrate an overall increase following their appearance in the Bronze Age, Gini values in Small and Medium Sites decrease from the Bronze Age to the Iron Age.
Box and whisker plots of median Gini values for each settlement size category split by period. (Large, greater than 20 ha; Medium, 5–20 ha; Small, under 5 ha; with two categories for large sites, one including palaces and one excluding them.)
Inequality and increasing general wealth
In an article on pre-industrial inequality, Milanovic and colleagues (2010) develop the concept of the inequality possibility frontier (IPF) (see also Milanovic Reference Milanovic2006). They show that as the surplus production available within a society to be distributed increases, the possible degree of inequality also increases, such that ‘the maximum attainable inequality is an increasing function of mean overall income’ (Milanovic et al. Reference Milanovic, Lindert and Williamson2010, 256). The IPF threshold is a useful concept because it can tell us where social or political forces which promoted the mitigation of inequality may have been in operation. If we assume that by default inequality pushes towards the maximum possible, then cases where it is significantly lower than this must be the result of mechanisms which temper its growth. Milanovic et al. rely on total income estimates for different societies to assess the maximum possible inequality. Such data are not readily available for our area, although future work based on agricultural production models may enable us to give rough estimates (see Leppard Reference Leppard2019 for an initial attempt in this area). We can examine the relationship between total wealth and inequality using our dataset by comparing Gini values with average house size. Here we assume that average house size across a site represents a proxy for average wealth. Such an approach is problematic, in that it does not take into account local social and environmental factors which may constrain house size (e.g. settlement density, building techniques such as mud brick or stone blocks, the availability of large trees for roofing timbers etc.). However, it does rely on the same premise as the Gini value assumption, that house size is a reasonable proxy for wealth.
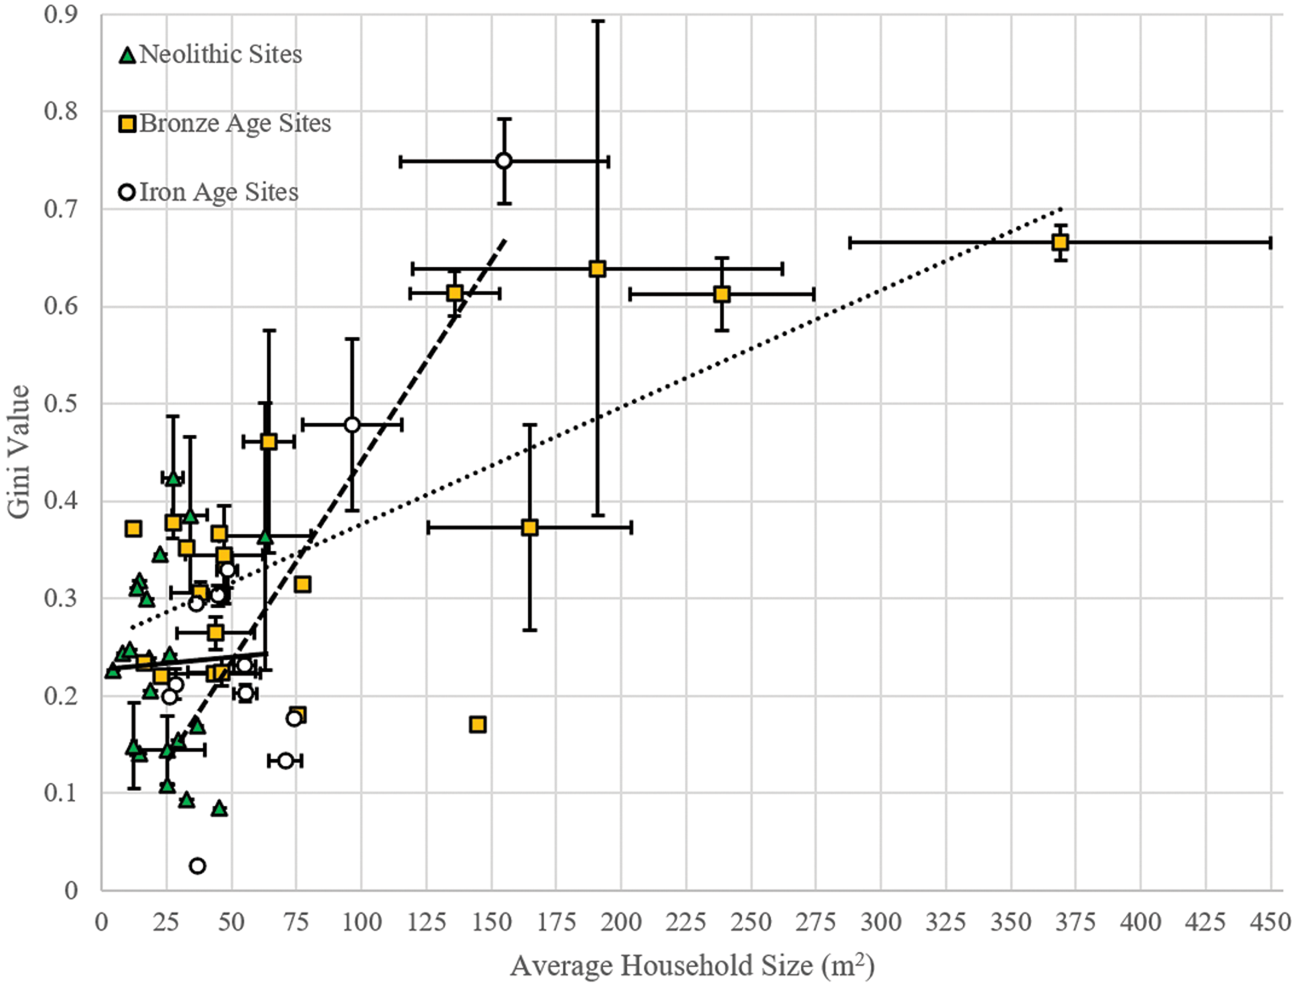
Given the significant shifts in technology and scales of infrastructure, social organization and population during the period from the Neolithic to the Iron Age, we might expect productivity, and therefore wealth, to increase through time. Average house size has been used as proxy for wealth in a range of archaeological contexts (Lobo et al. Reference Lobo, Bettencourt, Smith and Ortman2019; Ortman & Coffey Reference Ortman and Coffey2017; Ortman et al. Reference Ortman, Cabaniss, Sturm and Bettencourt2015; Reference Ortman, Davis, Lobo, Smith and Bettencourt2016), so this change should show in our data as an increase in average house size through time. The results presented here (Fig. 7) do not conform with this hypothesis as the main cluster includes sites dated to all periods. We also see differences in the strength of the relationship between Gini and house size through time. During the Neolithic the relationship is very weak, perhaps suggesting that mechanisms for limiting inequality were present, and stronger at some sites than at others. During the Bronze and Iron Ages, several sites emerge which do have greater wealth and higher levels of inequality. All of these are within our Large site category, while the Small and Medium sites remain within the main cluster, exhibiting similar values to the Neolithic. Although some of this difference may relate to the effect of palaces on the figures, it is worth noting that even large sites without palaces, such as Tell Taya, had larger average house sizes than contemporary rural sites. The trend line for Bronze Age sites is considerably steeper than that of the Neolithic, and there is a further increase in the Iron Age.
Scatter graph of Gini values per site by average household size per site. Colours denote period (Neolithic, Bronze and Iron Ages). Linear trendlines are given for each period (solid line = Neolithic; dotted line = Bronze Age; dashed line = Iron Age).
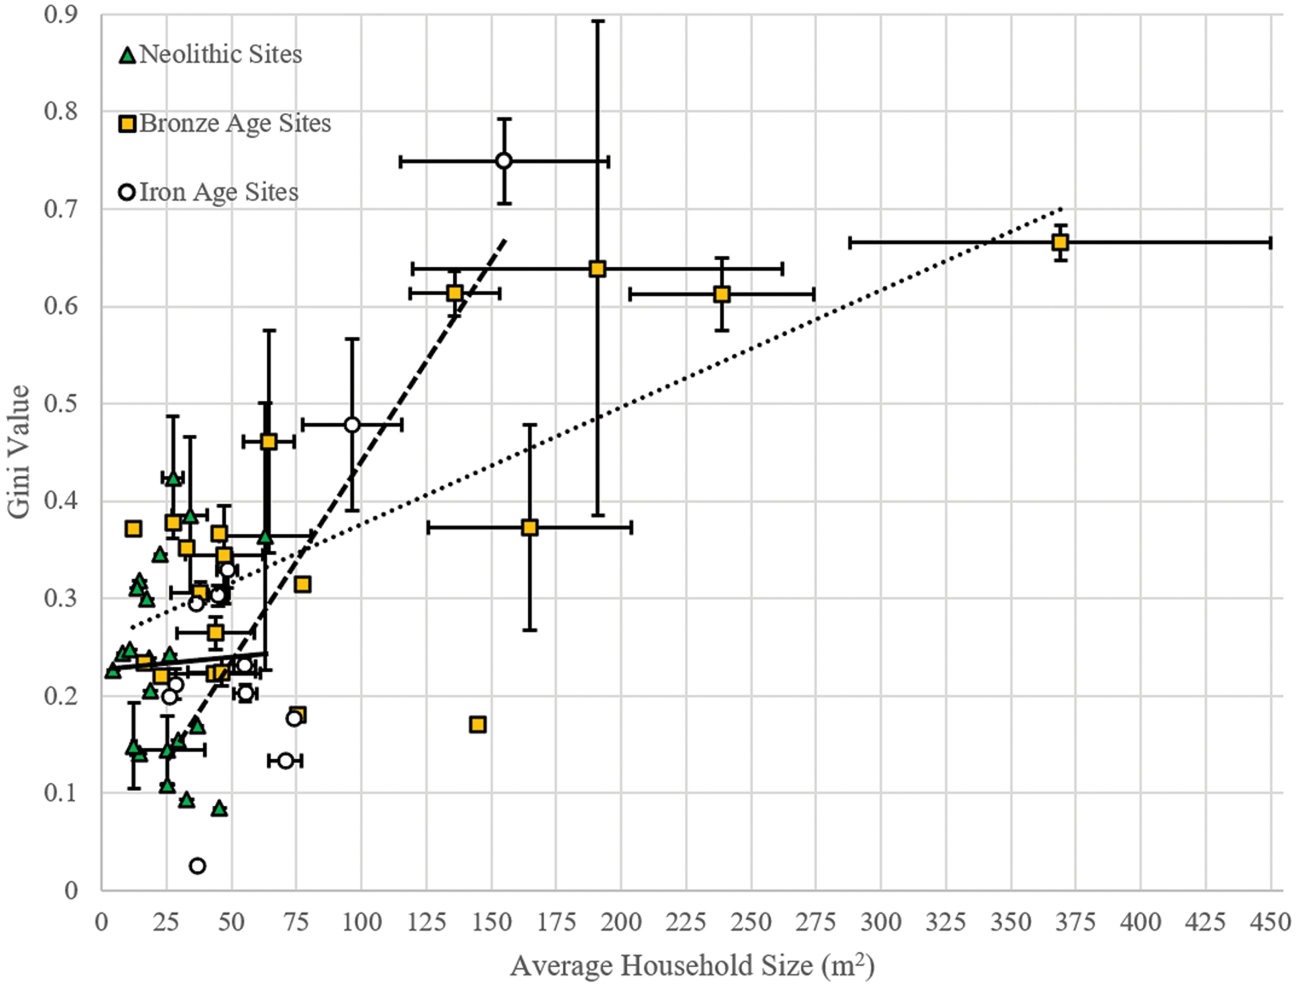
We argue that this disparity may reflect changes in political economy through time, such that the surpluses generated by increased agricultural productivity after the Neolithic were increasingly captured by occupants of the newly emerging large sites. The mechanisms by which this capture occurred could have included taxation and redistribution or more market-based systems, and seem to have benefited specialized non-agrarian workers as well as elites. Unfortunately our dataset is too small to tease out these differences, but it is noteworthy that shifts seem to occur between each of the three periods discussed in this study.
Discussion: inequality and complexity
The application of Gini values to house size has produced results which both conform to our current narratives for the emergence of complex societies in this region and provide further avenues for research. One surprising outcome from our sample is the level of inequality which was already present during the Neolithic period. The values attained seem much higher than we might expect, with those of Tepe Gawra and later phases of Çayönü comparable to those obtained for the year 1820 ad by some estimates (Milanovic Reference Milanovic2009). Recent work has argued that certain kinds of inequality may have been established by the Upper Palaeolithic, perhaps on seasonal or other short-term bases (see Wengrow & Graeber Reference Wengrow and Graeber2015 for examples). We have not sought to include Palaeolithic house data in our sample, in part because there are so few sites with relevant datasets in our region. We might also speculate that the sorts of short-term seasonal or cyclical hierarchies described by Wengrow and Graeber are unlikely to be manifested in the more durable aspects of the built environement. By contrast, the levels of inequality already in place in our earliest sites, and the permanence of the structures, suggest that inequality was already well established. Across the period we see a gradual increase in inequality, as a result of the appearance of a small number of relatively unequal sites within the sample (Tepe Gawra & Çayönü) rather than the disappearance of more ‘egalitarian’ sites. This increase supports the interpretations made by Wright (Reference Wright2014) and Kuijt et al. (Reference Kuijt, Guerrero, Molist and Anfruns2011), who have both used different archaeological proxies (food-processing tools and burial data respectively) to argue for the emergence of inequality within the later stages of Neolithic. Additionally, if we accept that IPF is a reliable concept for understanding the maximum limits of socio-economic inequality, our results also show that certain Neolithic sites were somehow able to prevent the accumulation of wealth by a select few individuals.
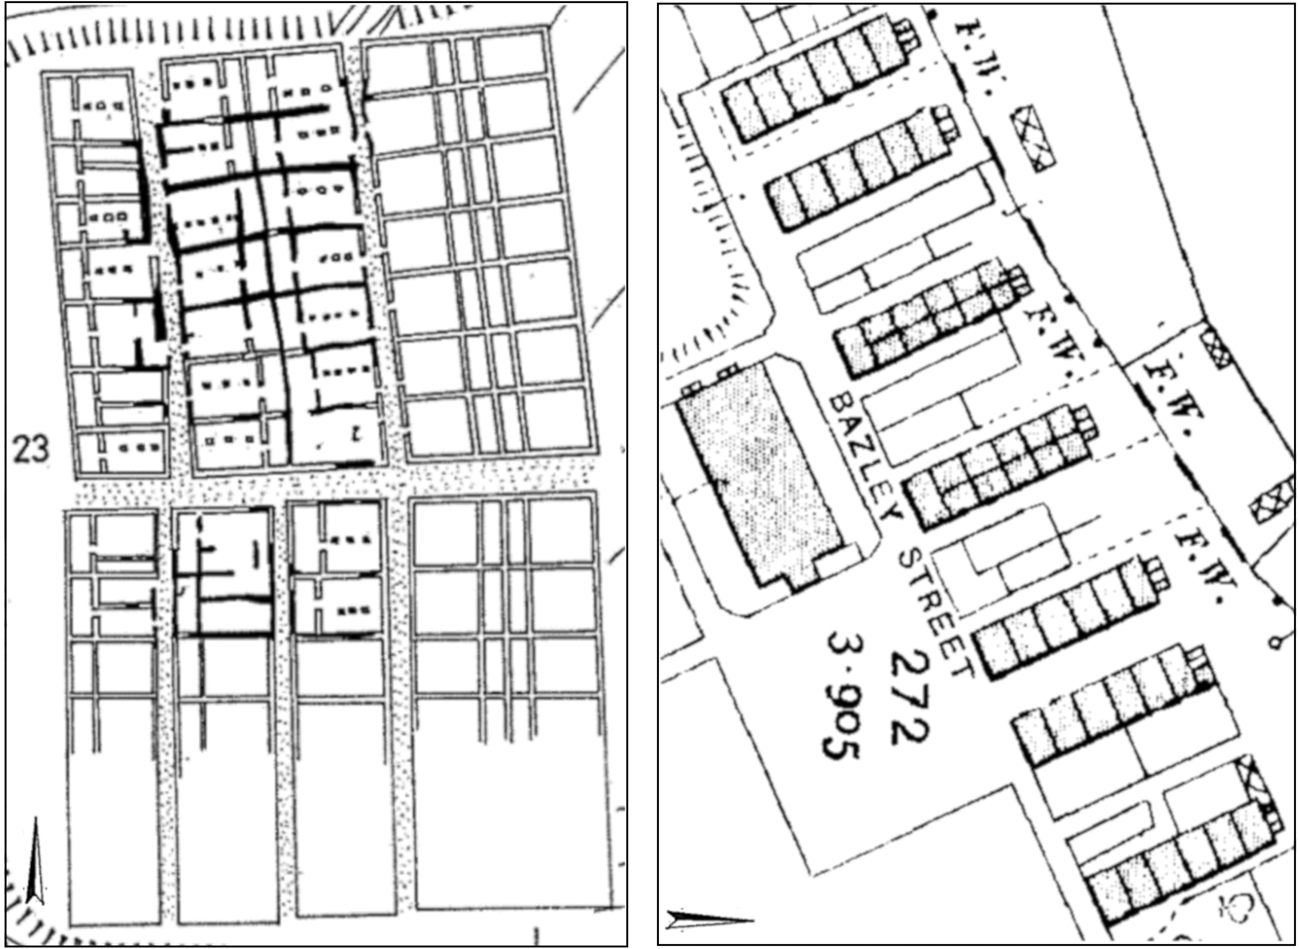
Inequality increases in the Bronze Age, when the first cities are included in our sample. These cities show higher levels of both wealth and house size inequality than towns and rural sites when palaces are taken into account, but the difference in inequality all but disappears when palaces are removed. This suggests similar ranges of social classes were present in both rural and urban sites during the Bronze Age, with the exception of elites. We might argue that this is to be expected during a period of predominantly city-state scale entities, when production was generally organized at a household level and urban sites functioned primarily as centres of power. This situation changes as we move into the Iron Age, as inequality within urban settlements increases dramatically (even excluding palace data) and rural sites become more equal. We suggest that this is a result of the consolidation of wealth and power in urban centres, leading to declines in rural inequality but also rural wealth. The households at the small rural site of Tell es-Sa'idiyeh in Israel-Palestine are almost identical both in shape, size and arrangement, bringing to mind workers’ houses of Victorian period Britain (Fig. 8) (Timmins Reference Timmins2013). Tell es-Sa'idiyeh was part of the Kingdom of Israel during the occupation of Stratum V (Herzog Reference Herzog1997, 221, 232–4), alongside several other contemporary sites with relatively low Gini values such as Beer-Sheba, Tell en-Nasbeh and Tell Beit Mirsim (Herzog Reference Herzog1997; Herzog & Singer-Avitz Reference Herzog and Singer-Avitz2016; Schloen Reference Schloen2001). As these kingdoms took control of larger and larger territories, socio-economic inequality was no longer being manifested just within a site but rather throughout the settlement system. Variation in social classes became concentrated in urban centres, while rural sites became less diverse and more dependent on urban-based specialists and services. These changes coincide with a dramatic reorganization of the countryside in a process Wilkinson termed ‘the Great Dispersal’ (Wilkinson Reference Wilkinson2003; Wilkinson et al. Reference Wilkinson, Ur, Wilkinson and Altaweel2005), when the Bronze Age tell-based settlement systems were replaced by new more dispersed sites. Such changes have been linked to shifts in land tenure (Wilkinson Reference Wilkinson, Bolger and Maguire2010), new market-based opportunities afforded by large-scale political units and deliberate planning by imperial elites (see papers in Düring & Stek Reference Düring and Stek2018). The increased spatial scale of the polities involved also probably means that we are underestimating the level of inequality. We might expect wealth from across the region to accrue in the capitals of the major empires which operated during this period, such as Nineveh, Babylon, Assur or Hattusa, none of which are included in our sample. Even assuming that the levels of inequality presented here represent minima, the shift from the Bronze Age to the Iron Age is striking. In a rather different context, Milanovic (Reference Milanovic2013) has shown that the colonial possessions of the major Western powers during the eighteenth and nineteenth centuries exhibited very high levels of inequality. The degree of power imbalance between colonizer and colonized visible during that period is very unlikely to have been matched in the more distant past. However, many ancient empires do show evidence for different strategies for incorporating conquered territory (vassal kings, local administrators, imposed bureaucracies, etc.) associated with specific forms of imperial-scale extractive practices (Altaweel & Squitieri Reference Altaweel and Squitieri2018; Düring & Stek Reference Düring and Stek2018). Some scholars have even suggested similar forms of settler colonialism to those practised by Western powers during the eighteenth and nineteenth centuries may have existed in the past (Pitkänen Reference Pitkänen2019). It would be interesting to examine the relationship between the form of imperial control exercised in a region and the level of inequality, to understand whether the pattern identified by Milanovic represents the apotheosis of a long-term pattern of imperial organization or a novelty specifically associated with the Western imperial moment.
Left: Row houses in Tell es-Sa'idiyeh Stratum V. (Courtesy of Ze'ev Herzog, Tel Aviv University, from Herzog Reference Herzog1997). Right: Workers’ houses at Barrow Bridge. (Basri, P., ‘Workers’ Houses at Barrow Bridge’, TIFF map, Scale 1:1250, Ordnance Survey 1900, using Digimap Ordnance Survey Collection, https://digimap.edina.ac.uk/, created 30 August 2019.)

Conclusion
This paper has used Gini coefficient calculations on past household size to create a long-term chronology of inequality between the Neolithic and the Iron Age in the Near East. While it is not possible to assess the method used objectively, we can say that the results broadly conform to what we might expect given current (pre)historical narratives for the region. The Gini values show that inequality increased from the Neolithic to the Iron Age, and we have linked this increase to changing forms of social and political organization. We see a step change in levels of inequality around the time of the widespread emergence of urban sites at the beginning of the Bronze Age. When palaces are included, the urban sites appear to be the main drivers of the increased Gini values, but removing the palaces shows that urban and rural sites give similar values, implying that the vast majority of the inhabitants of each encompassed a similar range of wealth levels. The situation changes during the Iron Age, when the relative Gini values suggest inequality in urban environments increases and rural sites become more equal. This shift in the scale of inequality from individual sites to larger settlement systems coincides with broader changes in settlement patterns, trade networks and the ability of elites and institutions to project political power over long distances and across large areas of the landscape.
Although our results suggest the use of Gini coefficients on household sizes has some value, there is a range of problems with the metric. The most significant problem is simply the paucity of data, meaning the lack of well-published excavations of large areas of domestic structures. As discussed above, this is in part a product of the nature of the archaeology in the study region, as multi-phased mounded sites preclude the uncovering of large areas. Research trajectories and publication standards over the last 150 years, including up to the present day, are also to blame, particularly the focus on large sites and monumental architecture, and the absence of overall site plans. Remedying this situation will require sustained attention from the archaeological community towards single-phase exposures of domestic structures, something which would take many years to achieve. Geophysical prospection, and perhaps drone survey in areas such as southern Iraq, on single-phase sites may also provide relevant information. Several excavations which probably did uncover large areas are still unpublished, and it is hoped that our dataset can be expanded as these become available.
Beyond increasing the size of the archaeological dataset, progress could be made by combining the method used here with data derived from other approaches. Future work in this area could examine house value in a more nuanced fashion by taking into account location within a settlement or access to services such as religious buildings or markets. It would also be interesting, though challenging, to develop metrics capable of valuing material culture found within households, burials, or even institutions, which could then be used to generate Gini values, and some work has begun in this area (Fochesato et al. Reference Fochesato, Bogaard and Bowles2019). Comparing inequality levels to data on productive capacities of different landscapes and technological regimes would shed light on relationships between levels of surplus generation and redistribution. Here theoretical concepts such as Milanovic's Inequality Probability Frontier become useful, since they allow us to move from description to analysis. The results presented here using the IPF framework are necessarily preliminary because key information needed to deepen this analysis, such as the total wealth present within a society, are not readily available at present, but they do show that tapping into the theoretical literature on present-day inequality can be fruitful. While the use of modern models developed for capitalist economies to investigate pre-capitalist, and even prehistoric, societies is not straightforward (see Algaze Reference Algaze2018 and Leppard Reference Leppard2019, both with comments), identifying how and why such models do not apply can be productive in its own right. Developing appropriate proxies for the inputs used in better-documented societies is a key component of this project. Although there will always be social groups who remain beyond the reach of a method centred on households, likely to be those with the lowest access to wealth and power, the approach taken here gives us a foundation from which to build.
Supplementary material
The supplementary material for this article can be found at https://doi.org/10.1017/S0959774320000177.
Acknowledgements
PB performed the analyses as part of his MA dissertation in the Department of Archaeology at Durham University. DL supervised the dissertation and contributed archaeological expertise. Both authors wrote parts of the paper. We would like to thank Dr Marco Nebbia and Dr Andrew Millard for technical assistance. Two anonymous reviewers substantially improved the paper and we thank them for their comments. This project has received funding from the European Research Council under the European Union's Horizon 2020 research and innovation programme, grant agreement No 802424, award holder Dr Dan Lawrence.