1 Introduction
Inlet unstart refers to the disgorging of the shock system in a scramjet engine inlet (Heiser & Pratt Reference Heiser and Pratt1994; Emami et al. Reference Emami, Trexler, Auslender and Weidner1995). It is one of the critical phenomena that dictate the performance of hypersonic vehicles. Unstart induces severe flow fluctuations leading to unsteady thermal and aerodynamic loading to the vehicle structure. When the inlet is unstarted, there is a spillage of the oxidizer at the lip of the inlet resulting in the loss of thrust. The recent X-51A scramjet test failure, for example, was caused by unstart (Norris Reference Norris2011). The thermal choking triggered by excessive heat release in the combustor has been known as a cause of unstart (Mashio et al. Reference Mashio, Kurashina, Bamba, Okimoto and Kaji2001). McDaniel & Edwards (Reference McDaniel and Edwards2001) revealed that the pressure rise from the thermal choking was followed by a boundary layer separation in their computation. The rising pressure cascades into large-scale disturbances, and induces the blockage of the inlet flow. The disturbances propagate upstream as an unstart shock. Curran, Heiser & Pratt (Reference Curran, Heiser and Pratt1996) showed that the unstart shock system may be anchored and stabilized in the isolator placed between the inlet and combustor. However, when further heat release increases the downstream pressure, the unstart shock is pushed out of the inlet, leading to inlet unstart.
Flow behaviours during the unstart process have largely been investigated in low-enthalpy supersonic flow conditions. Although high-enthalpy conditions represent more realistic flight conditions, experiments at these conditions have rarely been conducted due to the difficulties in providing steady, high-enthalpy supersonic flows. Nevertheless, conducting experiments in low-enthalpy conditions can contribute to the understanding of the unstart process. For instance, researchers have used mechanical throttling of the flow (Wieting Reference Wieting1976; Rodi, Emami & Trexler Reference Rodi, Emami and Trexler1996; Tan & Guo Reference Tan and Guo2007; Wagner et al. Reference Wagner, Yuceil, Valdivia, Clemens and Dolling2009) or of the mass addition (Do et al. Reference Do, Im, Mungal and Cappelli2011a ,Reference Do, Im, Mungal and Cappelli b ) to mimic combustion-driven heat release. These studies revealed that a pressure rise downstream of the scramjet flow chokes the supersonic flow and spawns the unstart shock system propagating upstream. Transient and quasi-steady behaviours in the propagation of the unstart shock system were reported by Wagner et al. (Reference Wagner, Yuceil, Valdivia, Clemens and Dolling2009) and Do et al. (Reference Do, Im, Mungal and Cappelli2011b ). The unstart shock system induced by a downstream pressure rise propagates continuously upstream, except when it encounters a local favourable pressure gradient (Do et al. Reference Do, Im, Mungal and Cappelli2011a ). The localized favourable pressure gradient formed by a series of shock trains or the jet increases the local choking threshold. As a result, the unstart shock system is temporarily retained at a certain location with the localized favourable pressure gradient, leading to quasi-steady motion of the flow. Once the pressure rise becomes sufficient to overcome the pressure gradient, the unstart shock system moves upstream again. Eventually, the unstart shock system propagates toward the upstream of the inlet and disgorges the designed flow. After the completion of unstart, a severe oscillation in the wall surface pressure is observed (Tan & Guo Reference Tan and Guo2007; Wagner et al. Reference Wagner, Yuceil, Valdivia, Clemens and Dolling2009). Based on the findings from the previous research in low-enthalpy flows, there have been various studies on avoiding or delaying inlet unstart by using isolators (Curran et al. Reference Curran, Heiser and Pratt1996; Sato et al. Reference Sato, Izumikawa, Tomioka and Mitani1997; Wang & Le Reference Wang and Le2000; Tam, Eklund & Behdadnia Reference Tam, Eklund and Behdadnia2008), boundary layer bleedings (Kodera et al. Reference Kodera, Tomioka, Kanda, Mitani and Kobayashi2003), vortex generators (Valdivia et al. Reference Valdivia, Yuceil, Wagner, Clemens and Dolling2014) and plasma actuators (Im, Do & Cappelli Reference Im, Do and Cappelli2012). Although studies in cold flows have provided a broad knowledge on unstart, we still need to fully understand the unstart process driven by combustion for practical applications.
Thermal chocking behaviours and flow fluctuations at the onset of, and after, unstart have been observed (Shimura et al. Reference Shimura, Mitani, Sakuranaka and Izumikawa1998; O’Byrne et al. Reference O’Byrne, Doolan, Olsen and Houwing2000), but there is still no comprehensive explanation of them because of the limited understanding based on low frame-rate imaging flow diagnostics. There have been attempts to investigate scramjet model unstart in high-enthalpy conditions which represent more realistic flight conditions (see Laurence et al. Reference Laurence, Karl, Schramm and Hannemann2013, Reference Laurence, Lieber, Schramm, Hannemann and Larsson2015; Liu et al. Reference Liu, Passaro, Baccarella and Do2014). These have provided extensive explanations of the transient and quasi-steady behaviours in fluid combustion phenomena driven by combustion using time-resolved imaging and pressure/temperature measurements. Although further understanding of unstart at more realistic conditions have been provided by the recent studies, a comprehensive explanation of the whole process from choking to complete unstart has not yet been made. This is mainly because Laurence et al. (Reference Laurence, Karl, Schramm and Hannemann2013) and Laurence et al. (Reference Laurence, Lieber, Schramm, Hannemann and Larsson2015) mostly investigated the onset of unstart during a limited useful test time (order of millisecond) and Liu et al. (Reference Liu, Passaro, Baccarella and Do2014) focused solely on flame-flow dynamics, which represent the limitations of the studies.
In the current study, we discuss unstart phenomena in both low- and high-enthalpy flow conditions. Mass addition and heat release are used to induce unstart in low- and high-enthalpy flow conditions, respectively. Details of the flow features occurring during the unstart process can be obtained in low-enthalpy flow conditions due to the ease of implementation of diagnostics. Experiments in high-enthalpy flow conditions, on the other hand, will provide a more realistic unstart process. Therefore, an integration of findings from the two different flow conditions will contribute to a comprehensive understanding of the whole unstart process such as choking mechanisms, transient and quasi-steady shock propagations, unstart threshold and oscillatory motion.
Experiments in the current study were carried out in an arc-heated hypersonic wind tunnel that is capable of providing a significantly longer useful test time compared to the test time at a shock-tunnel-type high-enthalpy flow facility. The obtained flow visualization and pressure traces were used to explain the flow choking mechanism. The Korkegi criterion and a simplified one-dimensional (1-D) analysis were used as guidelines to explain the choking mechanism. The Korkegi criterion was proposed by Korkegi (Reference Korkegi1975) to relate turbulent flow separation to the local pressure ratio between upstream and downstream. McDaniel & Edwards (Reference McDaniel and Edwards2001) and Wagner et al. (Reference Wagner, Yuceil, Valdivia, Clemens and Dolling2009) reported that unstart is directly related to the flow separation. On the contrary, Laurence et al. (Reference Laurence, Karl, Schramm and Hannemann2013) observed that unstart is triggered by thermal choking by comparing the theoretical pressure ratios to the measured pressure ratio. Although Laurence et al. (Reference Laurence, Karl, Schramm and Hannemann2013) concluded that thermal choking plays a primary role in the onset of unstart, they also observed flow separation during unstart shockwave propagation. In the current study, it is found that the pressure rise downstream should be high enough to induce boundary layer separation for unstart but is not necessarily higher than the pressure rise from thermal choking. Therefore, the Korkegi criterion is used to discuss the choking mechanism.
It should be noted that scramjet unstart is caused by multiple flow choking mechanisms such mass addition, heat release and flow blockage, which makes a simplified analysis challenging. However, all flow choking mechanisms can be counted as a pressure rise by using simplified 1-D analysis. Although accurate predictions of flow choking cannot be made through 1-D analysis, the simplified analysis provides a general understanding of unstart triggering mechanisms.
The overall experimental set-up, test model and test conditions of the current study are described in § 2. Unstart driven by mass addition in both low- and how-enthalpy flow conditions is discussed in § 3. Then, combustion-driven unstart is presented in § 4. In § 5, choking mechanisms in three different flow conditions are compared and discussed using simplified 1-D analysis. The summary and conclusions of the study are discussed in § 6.
2 Experimental set-up
2.1 Facility
An arc-heated hypersonic wind tunnel was used to perform the experiments. The pulsed arc-heating system is capable of providing a wide range of total enthalpy flows up to
 $6~\text{MJ}~\text{kg}^{-1}$
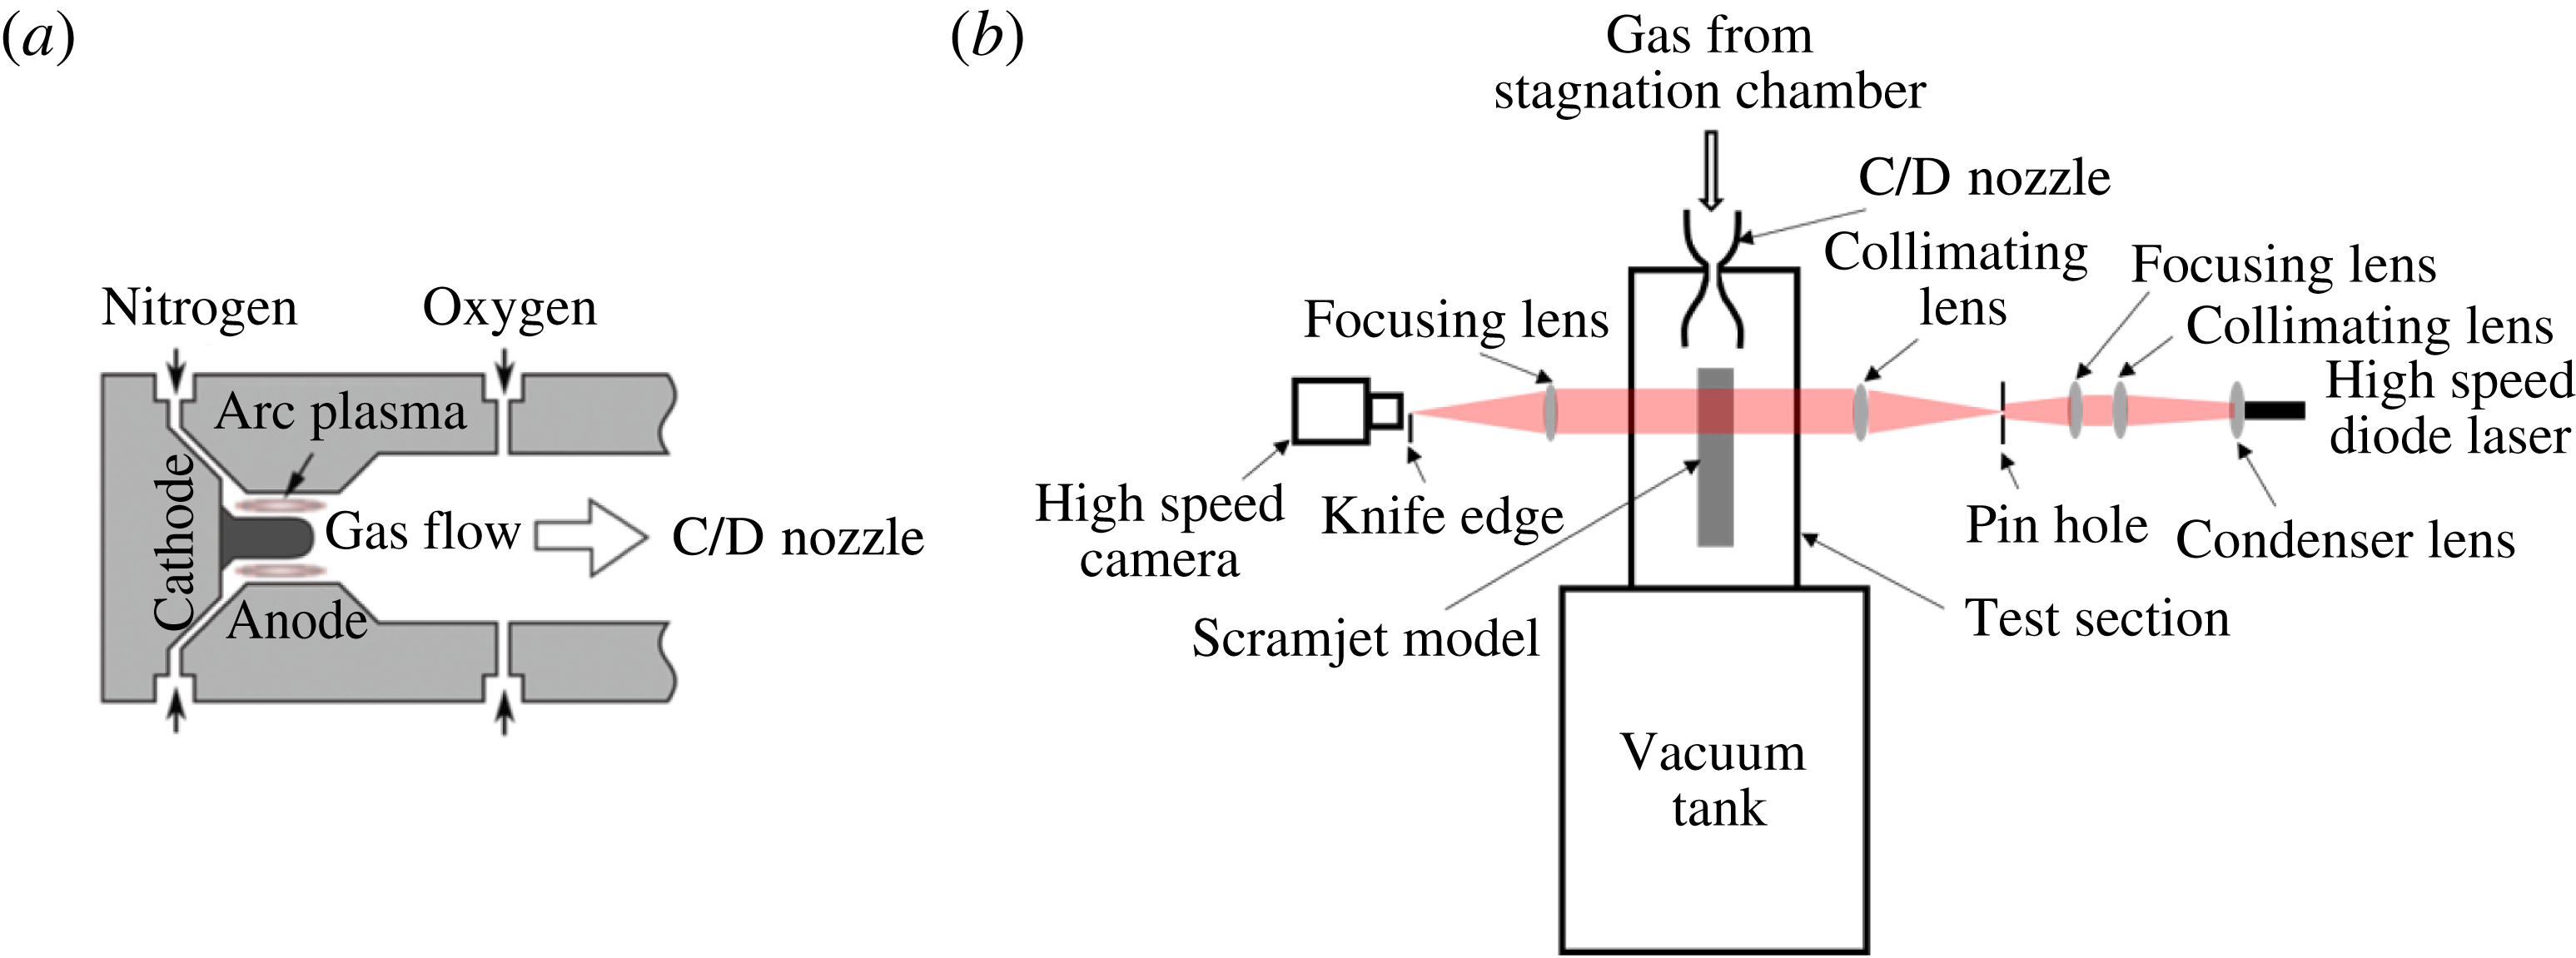
. Two compressed gas reservoirs connected to the arc heater supplied constant pressure gas flows as depicted in figure 1: one reservoir contained nitrogen that was injected into an arc region and the other contained oxygen supplied into the gas mixing chamber. By using a system introducing nitrogen and oxygen separately, NO
 $_{x}$
production in the arc region, which affects flame dynamics, was minimized. Also, thermal NO
 $_{x}$
production in the chamber was minimized effectively by reducing the flow residence time in the chamber. The details of the arc-heating system are provided in Liu et al. (Reference Liu, Passaro, Baccarella and Do2014) and Baccarella et al. (Reference Baccarella, Liu, Passaro, Lee and Do2016). The pressure in the plenum chamber was measured by a Kulite piezo-resistive pressure transducer with an uncertainty of 1 %. The total pressure could be adjusted between 0.5 and 7.0 bar. The arc-heating and plenum chamber system produced gas flows at a steady state in the test section for approximately 1 s of usable test time. The mean test condition is repeatable to within 2 % run-to-run variations in stagnation pressure and arc current/voltage input.
Schematics of (a) a gas feeding system (b) overall experimental set-up.

The overall experimental set-up downstream of the arc heater and the plenum chamber is illustrated in figure 1. At the downstream of the plenum chamber, the gas was accelerated through a converging/diverging nozzle to a Mach 4.5 flow. The spatial distribution of the Mach number across the nozzle exit was measured by using a supersonic pitot probe. The Mach number distribution at the nozzle exit was relatively uniform, with a random variation of a maximum of 5 % of the mean value. The nozzle was coaxially connected to the test section; a cylindrical stainless steel vacuum vessel with 0.65 m internal diameter and 1.5 m length. Three optically accessible windows allowed a full view of the model scramjet inlet/combustor, placed downstream of the nozzle exit, from the top and the lateral sides. Only two side windows were used for flow visualization throughout the study. The test section was directly attached to a larger vacuum tank with a total volume of approximately 10 m
 $^{3}$
.
A conventional dual field lens high-speed schlieren imaging system was used to visualize the flow features of unstart. An incoherent laser light from a high-speed diode laser (Cavilux Smart 640 nm) was focused onto a pin-hole aperture by a focusing lens system to generate a point light source, as seen in figure 1. Then, the light was collimated by a 75 mm diameter field lens. The light passed through the test section was focused onto either a horizontal or vertical knife edge. The images presented in the current study used the horizontal knife-edge configuration unless otherwise noted. The monochromatic light beyond the knife edge was captured by a Photron Fastcam APX Ultima camera equipped with a bandpass filter, 640 nm
 $\pm$
12 nm (Full Width Half Max: FWHM). The frame rate of the camera was either 10 kHz or 8 kHz with a resolution of 512
 $\times$
256 pixels or 256
 $\times$
512 pixels, respectively. The 10 ns pulse width of the diode laser enabled the imaging system to freeze the flow features, resulting in sharp imaging of unsteady flows.
2.2 Test model
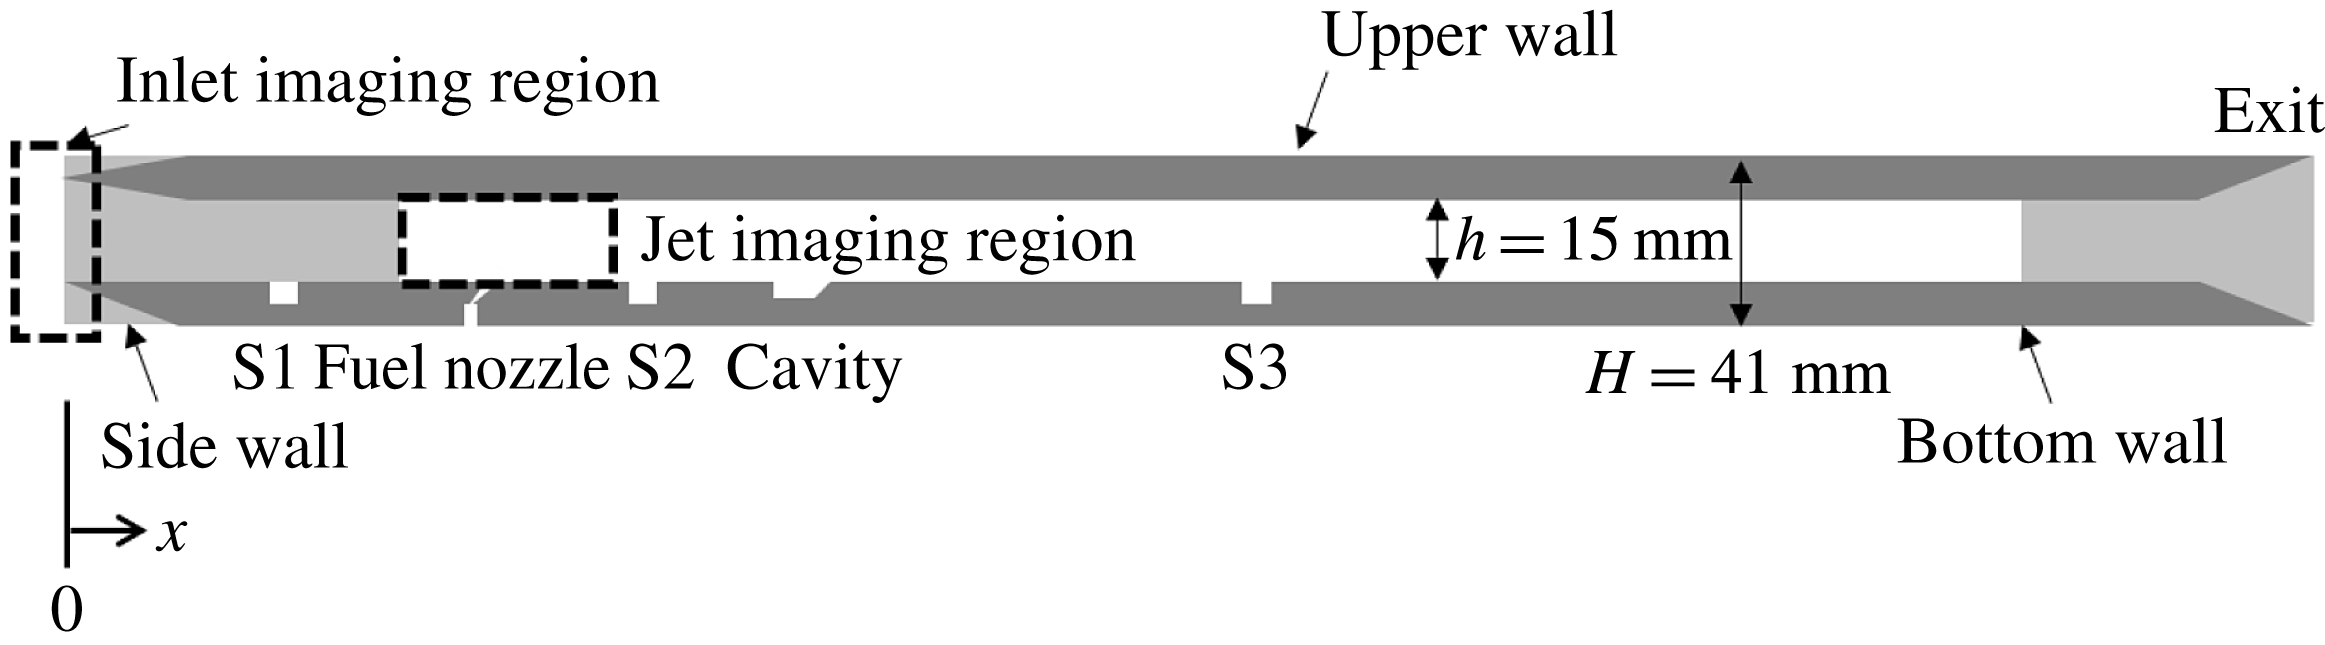
A model scramjet made of stainless steel with an internal rectangular channel of 600 mm length and 15 mm
 $\times 40$
mm constant cross-section was installed in the test section. The model is schematically depicted in figure 2. The bottom and the side lips were wedged outside and were flat on the internal surface while the top lip had a
 $6^{\circ }$
sharp wedge facing inwards to the internal channel. The side walls had optically accessible windows for flow visualization. An oblique supersonic jet of 1.6 mm in diameter at the throat with a
 $22.5^{\circ }$
divergent angle was placed 100 mm downstream of the leading edge (
 $x$
= 100 mm) on the centreline of the bottom wall. The expanding jet was used to facilitate fuel/oxidizer mixing by increasing the interaction area between the jet and the free stream. The jet was injected with a
 $60^{\circ }$
inclination towards the downstream, resulting in an ellipse shape at the jet exit,
 $5.9~\text{mm}\times 5.0$
mm. A solenoid valve controlled a quasi-steady nitrogen or ethylene jet injection duration. The mass flow rate of the jet was adjusted by changing the reservoir tank pressure.
Schematics of the scramjet model.

A wall cavity was located 100 mm downstream from the jet nozzle (
 $x=200$
mm) at the bottom wall of the model. The cavity was 3 mm in depth, 12 mm in length and had a
 $22.5^{\circ }$
back step angle ramp. Three Kulite pressure sensors of natural frequency above 150 kHz were flush mounted on the bottom wall at
 $x=60$
mm, 150 mm and 330 mm to trace the wall pressure during the tests. A temperature sensor (MEDTHERM coaxial thermocouple, type K) was placed at
 $x=60$
mm to detect the reverse propagation of the flame to the free stream direction.
Two imaging regions were chosen to visualize the flow features near the jet and the inlet of the scramjet model, as marked by dashed rectangular areas in figure 2. The imaging regions capturing the flow features near the jet and the inlet had 50 mm
 $\times$
15 mm and 15 mm
 $\times$
40 mm useful imaging area, respectively. The free stream flow direction in the schlieren images was from the left to the right, unless otherwise noted.
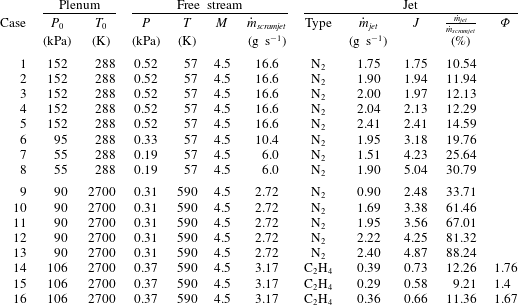
Plenum, free stream and jet conditions (note,
 $P_{0}$
: stagnation pressure,
 $T_{0}$
: stagnation temperature,
 $P$
: static pressure of free stream,
 $T$
: static temperature of free stream,
 $M$
: free stream Mach number,
 ${\dot{m}}_{\mathit{scramjet}}$
: mass flow rate captured by the model scramjet inlet,
 ${\dot{m}}_{\mathit{jet}}$
: mass flow rate of the jet,
 $J$
: jet momentum ratio,
 ${\dot{m}}_{\mathit{jet}}/{\dot{m}}_{\mathit{scramjet}}$
: mass flow rate ratio between the jet and free stream,
 ${\it\Phi}$
: overall equivalence ratio).

2.3 Test conditions
To investigate the influence of the jet momentum ratio, free stream-to-jet mass flow rate ratio and the heat exchange rate on model scramjet inlet unstart, three different flow conditions were tested: (i) low-enthalpy free stream – cold N
 $_{2}$
jet, (ii) high-enthalpy free stream – cold N
 $_{2}$
jet and (iii) high-enthalpy free stream – ethylene jet. The stagnation temperatures for low- and high-enthalpy free stream cases were fixed at 288 K and 2700 K, respectively, while the stagnation pressures of the free streams were varied from 55 kPa to 152 kPa. In all test conditions, 20 % oxygen and 80 % nitrogen by volume were supplied to the plenum. The plenum, free stream and jet injection conditions set throughout the experiments are provided in table 1. An uncertainty level of 5 % for the stagnation values was estimated, incorporating errors and temporal fluctuations in probe measurements and run-to-run variations. The mass flow rates provided in table 1 are the nominal values. It should be noted that the jet momentum ratio,
 $J=({\it\rho}u^{2})_{\mathit{jet}}/({\it\rho}u^{2})_{\infty }=({\it\gamma}pM^{2})_{\mathit{jet}}/({\it\gamma}pM^{2})_{\infty }$
, was calculated from the measured values of the free stream and jet stagnation properties in each run, not from the nominal values. Here
 ${\it\rho}$
,
 $u$
,
 ${\it\gamma}$
,
 $p$
and
 $M$
are gas density, velocity, ratio of specific heats, static pressure and Mach number of the jet (subscript jet) and of the free stream (subscript
 $\infty$
) flow, respectively. The momentum of the free stream captured by the inlet lip was estimated using the nozzle exit conditions. Since the flow reaches the position of the jet after two oblique shockwaves, deceleration was factored into the calculation. The 2-D oblique shock relations were used by assuming a quasi-2-D flow at the centre of the model scramjet cross-section. The momentum of fuel was computed by using the following equation
 $$\begin{eqnarray}P_{f}={\it\rho}_{f}V_{f}^{2}=\frac{{\dot{m}}_{f}V_{f}}{A_{f}},\end{eqnarray}$$
where
 ${\it\rho}_{f}$
is the density of the fuel,
 $V_{f}$
is the velocity at the exit of the nozzle,
 $A_{f}$
is the exit area of the fuel nozzle and
 ${\dot{m}}_{f}$
is the mass flow rate of the fuel.
 $A_{f}$
was known and
 ${\dot{m}}_{f}$
was evaluated from the pressure measurements inside the fuel tank. The typical test time for each case was approximately 200 ms.
3 Unstart driven by mass addition
Unstart induced by the mass addition into the model scramjet was investigated at both low- and high-enthalpy free stream conditions. In this section, we will discuss the transient and the quasi-steady state behaviours of the model scramjet flows.
3.1 Low-enthalpy free stream – cold N
 $_{2}$
jet

First, we focused on the low-enthalpy free stream case – cold N
 $_{2}$
jet flow condition where there is no significant heat exchange between the free stream and the jet.
3.1.1 Flow visualization and wall pressure measurements
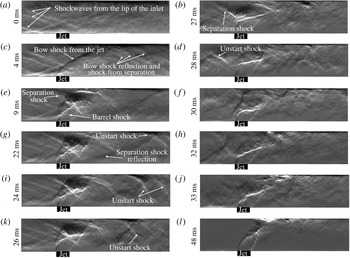
The time sequential images of the unstart process taken near the jet imaging region (
 $x=90{-}140$
mm) at a jet momentum ratio of 2.41, Case 5 in table 1, are depicted in figure 3. The time noted on each image represents the time after the jet’s first appearance in the imaging region. At 0 ms, the undisturbed flow with the reflection shocks induced by the model wedges can be seen. From the images, it is found that the jet is fully developed in approximately 9 ms after its first appearance. The following are clearly visualized when the jet was fully developed in the 9 ms image: a bow shockwave due to the jet injection, a reflection shockwave from the bow shockwave, a separation shockwave in front of the jet impinging at a point on the upper wall surface and a barrel shockwave induced by the jet. The flow in the imaging region has a quasi-steady state between 9 ms and 22 ms. It should be noted that the flow downstream of the imaging region is not quasi-steady, and this will be discussed later in this section. At 22 ms, an unstart shockwave propagates into the imaging region from downstream of the flow on the upper wall surface. Due to the effects of the impinging bow shockwave and jet onto the upper wall surface, the upper wall has thicker boundary layer than the lower wall. Consequently, propagation of the unstart shockwave along the upper wall surface is observed, as discussed in Do et al. (Reference Do, Im, Mungal and Cappelli2011a
). The pressure and shockwave propagation enlarge the separation in front of the bow-shockwave impinging point on the upper wall surface, pushing the separation shockwave upstream. Then, a series of unstart shockwaves move toward upstream at 24 ms. At 24 ms, and it is observed that the angle of the unstart shockwave steepens, indicating a larger separation at the foot of the unstart shockwave. As the unstart shockwave further propagates in the 26 and 27 ms images, the angle of the shockwave increases and the flow separation becomes more severe. Since the separated flow facilitates upstream pressure propagation, the stretch of the separation near the jet occurs in the 26 and 27 ms images, pushing the separation shockwave further upstream. From this time frame, the separation shockwave upstream of the jet now acts as an unstart shockwave propagating upstream of the flow. As a result, the series of unstart shockwaves at the downstream of the jet are merged and weakened. The new unstart shockwave, formerly the separation shockwave, gradually propagates upstream of the flow (28–37 ms) and disgorges the flow at the imaging region. The completion of the unstart process takes approximately 37 ms at this jet momentum ratio. Beyond 37 ms, the jet is injected into the low-speed free stream, as depicted in the last image of figure 3.
Time sequential images of the low-enthalpy free stream – cold N
 $_{2}$
jet flow condition during the unstart process near the jet (
 $x=90{-}140$
mm) at
 $J=2.41$
. The height of each image is 15 mm. Reference time 0 ms represents the time of jet appearance in the imaging region. See supplementary movie 1 available online at http://dx.doi.org/10.1017/jfm.2016.282.

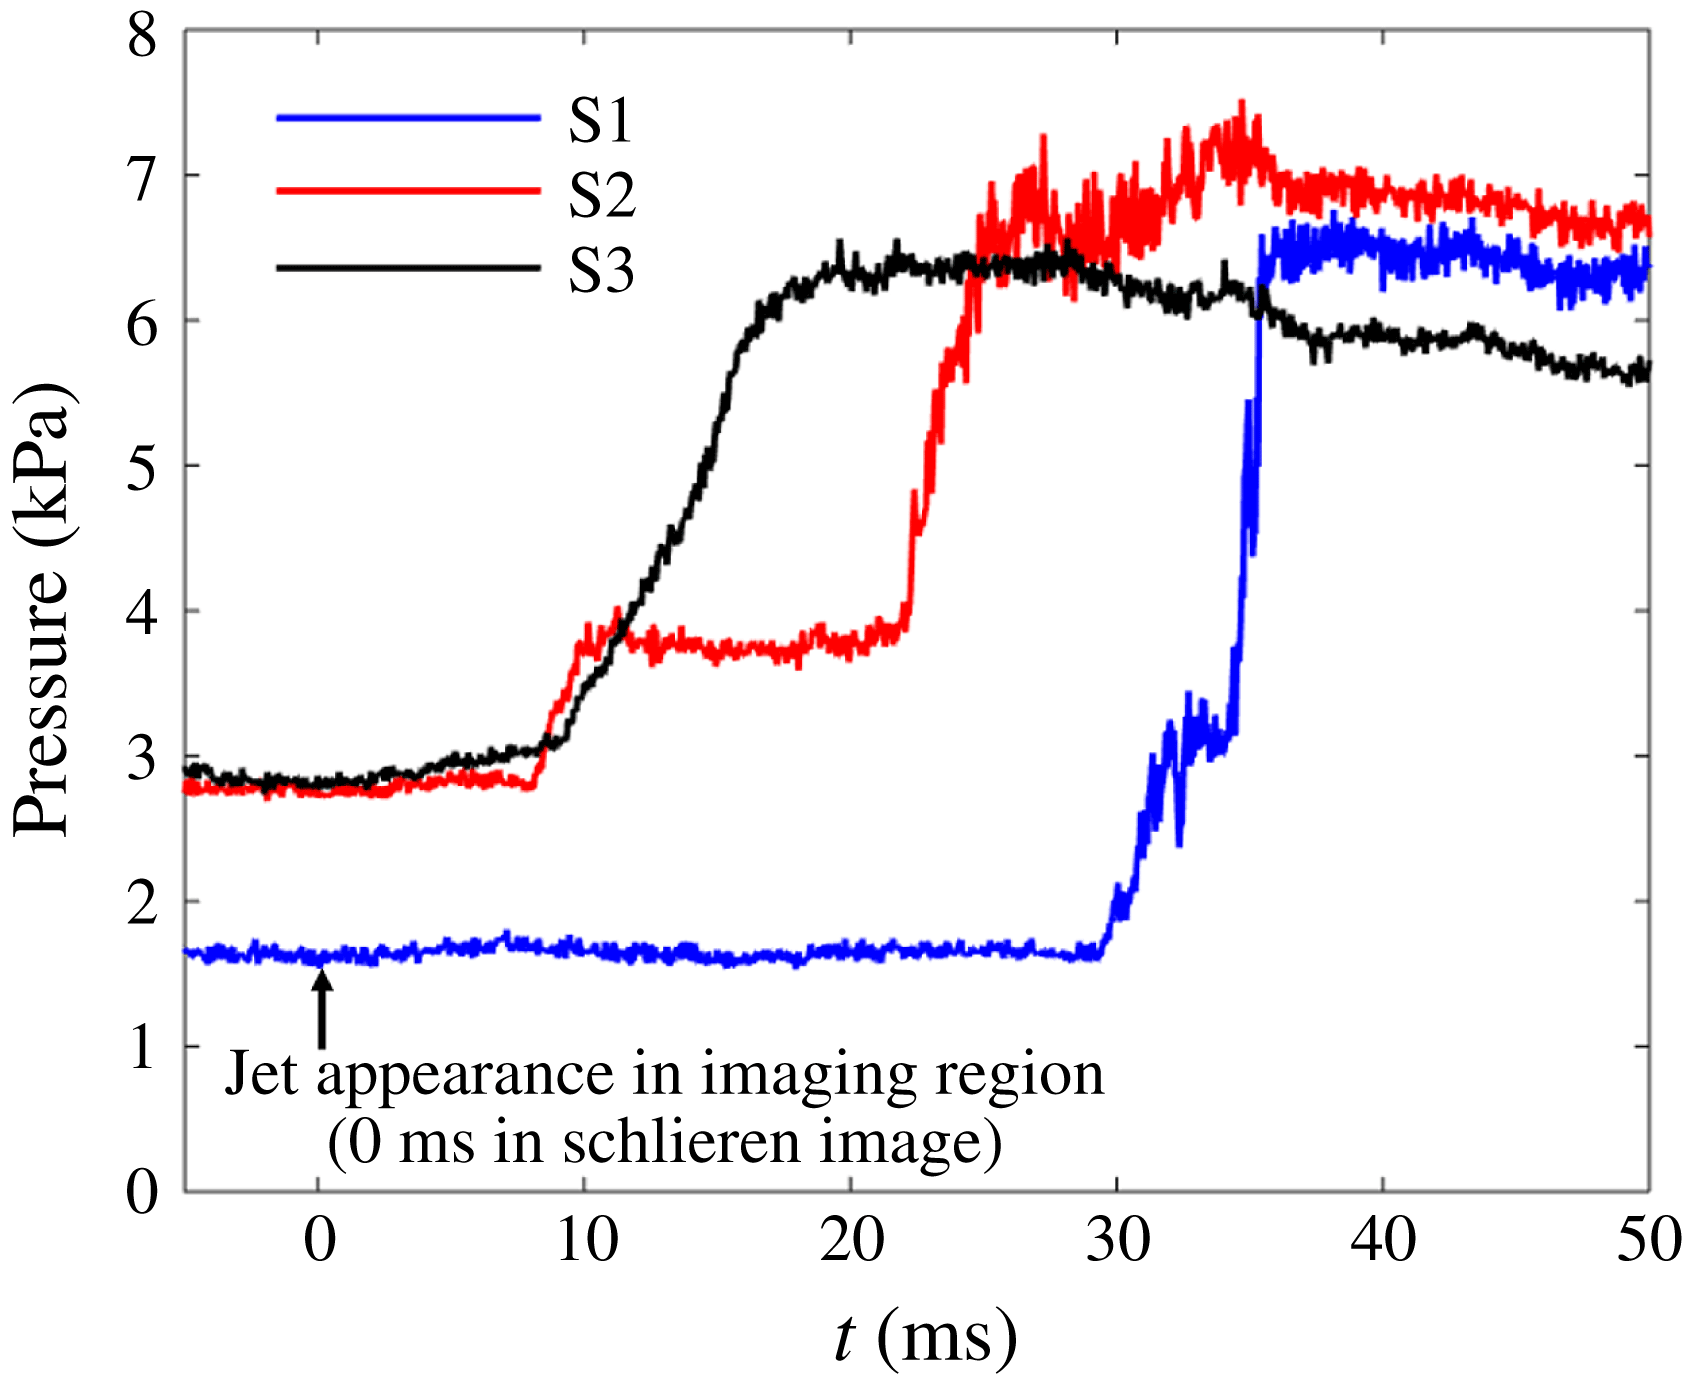
The transient and quasi-steady behaviours of the unstart phenomenon described above are well captured by wall pressure measurements. Figure 4 shows the wall pressure measurements at the sensor locations S1, S2 and S3 where
 $x=$
60 mm, 150 mm and 330 mm, respectively. The reference time in the schlieren image (0 ms) is noted with an arrow. When the jet penetrates into the channel flow sufficient to induce the bow shockwave, two sensors sequentially detect a sudden pressure rise. From this point, the two sensors discern different behaviours of the wall pressure at each location. The pressure at S2 remains quasi-steady for approximately 12 ms while the pressure at S3 increases rapidly. The plateau of the pressure trace from the S2 sensor location shows that the pressure disturbances downstream have not reached this location. The pressure rise at S3 shows a relatively less steep pressure rise in the first half of the rise and a relatively steeper rise in the latter half of the rise, i.e. the slope of the wall pressure increases at 14 ms. Flow choking occurs downstream from S3 (
 $x>330$
mm) between 10 ms and 14 ms, spawning an unstart shockwave. Then, the unstart shockwave reaches S3 at 14 ms. The unstart shockwave propagates upstream continuously and arrives at S2 at approximately 22 ms. The passage of the unstart shockwave at S2 takes approximately 3 ms. It is consistent with the flow visualization (figure 3) that the unstart shockwave appears at 22 ms in the imaging region. Also, there is no additional unstart shockwave after 26 ms in the schlieren images. The differences in the pressure profiles at S2 and S3 are attributed to the unstart trigger mechanism, namely jet injection. Jet injection creates a favourable pressure gradient downstream. Therefore, the pressure should build up, overcoming the upstream pressure, for the unstart shockwave to propagate upstream. As a result, the farthest downstream sensor detects a continuous pressure rise, and the sensor near the jet has a relatively long (
 ${\sim}$
12 ms) quasi-steady state before the unstart shockwaves propagate. The pressure rise at S1 is observed at 29 ms. The pressure at this location rises in 2 ms, and then stays quasi-steady for 2 ms. It should be noted that the pressure rise at this time frame is due to the rearrangement of the incident shockwaves from the model inlet wedges to accommodate the pressure rise downstream. The unstart shockwave arrives at 34 ms after a short period of quasi-steady state conditions. At 35 ms, the unstart shockwave system entirely passes S1, implying that the flow is close to the completion of the unstart process.
Measured wall pressure traces at S1, S2 and S3 locations (
 $x=$
60 mm, 150 mm and 330 mm, respectively) with Case 5 flow conditions.

The average propagation speed between sensor locations was calculated based on the unstart shockwave detection time and the distances between the sensors. The arrival times of the unstart shockwave at each sensor location, S1, S2 and S3 were 34 ms, 22 ms and 14 ms, respectively. With the distances between sensors, 90 mm (from S1 to S2) and 180 mm (from S2 to S3), the average speeds of the unstart shockwave between sensors were estimated to be
 $7.5~\text{m}~\text{s}^{-1}$
(from S1 to S2) and
 $22.5~\text{m}~\text{s}^{-1}$
(from S2 to S3), respectively. However, the instantaneous speed of the unstart shockwave at each sensor location, estimated by the slope of the pressure rise, revealed that the speed at the upstream sensor was higher than that at the downstream sensor. This means that the instantaneous speed of the unstart shockwave at S1 was highly accelerated.
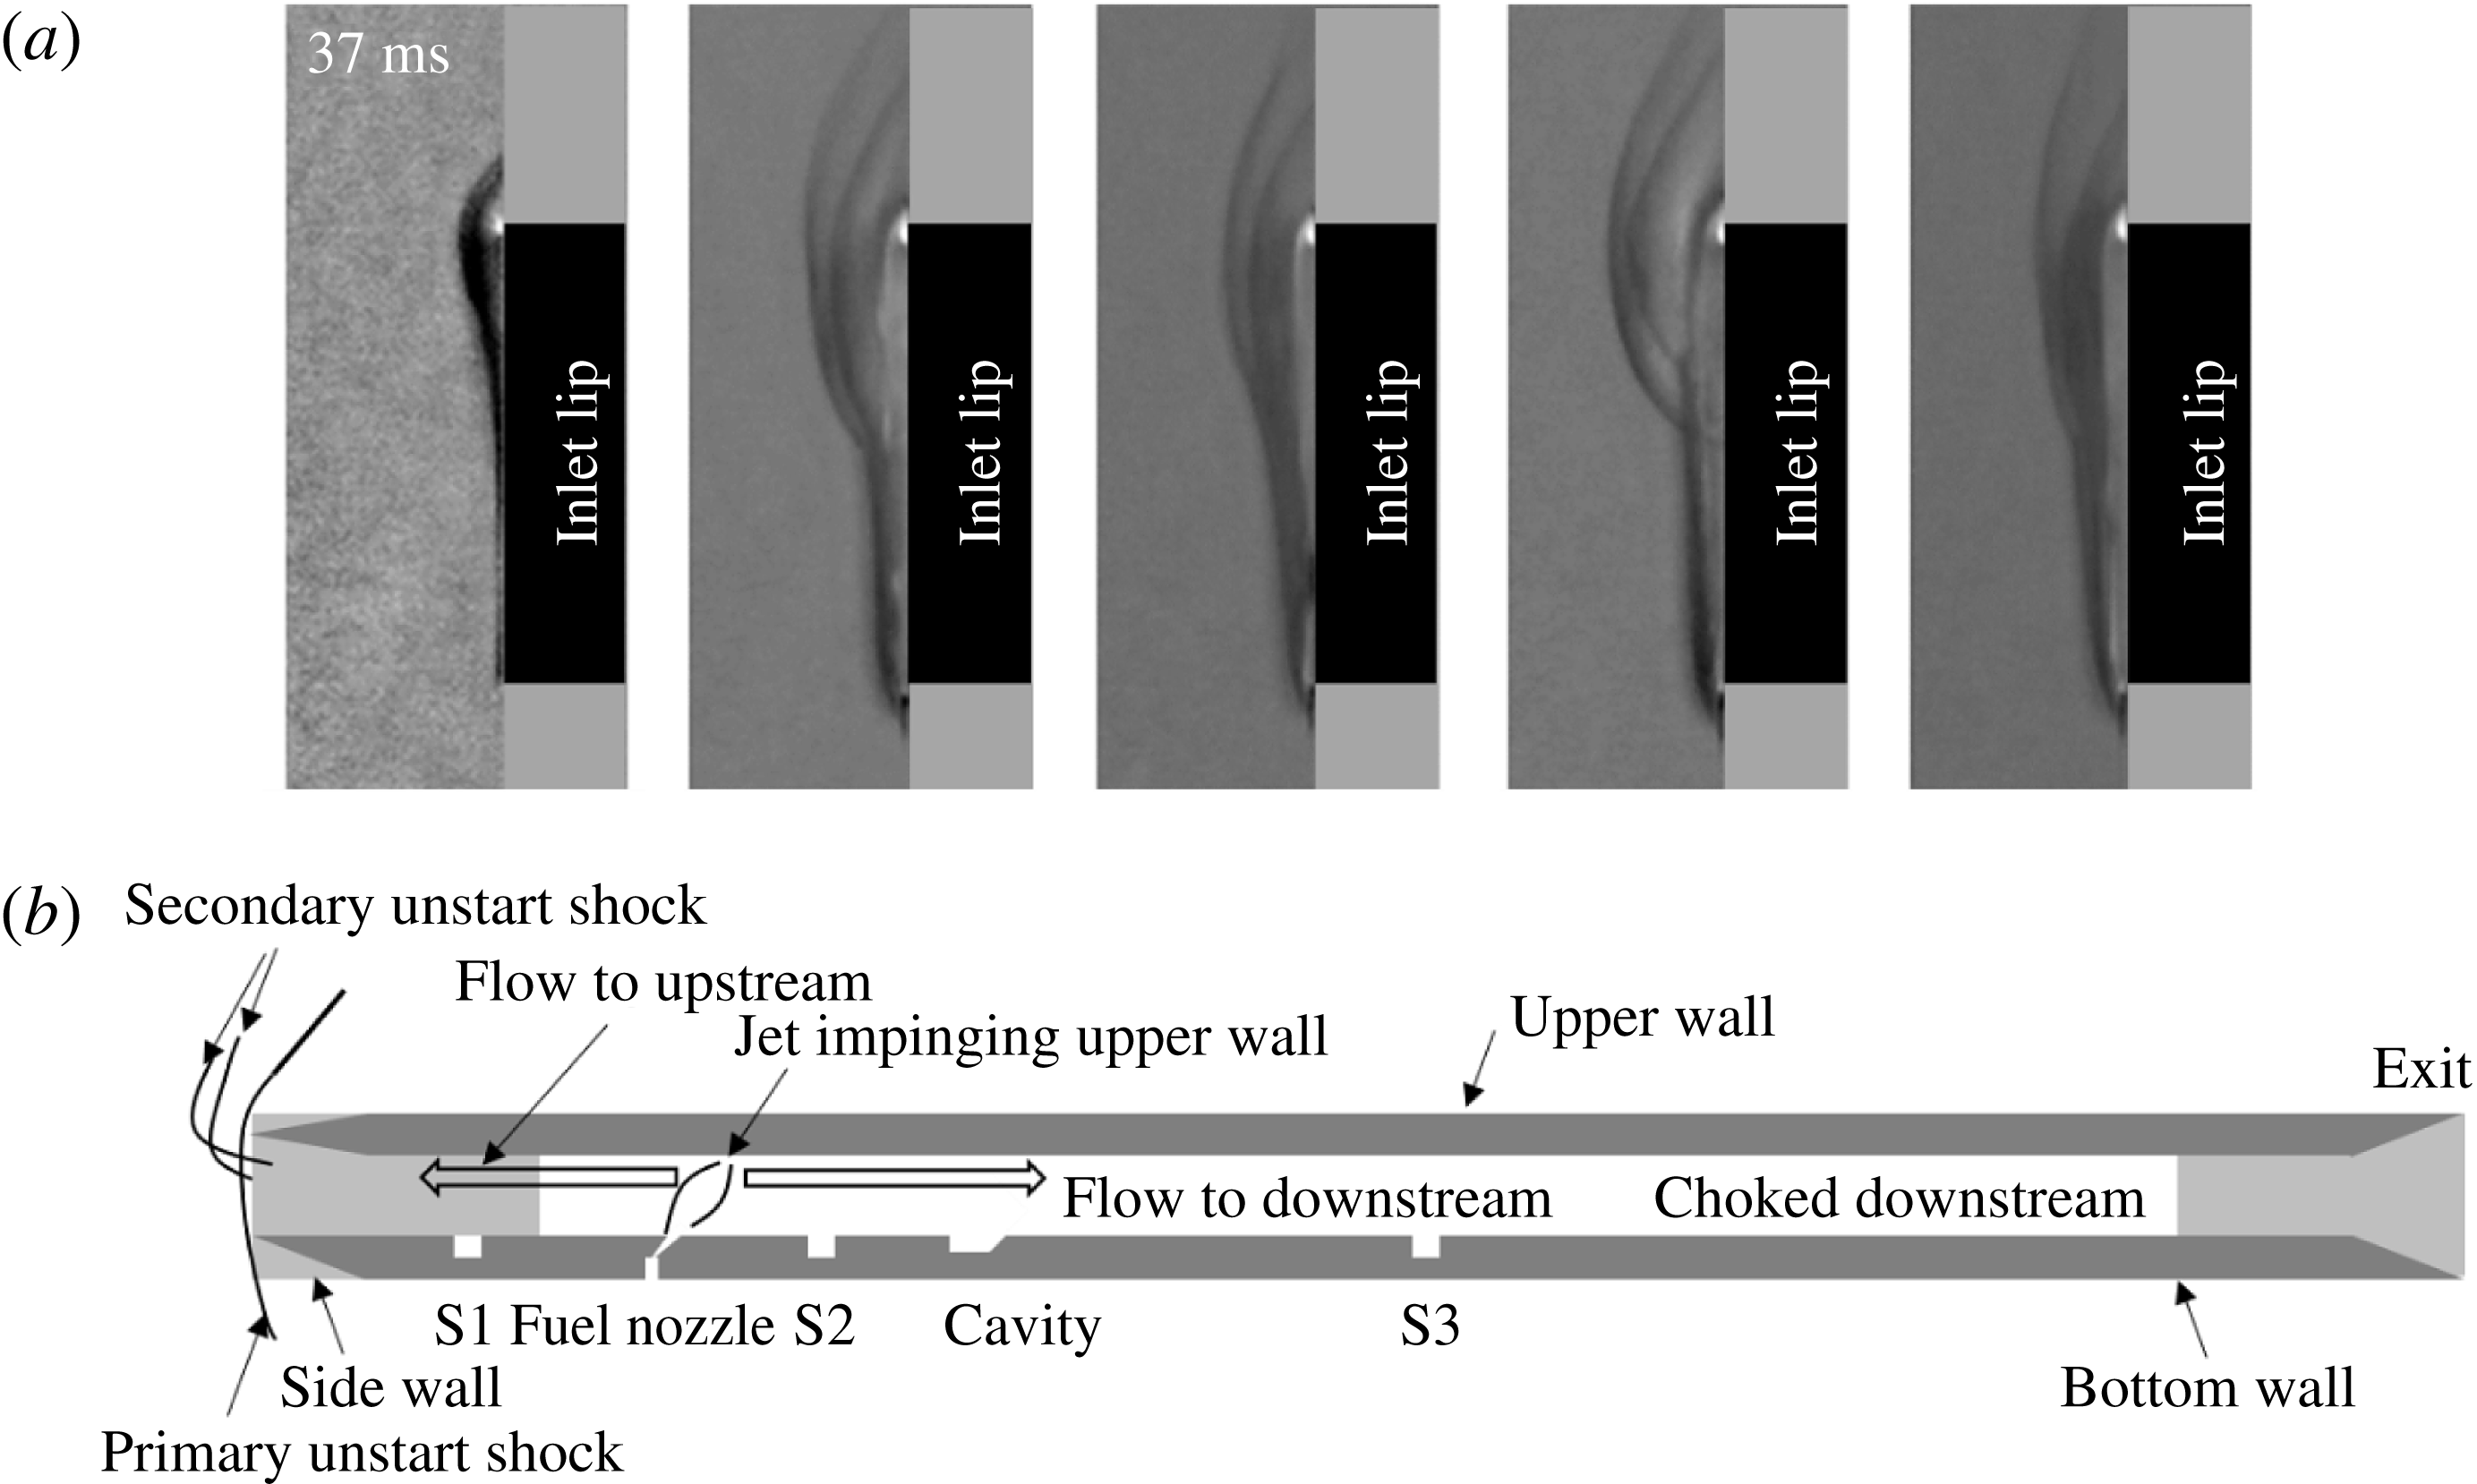
(a) Schlieren images of unstarted flow near inlet lip (
 $x=-10{-}5$
mm) at
 $J=2.41$
. The height of each image is 30 mm. The first image on the left is taken at 37 ms and images apart 0.5 ms from each other. The black rectangular strip and grey strip represent the location of the inlet lip and side wall, respectively. (b) The schematic of unstarted flow.

The differences in the average propagation speed between sensors and the instantaneous speed were mostly attributed to the quasi-steady state behaviour of the unstart phenomenon. In the current study, a high local pressure gradient near the jet injection region was introduced by the jet injection. This reduced the unstart shockwave propagation speed, creating a quasi-steady state. This phenomenon can be also seen in figures 3 and 4. It takes approximately 7 ms from the arrival of the unstart shockwaves into the imaging region (22 ms, the identical time frame when the unstart shockwaves reaches S2) until the passage of the unstart shockwaves through the jet (29 ms), while the time taken from the jet to S1 is 5 ms. The distances from S2 to the jet and from S1 to the jet are 50 mm and 40 mm, respectively. Therefore speeds of propagation of
 $7.1~\text{m}~\text{s}^{-1}$
and
 $8.0~\text{m}~\text{s}^{-1}$
for downstream and upstream of the jet can be calculated, respectively. The suppression of the propagation is seen near the downstream of the jet. The local pressure gradient results in a quasi-steady state of the unstart shockwave propagation. As depicted in figure 4, S2 detected a gradual increase from 22 ms to 32 ms, showing the pressure build up downstream of the unstart shockwave. When the pressure has built up high enough to overwhelm the pressure gradient generated by the jet injection, the unstart shockwave is pushed upstream again. At this point, the unstart shockwave has a higher acceleration than when it was downstream of the flow because the pressure ratio pushing the unstart shockwave is higher. The quasi-steady state and the restart behaviours of the unstart shockwave propagation were similarly observed in Do et al. (Reference Do, Im, Mungal and Cappelli2011a
). The measured static pressure ratios of each sensor locations between before the jet injection and after the unstart shockwave are 3.9, 2.5 and 2.2, for S1, S2 and S3, respectively.
The unstart flow features upstream of the scramjet model inlet region are shown in figure 5(a). The images in figure 5 are taken with a vertical knife-edge configuration. The time stamps used in this figure are identical to the reference times appearing in figure 3. At 37 ms, the scramjet model inlet is close to the completion of unstart. As a consequence, a strong normal shockwave with additional weak curved shockwaves start to appear in the shockwave system. The strong normal shockwave is the primary unstart shock generated to match the pressure upstream and downstream of the flow. The weak curved shockwaves are the secondary shockwaves induced by the reverse flow of the mass injected by the jet. Since the channel is choked, a certain portion of the mass from the jet that cannot be accommodated by the channel has to travel towards the upstream of the flow. The mass is mostly carried along the upper wall surface as the mass is injected from the jet impinging on the upper wall. As a result, the reverse directional flow generates curved weak shockwaves mostly in the upper half of the inlet height. This general concept of the unstart shock system is illustrated in figure 5(b). After the 37 ms time frame, the shockwave system is pushed away at a certain distance from the lip of the inlet, spilling adequate mass from the free stream flow to match the pressure inside of the scramjet model. The primary unstart shockwave is slightly tilted upward due to the reverse directional flow.
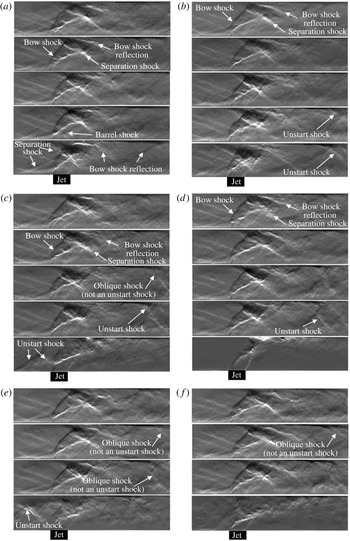
Time sequential images of the low-enthalpy free stream – cold N
 $_{2}$
jet flow conditions during the unstart process near the jet (
 $x=90{-}140$
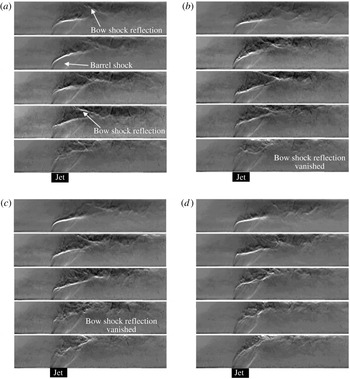
mm) at various time frames of unstart (a) 9 ms, (b) 22 ms, (c) 32 ms, (d) 48 ms, (e) 69 ms and (f) 103 ms. In each panel, the jet momentum ratio ascends from top to bottom (1.75, 1.94, 1.97, 2.13 and 2.41). In (e,f), images of
 $J=2.41$
are not shown as the flow is already unstarted.

Severe fluctuations in the weak curved shockwaves are observed while the primary unstart shockwave remains relatively steady. The fluctuation frequency of the secondary curved shockwaves is estimated to be of the order of approximately 1 kHz by manually examining the schlieren images. Several camera imaging frames were tested to avoid possible aliasing issues in estimating the frequency. The tests verified that a 1 kHz fluctuation was not an aliasing frequency. A fluctuation frequency of 1 kHz, however, was not observed in the power spectrum of S1 pressure traces during unstart because the sensor was located at the lower wall surface and the reverse directional flow mostly occurred along the upper and side wall surfaces.
3.1.2 The effects of jet momentum ratio
To investigate the effects of the jet momentum ratio on unstart, the sequential flow features after jet injection (
 $x=90{-}140$
mm) for Cases 1–5, tabulated in table 1, are visualized in figure 6(a–f). In each panel of figure 6, the jet momentum ratio ascends from (a–f). The flow motions depicted in figure 6(a) are taken at 9 ms when the jet of the lowest momentum ratio case is fully developed. As the jet momentum ratio increases, the angle of the bow shockwave becomes steeper and the separation due to the impingement of the jet on the upper wall becomes more severe. As a consequence, the separation shockwave at a higher jet momentum ratio locates further upstream. At 22 ms, an unstart shock appears in the two highest jet momentum cases (Cases 4 and 5), as seen in figure 6(b). As shown in figure 6(c), the flow of Case 5 is close to the completion of unstart and the unstart shockwave slightly propagates in Case 4 flow conditions at 32 ms. A shockwave, unseen in the previous two time stamps, appears in Case 3 flow conditions at 32 ms. However, it is not an unstart shockwave since it does not propagate further to the upstream of the jet. The completion of the unstart process is observed at 48 ms for the Case 5 flow conditions in figure 6(d). The shockwaves in Cases 3 and 4 move upstream at the 48 ms time frame (see figure 6
d). Consequently, the separation is enlarged and the separation shockwave moves upstream accordingly, which is a portent of unstart. As depicted in figure 6(e), 10 ms later, the flow of Case 4 undergoes the unstart process in which the separation shockwave becomes the unstart shockwave. Then, the flow is completely unstarted at 103 ms, as shown in figure 6(f). The shockwave system in Case 3 does not propagate further upstream and stays in a quasi-steady state during the rest of the test time. There is an additional shockwave propagating into the imaging region in the Case 2 flow conditions, but it stays at that location for the rest of the test time. There is no additional flow feature appearing in the Case 1 flow conditions during the entire test time. The results indicate that the back pressure rise should be high enough to affect the separation upstream of the jet for complete unstart.
Based on the comparison between Cases 4 and 5, where the scramjet model experiences unstart, it is found that the time taken to unstart in Case 5 is much shorter than that in Case 4. This tendency is mainly due to the higher jet momentum ratio in Case 5 that leads to a higher pressure rise downstream of the channel. With the higher jet momentum ratio, the jet penetrates into the cross-flow creating more blockages to the flow and a larger bow-shock-induced separation region. Also, it adds more mass to the scramjet channel. As a result of the higher pressure rise downstream, the whole process of unstart is expedited.
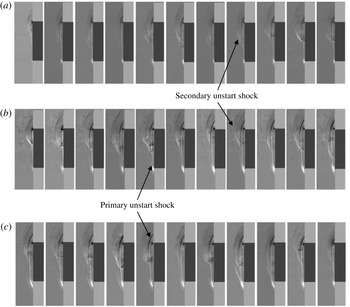
Schlieren images of unstarted flow near inlet lip (
 $x=-10{-}5$
mm) of (a) Case 6, (b) Case 7 and (c) Case 8. The height of each image is 40 mm. The first image on the left in (a), (b) and (c) is taken at 26 ms, 8 ms and 7.25 ms, respectively, and images are 0.125 ms apart. See supplementary movie 2.

As visualized in figure 6, there is a certain threshold of the jet momentum ratio that induces unstart in the current scramjet model. Here, we estimate this threshold of the jet momentum ratio as 2.13, a value that is not affected by the run-to-run variation in triggering unstart. Further details of the flow choking mechanism are discussed in § 5 with a comparison between mass- and combustion-driven unstart phenomena.
3.1.3 Shockwave structure upstream of the inlet
The unstart shockwave structure upstream of the scramjet inlet used for the flow conditions of Cases 6–8 is visualized in figure 7(a–c). The darker and lighter grey regions on the right side of each image represent the channel height of the scramjet model and the side walls, respectively. The first appearance of the unstart shockwave system was recorded at 26 ms, 8 ms and 7.25 ms after the reference times for Case 6, 7 and 8 flow conditions, respectively. This means that the speed of the unstart shockwave system is faster at a higher back pressure. Therefore, the time taken to unstart in Cases 7 and 8 is much shorter than in the other flow conditions. In these cases, there is no noticeable quasi-steady behaviour of the unstart shockwaves since the pressure downstream of the channel rises significantly faster than in the other flow conditions. The images in figure 7 are separated by 0.125 ms. The distance between the primary unstart shockwave and the lip of the channel inlet increases as the jet momentum ratio increases. The primary unstart shockwave in each flow condition is tilted upward, similar with those shown in figure 5. The length of the primary unstart shockwave is affected strongly by the mass flow rate ratio between the scramjet channel and the jet. When a higher flow rate jet is injected beyond the unstart threshold, there is increased mass from the jet since the mass flow rate that the channel can accommodate is fixed. Thus, a higher mass spillage is required at the inlet of the scramjet channel. As a result, the length of the primary unstart shockwave increases to lessen the mass flow rate into the scramjet channel.
The secondary unstart shockwaves induced by the reverse directional flow from the scramjet channel interact strongly with the primary unstart shockwave and other secondary shockwaves. Since the secondary unstart shockwaves fluctuate severely, the location in which the primary and secondary unstart shockwaves interact with each other oscillates up and down. As the jet momentum ratio inflates, the magnitude and the frequency of the fluctuation estimated from the images increase. The magnitudes of the fluctuation in Cases 6, 7 and 8 are
 $1/2$
,
 $2/3$
and the entire height of the channel, respectively. A higher mass flow rate toward the upstream of the flow is required as more mass is injected. Consequently, the area affected at the lip of the scramjet model channel by the reverse flow is enlarged. The resonance frequency of the secondary unstart shockwave fluctuation is associated with flow separation. A higher fluctuation is observed with a higher mass flow rate upstream that increases the speed of the reverse flow.
3.2 High-enthalpy free stream – cold N
$_{2}$
jet

Now, we will discuss the unstart phenomenon in a high-enthalpy free stream – cold N
 $_{2}$
jet flow condition where a negative heat transfer to the free stream exists. The time sequential images of Case 9–13 flow conditions near the jet location (
 $x=90{-}140$
mm) are depicted in figure 8(a–d). In each panel of figure 8, the jet momentum ratio ascends from (a–d). Although the detailed flow features of the free stream flow are not visualized due to the low density of high-enthalpy flow, the effects of the jet momentum ratio can be investigated from the visualized jet behaviours. Fully developed jets at 4 ms are depicted in figure 8(a). A faster jet development into the free stream results from the free stream pressure being lower than in the previous low-enthalpy flow conditions. The penetration distance and the size of the barrel shockwave increase as the jet momentum ratio increases. Consequently, the corresponding flow separation location on the upper wall surface by the bow shockwave moves upstream. Between the 5 ms and 6 ms time frames in figure 8(b,c), the jet flow features of the two highest jet momentum ratios start to deform while the first three conditions remain in their initial flow structure configuration. The flows with the two highest
 $J$
values undergo unstart at 14 ms, as shown in figure 8(d). The flow features of Case 11, figure 8(c), are manipulated by the pressure propagation upstream at this time frame. However, the flow is not completely unstarted during the rest of the test time, which means that the propagated unstart shockwaves are anchored between the lip of the model and the jet. In addition, the channel flows at the two lowest jet momentum ratio conditions do not result in unstart shockwaves during the entire test time, although over 30 % the scramjet channel mass flow rate is injected through the jet, which was sufficient to induce unstart in Cases 1–8. The threshold of the jet momentum ratio in the current free stream conditions increases from
 $J=2.13$
to
 $J=4.25$
. The increment of the unstart threshold is mainly due to free stream flow cooling by the cold jet injection, which will be discussed in § 5.
Time sequential images of the high-enthalpy free stream – cold N
 $_{2}$
jet flow conditions during the unstart process near the jet (
 $x=90{-}140$
mm) at various time frames of unstart (a) 4 ms, (b) 5 ms, (c) 6 ms and (d) 14 ms. In each panel, the jet momentum ratio ascends (a–d) (2.48, 3.38, 3.56, 4.25 and 4.87).

4 Unstart driven by combustion
In this section, unstart induced by heat release from combustion in high-enthalpy free stream – ethylene jet flow conditions will be compared with the unstart driven by mass addition in the previous two flow conditions of low- and high-enthalpy free streams – cold N
 $_{2}$
jet injection. In the current flow conditions, there is a significant heat release to the free stream due to the combustion.
Time sequential images of the high-enthalpy free stream – ethylene jet flow condition (Case 14) during the unstart process near the jet (
 $x=90{-}140$
mm) at
 $J=0.73$
and
 ${\it\phi}=1.76$
. The height of each image is 15 mm. Reference time 0 ms represents the time of jet appearance in the imaging region. See supplementary movie 3.

4.1 Flow visualization and wall pressure measurements
The details of the flow features in high-enthalpy free stream flow are not able to be captured due to the low density of free stream flow conditions in the current study. However, the physical phenomenon of unstart can be investigated by visualized jet behaviours. The overall equivalence ratio (
 ${\it\phi}=1.76$
) and jet momentum ratio (
 $J=0.73$
) are used to induce unstart in Case 14. The overall equivalence ratio chosen for Case 14 is higher than the overall equivalence ratio that has the maximum fuel burning rate (Liu et al.
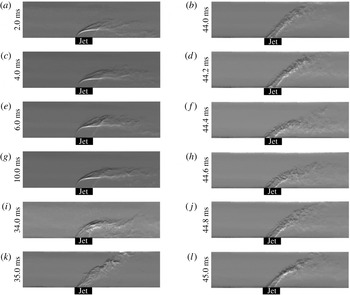
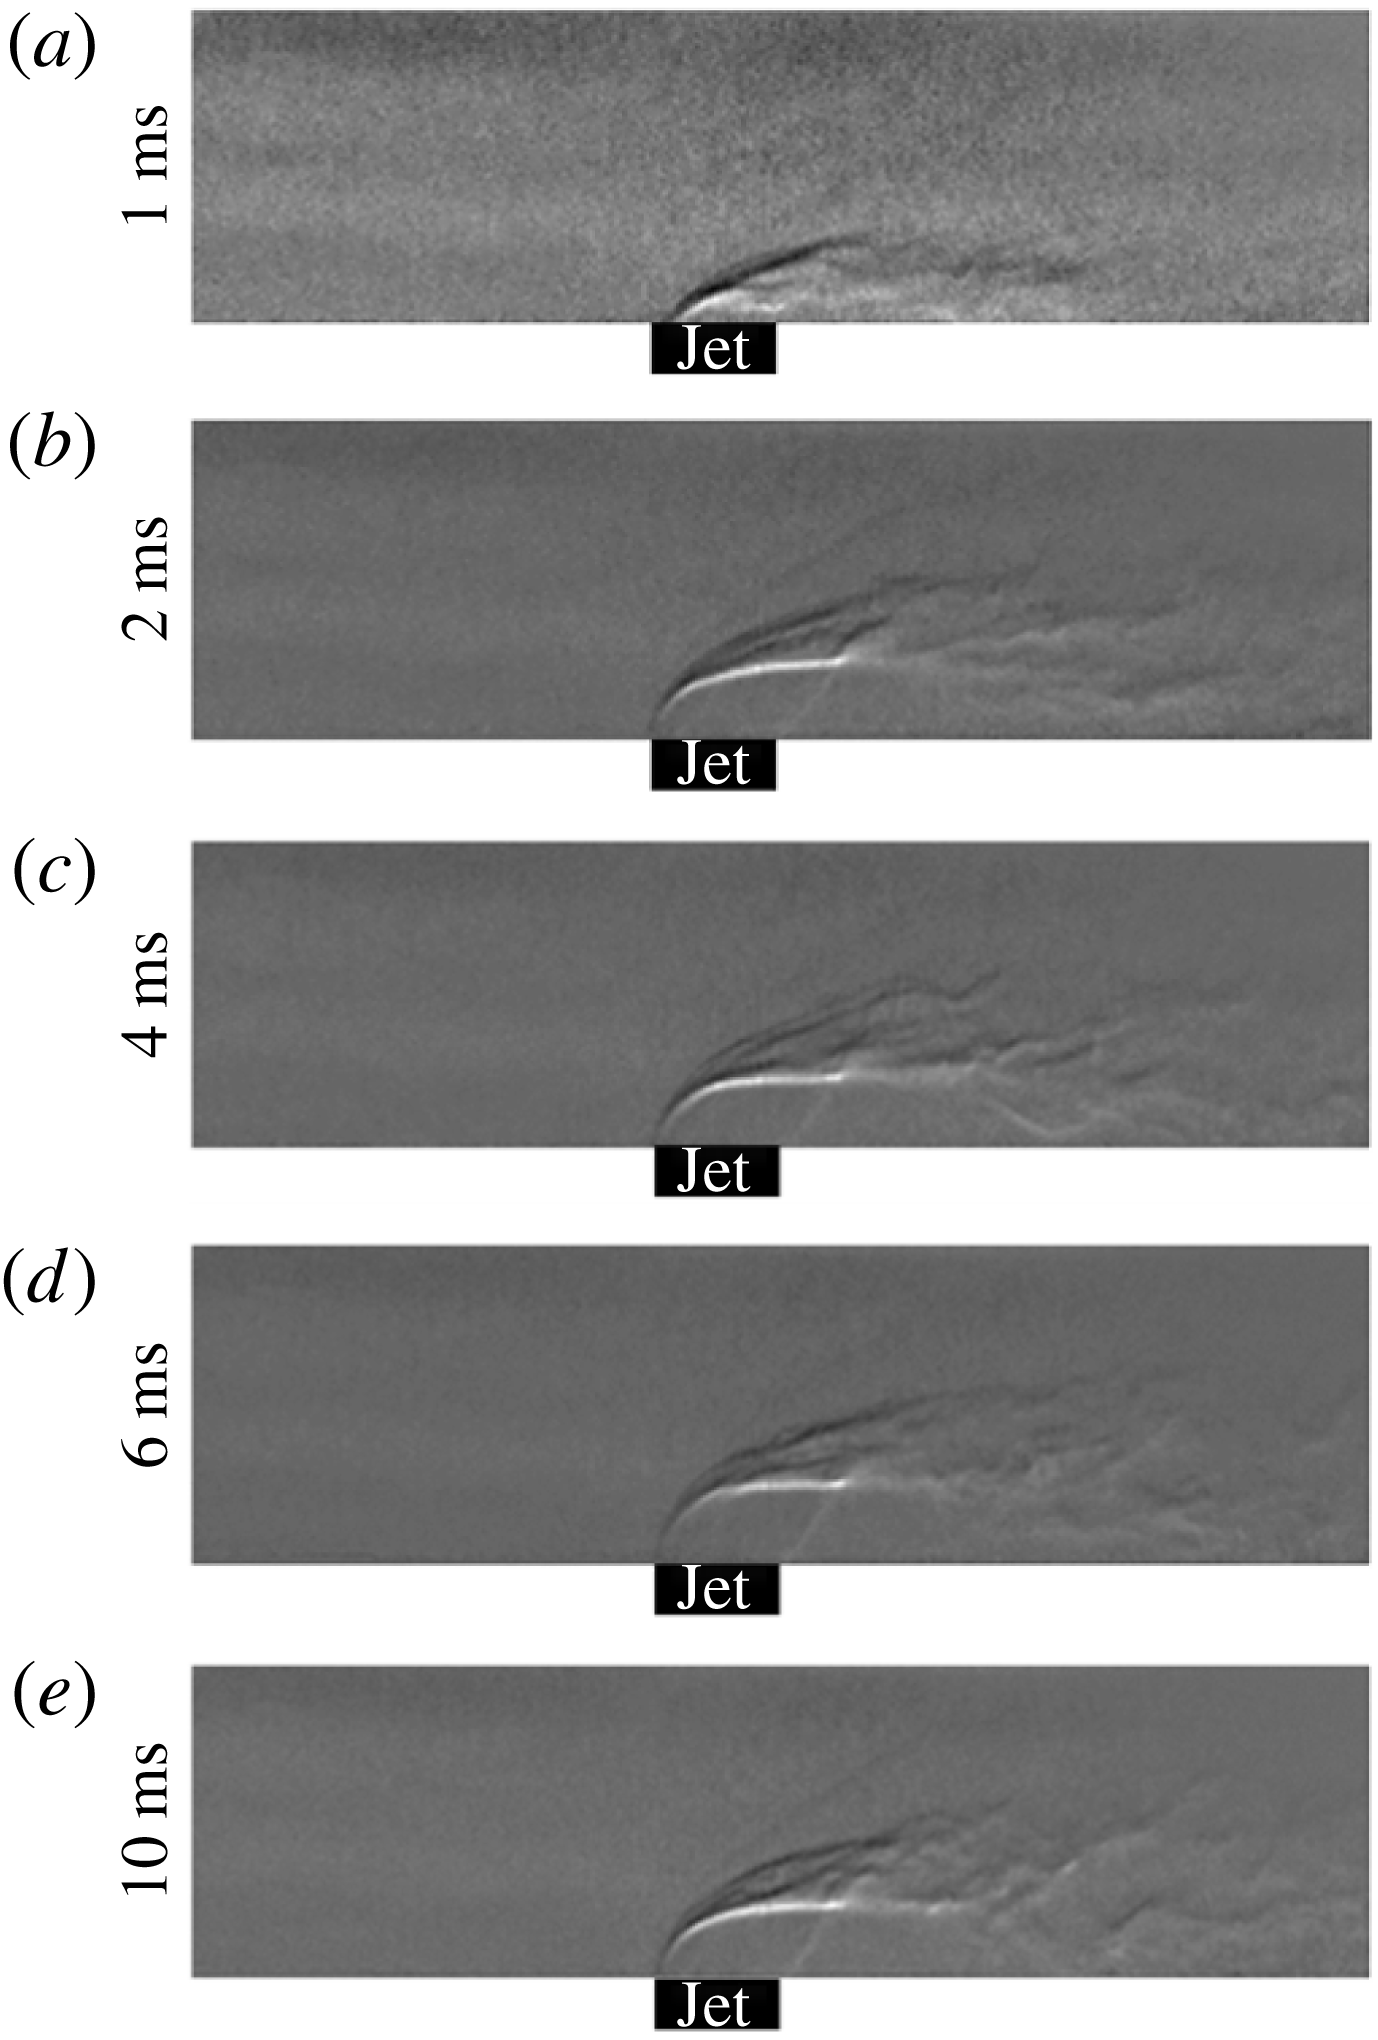
Reference Liu, Passaro, Baccarella and Do2014). The time sequential images of unstart in Case 14 flow conditions are shown in figure 9. Specifically, the jet development and the quasi-stationary behaviour of the jet are visualized. The flow remains relatively steady until 33 ms. At 34 ms, the size of the barrel shockwave decreases significantly, and this implies a sudden pressure rise at the jet injection location. However, there is still a strong cross-flow with respect to jet injection since the shear flow stretches in the downstream direction. The size of the barrel shockwave decreases further at 35 ms. At this time frame, the strength of the cross-flow with respect to the jet reduces significantly. Therefore, the jet propagates straight toward the injection direction like a free jet; the angle of the shear flow is close to the jet injection angle. A typical oscillatory motion of the jet is depicted in the images taken between 44 ms and 45 ms. The angle of the shear flow induced by the jet is similar to the injection angle, and the width of the shear is narrower at 44 ms. The angle of the jet decreases gradually, and the width of the shear enlarges until 44.4 ms. At this time frame, the jet bends toward the lower wall surface and the shear region fills the whole height of the channel. This means that the cross-flow is stronger at 44.4 ms than at 44 ms. Then, the jet rises again, and the width of the shear region decreases. At 45 ms, the structure of the jet is very close to that in 44 ms. Beyond this point, the jet oscillates at a certain frequency.
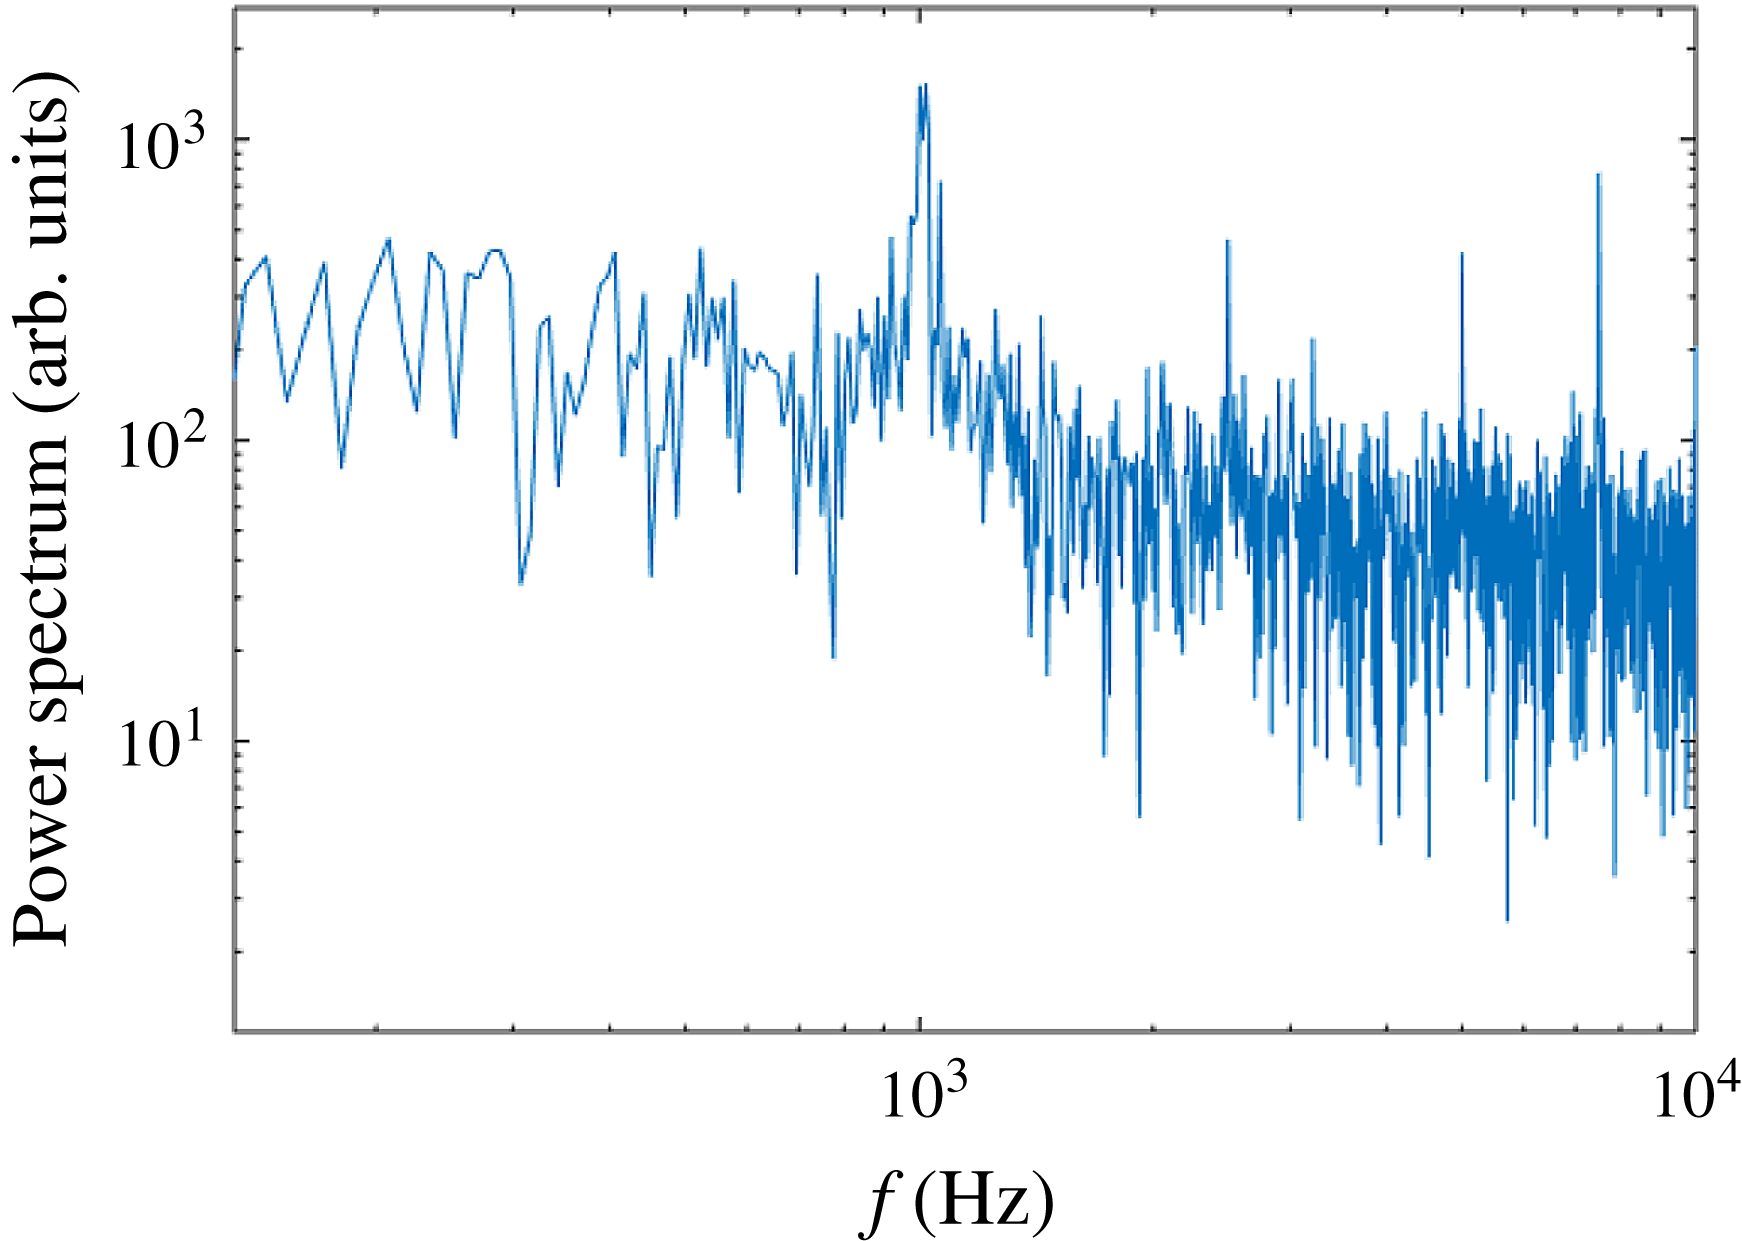
Power spectrum of measured wall pressure trace at S1 (
 $x=60$
mm) with Case 14 conditions.

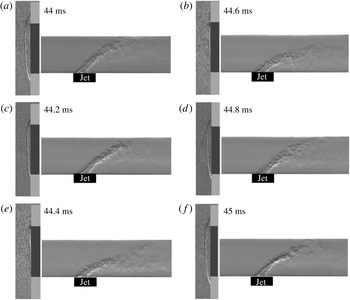
The dominant frequency of the pressure trace at S1 was measured to be 1002 Hz, as shown in figure 10. The frequency peak comes from the coupling between flow convection and acoustic propagation rather than solely acoustic resonance. The oscillation in the unstarted flow can be explained by figure 11 which shows the time-resolved schlieren images in the inlet and the jet imaging regions after the completion of unstart. The first image in this figure was taken at 44 ms and the following images are 0.2 ms apart from each other. At 44 ms, there is a primary unstart shockwave detached from the scramjet channel. The detached primary unstart shockwave spills mass from the inlet. Because of the spillage, there is less free stream mass/momentum flux going into the scramjet channel. As a consequence, the jet generates a straight narrow shear flow similar to a free jet, as depicted in the jet imaging region (44 ms in figure 11). The narrow shear region leads to poor mixing between the oxidizer and fuel. The reduced mass flow rate into the scramjet model results in a higher overall equivalence ratio because the spillage reduces the oxidizer flow rate. Since the initial overall equivalence ratio is higher than the equivalence ratio of the maximum burning rate, the richer overall equivalence ratio at 44 ms decreases the local burning rate at the flame front. The poor mixing and lower burning rate result in more unburnt fuel at the exit of the model channel, which diminishes the overall heat release inside of the scramjet model. Thus, the pressure rise is alleviated. The pressure drop leads to the movement of the primary unstart shockwave towards the lip of the inlet (44.2–44.6 ms). There is a greater mass flow rate captured by the lip of the inlet when the shockwave moves further downstream. The attached unstart shock at the lip of the inlet generates a higher mass/momentum flux into the scramjet channel. Due to the increased free stream momentum flux, the jet bends downstream, creating a larger fuel spreading region. The larger shear region enhances fuel oxidizer mixing and increases the burning rate at the flame front, leading to less unburnt fuel at the exit. Consequently, the heat release rate increases, inducing a higher pressure rise inside of the scramjet channel. This causes the propagation of the primary unstart shockwave upstream of the flow, as depicted at 44.8 ms in figure 11. Since ethylene is injected, there is reverse mass transportation of the fuel, and the fuel reacts chemically during propagation. At 44.8 ms, the secondary unstart shockwave is observed as evidence of reverse directional flame propagation, as similarly observed in Liu et al. (Reference Liu, Passaro, Baccarella and Do2014). The further propagation of the primary unstart shockwave is shown at 45 ms in figure 11. Due to the propagation, less air goes into the scramjet model once again. Then, the jet moves upwards and the mixing region becomes narrower, as depicted at 44.8 ms and 45 ms in figure 11. The whole process takes approximately 1 ms, resulting in a 1 kHz repetition rate of the cycle.
Schlieren images of unstarted flow near inlet lip (
 $x=-10{-}5$
mm) of Case 14. The height of each image is 40 mm. The first image on the left is taken at 44 ms and images are 0.2 ms apart from each other. See supplementary movie 4.

As mentioned earlier in this section, the dominant oscillation observed in the current study is caused by flow–combustion interactions rather than by aerodynamic and acoustic resonance, which somewhat contradicts the findings of Laurence et al. (Reference Laurence, Karl, Schramm and Hannemann2013) that the fluctuation of the unstarted flow comes from the flow separation. We believe that this discrepancy occurs due to the duration of the test time. Since the usable test time in Laurence et al. (Reference Laurence, Karl, Schramm and Hannemann2013) was much shorter (of the order of a few milliseconds) than that in the current study (of the order of a few hundred milliseconds), the unsteady behaviour of the flow–combustion interactions might not be captured in their study. There is no doubt that the buzzing phenomenon is affected by aerodynamic and aeroacoustic resonances. However, the dominant oscillation of the pressure at the inside of the scramjet model comes from the flow–combustion interactions, as revealed in the current study.
4.2 The effect of the equivalence ratio
Figure 12 shows ethylene jet injection into the high-enthalpy free stream of the Case 15 flow conditions where the mass flow rate of the fuel is decreased from that of Case 14. The jet momentum ratio is 0.58, and the corresponding overall equivalence ratio is 1.4. The jet is fully developed approximately 6 ms after the reference time frame, at 0 ms. Since the jet momentum ratio is lower than that in the previous conditions, the angle of the bow shockwave from the jet (faintly visible in the schlieren images) is much smaller. The overall equivalence ratio of Case 15 has a higher burning rate compared to Case 14, leading to a higher heat release rate. However, the low jet momentum ratio and the jet mass flow rate decrease the effect of mass addition. Since the effect of mass addition is greater than that of the heat release in the Case 15 flow conditions, there is a lower pressure rise than the previous case (Case 14). As a result, Case 15 flow conditions do not induce a scramjet model unstart, and the flow stays relatively stable during the entire test time.
Time sequential images of Case 15 flow conditions near the jet (
 $x=90{-}140$
mm) at
 $J=0.58$
and
 ${\it\phi}=1.4$
. The height of each image is 15 mm. Reference time 0 ms represents the time of jet appearance in imaging region.

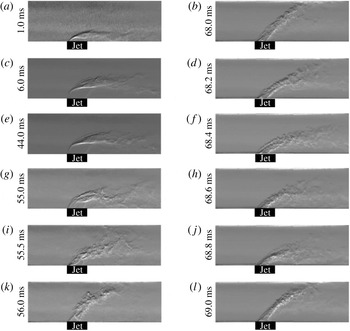
The overall equivalence ratio increases to 1.67 (Case 16), which is an approximate threshold for unstart. The increased equivalence ratio is higher than the equivalence ratio that gives maximum heat release. Therefore, there will be less heat release in Case 16 than in Case 15. However, the effect of mass addition on the pressure rise increases since a higher mass flow rate is injected. The pressure rise in the Case 16 flow conditions is sufficient to induce a scramjet model unstart. Figure 13 shows the time-resolved flow features near the jet imaging region. The unstart process shown in figure 13 is similar to that in figure 9. The fully developed jet remains steady until 54 ms. Then, the size of the barrel shockwave significantly decreases due to a sudden pressure rise due to the propagating shockwave, and the jet starts to fluctuate severely. The jet fluctuates randomly for approximately 13 ms, which is caused by the fluctuation of the unstart shockwave between the lip of the inlet and the jet. After this period, the jet oscillates coherently at a certain frequency, as seen in 68–69 ms in figure 13. The entire process of unstart in Case 16 flow conditions looks like a stretched version of the unstart in Case 14 because the pressure rise by mass addition and heat release in Case 16 are less than those in Case 14.
Time sequential images of the high-enthalpy free stream – ethylene jet flow conditions (Case 16) during the unstart process near the jet (
 $x=90{-}140$
mm) at
 $J=0.66$
and
 ${\it\phi}=1.67$
. The height of each image is 15 mm. Reference time 0 ms represents the time of jet appearance in the imaging region.

With increased overall equivalence ratios beyond the value of Case 16, the scramjet model undergoes unstart due to the combined effects of mass addition and heat release. At this overall equivalence ratio (beyond 1.67), the heat release rate decreases since less fuel burns due to the poor flame fronts downstream of the jet. However, the increment of mass addition replaces the effect of heat release on the pressure rise. More discussions on flow choking mechanism are given in § 5.
5 Comparison of choking mechanisms
The flow choking by reacting/non-reacting jet injections described in this study is a complex three-dimensional phenomenon that includes flow separation, shockwave systems, mass addition and heat release. However, a simplified qualitative analysis can provide general insights on flow choking mechanisms although rigorous modelling with expensive computations would be ideal to predict the flow choking accurately considering the various conditions (i.e. flow separation, shockwave systems, mass addition and heat release).
Previous studies suggested that the boundary layer separation due to an adverse pressure gradient is the key mechanism that induces scramjet unstart (Frost et al. Reference Frost, Gangurde, Paull and Mee2009; Wagner et al. Reference Wagner, Yuceil, Valdivia, Clemens and Dolling2009; Do et al. Reference Do, Im, Mungal and Cappelli2011a ,Reference Do, Im, Mungal and Cappelli b ). Frost et al. (Reference Frost, Gangurde, Paull and Mee2009) used the Korkegi criterion (Korkegi Reference Korkegi1975) to explain the role of flow separation on unstart in a scramjet combustor. On the contrary, Laurence et al. (Reference Laurence, Karl, Schramm and Hannemann2013) observed that unstart is initiated by a thermal choking limit based on the comparison of the measured pressure ratio to the theoretical pressure ratio between upstream and downstream of the combustor. However, they also found the presence of flow separation throughout the unstart process. Since a similar observation was made in the current study, as described in § 3, that unstart is directly related to the flow separation, the Korkegi criterion was used to explain the unstart triggering (choking) mechanism.
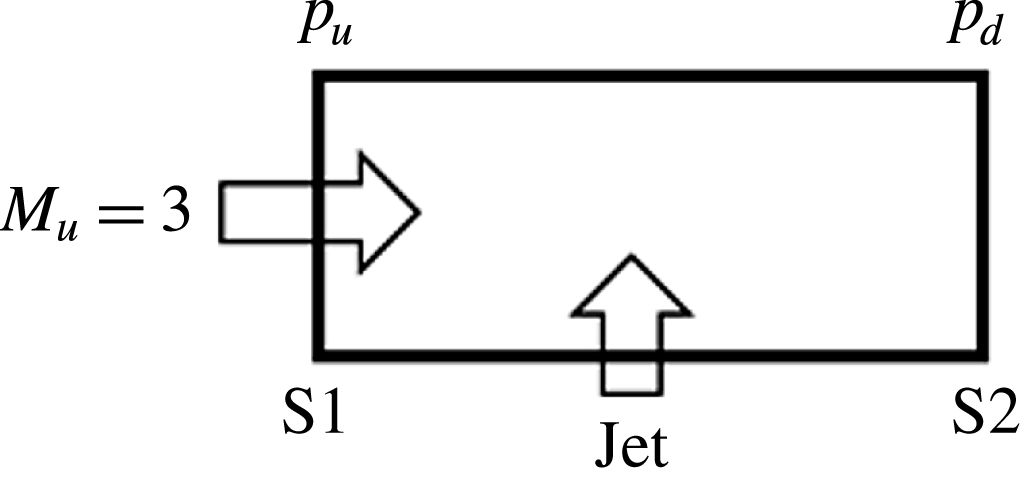
A schematic of the relative locations between S1, S2 and the jet for the pressure ratio calculation.

The Korkegi criterion that induces flow separation is expressed as
 $$\begin{eqnarray}\frac{p_{d}}{p_{u}}=1+0.3M_{u}^{2}\quad \text{for }M_{u}\leqslant 4.5,\end{eqnarray}$$
where
 $p_{d}$
,
 $p_{u}$
and
 $M_{u}$
are the downstream static pressure, the upstream static pressure and the upstream Mach number of the flow, respectively. The use of the Korkegi criterion is further justified by using the measured pressure at sensors 1 and 2 in the current study. Figure 14 illustrates the relative locations of jet injection and sensors 1 and 2. The local averaged Mach number calculated using FLUENT CFD software was 3 across the channel cross-section at the sensor 1 location before jet injection, results in a Korkegi criterion of 3.7. The pressure measured at sensors 1 and 2 right after the jet injection served as the downstream and upstream static pressures, respectively. The test cases with pressure ratio lower than 3.7 did not trigger unstart. Not surprisingly, unstart occurred at the flow conditions with a measured pressure ratio higher than 3.7. The pressure ratios between the downstream and upstream of the jet were 4.02, 4.11 and 4.01 for Cases 4, 12 and 16 in which unstart threshold was observed. Interestingly, the measured pressure ratios near the unstart thresholds of the current flow conditions were lower than the Rayleigh criterion (thermal choking) which is 5.67 for a local Mach number of 3. Therefore, it is reasonable to surmise that unstart is caused by multiple sources of pressure rise, not solely that due to heat release. The flow conditions used in the current study exhibited unstart at pressure ratios lower than the thermal choking criterion but higher than the Korkegi criterion. Therefore, the Korkegi criterion was used to discuss flow choking mechanisms that increase downstream pressure.
For analysis, a one-dimensional steady state straight duct flow with the assumptions of no work or heat exchange with the surroundings was used. A simplified equation can be expressed as,
 $$\begin{eqnarray}\displaystyle \frac{\text{d}p}{p} & = & \displaystyle \frac{{\it\gamma}M^{2}}{1-M^{2}}\frac{\text{d}A}{A}-\frac{{\it\gamma}M^{2}\left(1+\displaystyle \frac{{\it\gamma}-1}{2}M^{2}\right)}{1-M^{2}}\frac{\text{d}T_{0}}{T_{0}}-\frac{2{\it\gamma}M^{2}[1+({\it\gamma}-1)M^{2}]}{1-M^{2}}f\frac{\text{d}x}{D}\nonumber\\ \displaystyle & & \displaystyle -\,\left\{\frac{2{\it\gamma}M^{2}\left(\displaystyle \frac{{\it\gamma}-1}{2}M^{2}\right)}{1-M^{2}}+\frac{{\it\gamma}M^{2}[1+({\it\gamma}-1)M^{2}]}{1-M^{2}}\frac{V_{i}\cos {\it\alpha}_{i}}{V}\right\}\frac{\text{d}{\dot{m}}}{{\dot{m}}}\nonumber\\ \displaystyle & = & \displaystyle F_{A}\frac{\text{d}A}{A}+F_{T}\frac{\text{d}T_{0}}{T_{0}}+F_{f}f\frac{\text{d}x}{D}+F_{m}\frac{\text{d}{\dot{m}}}{{\dot{m}}},\end{eqnarray}$$
where
 $f$
,
 $D$
,
 $F_{A}$
,
 $F_{f}$
,
 $V$
,
 $V_{i}$
and
 ${\it\alpha}_{i}$
are friction coefficient, hydraulic diameter, area change coefficient, friction influence coefficient, local free stream speed, jet injection speed and jet injection angle (Saad Reference Saad1993). The qualitative comparison of unstart mechanisms in the three different flow conditions are made; (i) low-enthalpy free stream – cold N
 $_{2}$
jet (Case 4), (ii) high-enthalpy free stream – cold N
 $_{2}$
jet (Case 12) and (iii) high-enthalpy free stream – ethylene jet (Case 16).
For Case 4, we assume that there is no significant stagnation temperature change due to the jet injection because both free stream and the jet have the same stagnation temperature. Therefore, it is assumed that the effect of temperature change on the pressure rise is negligible in this case. The ratio between the jet mass flow rate and the scramjet channel mass flow rate is 12.3 %. The estimated pressure rise due to mass addition based on (5.2) is 3.29, which is much lower than Korkegi limit for the inlet Mach number of 7.08. This implies that there are other flow choking mechanisms contributing to the pressure rise. The first plausible mechanism is an effective flow area change due to the jet injection. In supersonic flow, the free stream flow reacts as if there is a bluff body when it encounters the jet. The lateral size of the jet at the exit of the nozzle is 5 mm, and the jet has an under-expanded condition. As the jet penetrates into the cross-flow, the blockage from the jet increases due to the further expansion of the jet. In addition to the blockage from the jet itself, there is a severe flow separation due to the bow shockwave impinging onto the upper surface of the channel. The flow separation generates a further flow blockage. Another possible cause of the pressure rise is friction since the typical Fanno flow equation appeared as the third term in (5.2). Therefore, it is reasonable to suppose that the choking is caused by the combined effects of mass loading, friction and effective area change, and jet injection contributes to mass loading and effective area change.
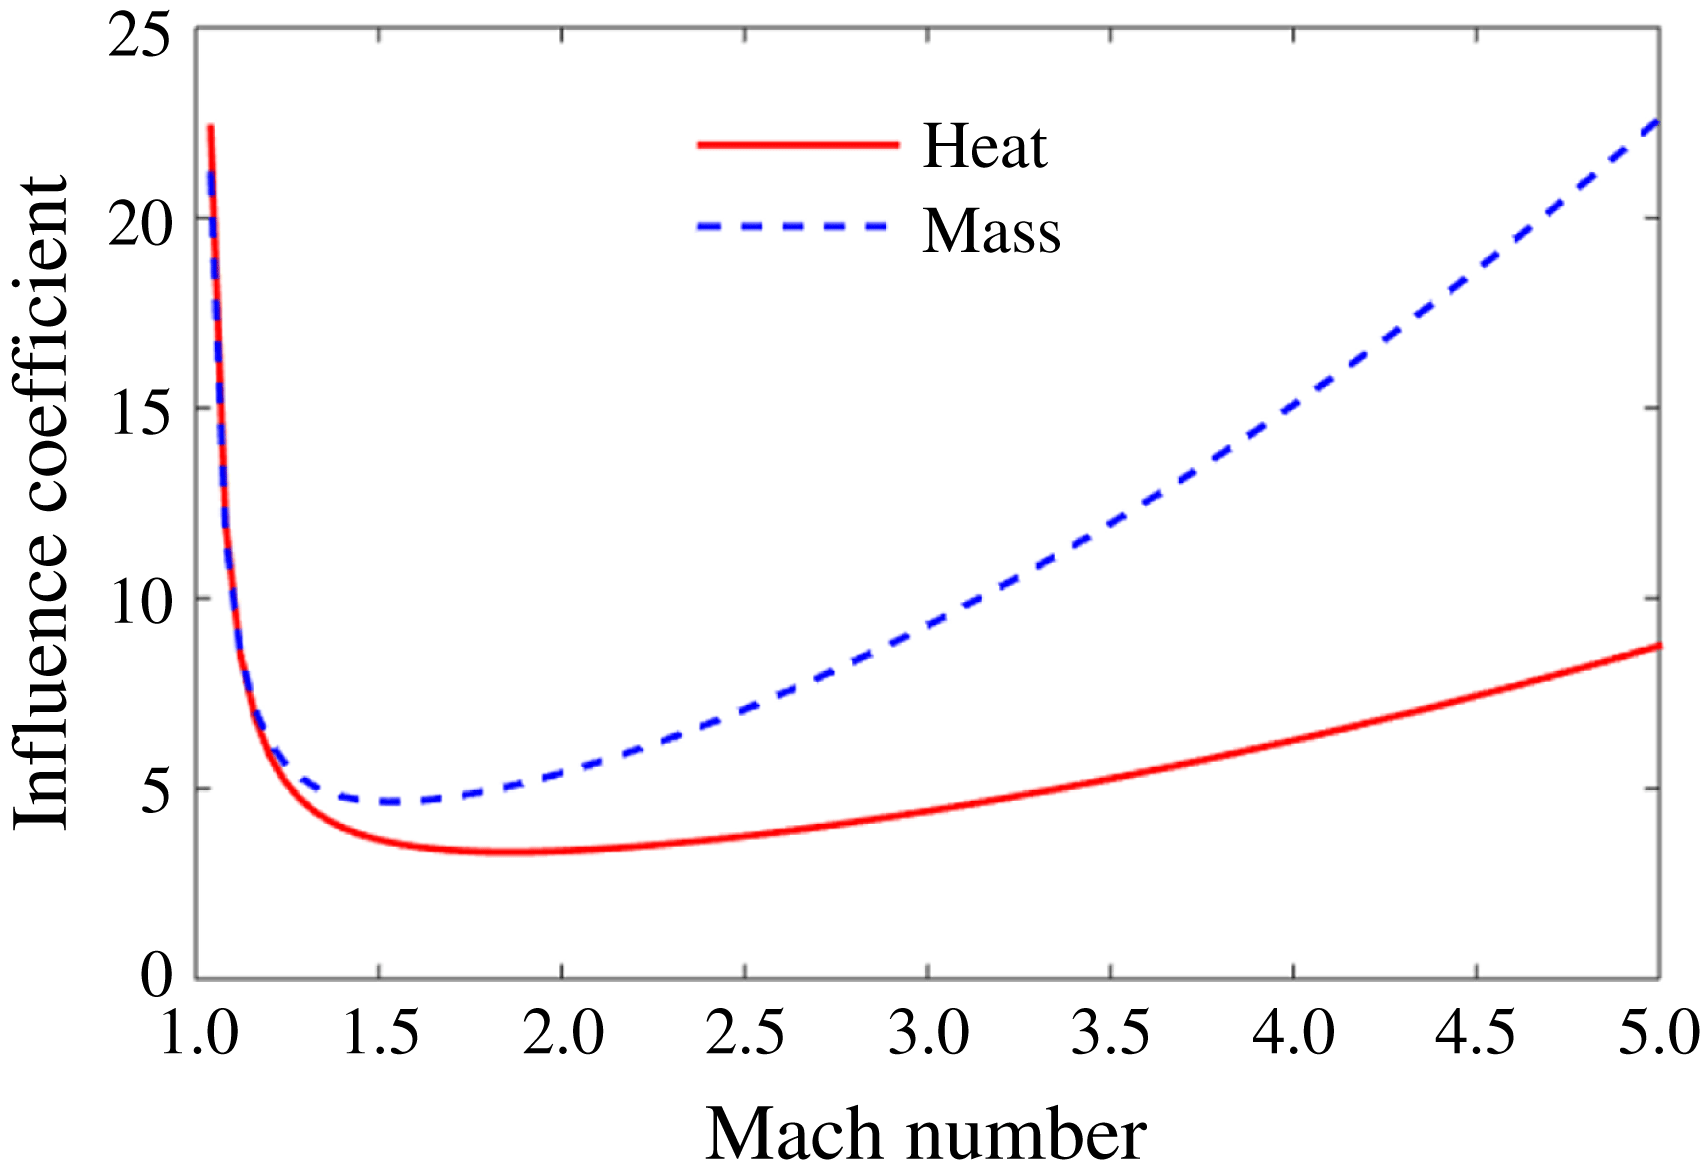
Influence coefficients of heat release and mass addition on the static pressure change in a compressible one-dimensional straight duct flow.

For Case 12, the stagnation temperature change due to cooling by the jet is included for analysis. In the analysis, the stagnation temperature change due to the jet is considered, and the heat loss from the channel wall is ignored in order to focus on the jet injection effect. A much higher mass flow rate (80 % of the channel mass flow rate) is required to induce unstart for this flow condition. This is mainly because the cooling by the cold jet negates the pressure rise from friction, area change and mass addition. The influence coefficients of the stagnation temperature change and the mass change are plotted as functions of the Mach number in figure 15. The contribution of mass addition to the pressure rise is always higher than that of the heat exchange except at lower Mach number (
 $M<1.2$
). However, the pressure rise due to mass addition is negated by cooling since
 $\text{d}T_{0}$
has a negative sign. Thus, a further increasing mass flow rate of the jet positively affects the pressure rise by mass addition and simultaneously negatively affects the pressure rise by cooling. As a result, a significantly higher mass flow rate is required to induce unstart than in the other two flow conditions in this section.
The last flow condition (Case 16) considered in this section has an opposite directional stagnation temperature change compared to Case 12. In this condition, the stagnation temperature increases due to the heat release from combustion. Therefore, the friction, the area change, the mass addition and the heat release positively contribute to the pressure rise, resulting in a decrement in the threshold in terms of mass addition. The inlet unstart is induced by adding 11.36 % of the scramjet channel mass flow rate from the jet to the free stream. This value is close to the value in Case 4, of 12.29 %. However, we cannot simply state that the effect from heat release is minimal since the flow blockage effect of the jet is significantly decreased by the jet momentum ratio in Case 16 (0.66), which is lower than that in Case 4 (2.13). In Case 16, the jet only penetrates approximately one-third of the channel height, which is a half of the penetration observed in Case 4. In other words, the heat release in Case 16 replaces mass addition and flow blockage effects on the pressure rise obtained in Case 4. Therefore, the heat release and the mass addition act as the dominant choking mechanisms.
When the flow undergoes unstart and the primary unstart shockwave detaches from the lip of the inlet, the mass spills from the inlet. The spillage affects unstart in two different ways. One is pressure rise when the mass flow rate ratio between the channel flow and the jet increases. Another effect is the pressure drop when the heat release decreases with less oxidizer. In the current flow conditions (Case 16), the latter has a stronger influence on the pressure change since the overall equivalence ratio of the channel becomes richer, leading to a poor burning rate. Therefore, the scramjet model flow begins to restart. Consequently, the primary unstart shockwave propagates downstream towards the lip of the inlet. Once the shock reaches the lip of the inlet, mass addition and heat release affect the pressure rise in the opposite direction to the detached shock condition. Since there is more mass captured by the scramjet model inlet, the mass flow rate ratio between the jet and the free stream decreases, leading to a lower pressure rise. However, the heat release increases as more oxidizer exists inside of the scramjet model, resulting in a higher pressure rise. The process is retroactive and the flow starts to oscillate.
6 Conclusion
The current study investigates unstart phenomena induced in three different flow conditions (i.e. low-enthalpy free stream – cold N
 $_{2}$
jet, high-enthalpy free stream – cold N
 $_{2}$
jet, and high-enthalpy free stream – ethylene jet) using experiments at a hypersonic wind tunnel facility which latter provides a wide range of free stream enthalpy and stagnation pressure. Wall surface pressure measurements and high-speed schlieren flow visualization are employed to investigate unstart. For flow visualization, an incoherent high-speed pulsed diode laser enables freezing of the transient flow features in unstart phenomena. The transient flow motion in the unstart process are investigated. In low-enthalpy free stream – cold N
 $_{2}$
jet flow conditions, the unstart shockwave system is visualized to be formed at the downstream of the jet location and propagates subsequently upstream. Using the flow visualization and pressure measurements it is revealed that the unstart shockwave has a quasi-steady state until it overcomes the pressure gradient generated by the jet injection. When the unstart shockwave passes through the jet, the unstart shockwave is accelerated due to the high pressure at the downstream of the jet. The duration of the unstart process depends on the mass flow rate ratio between the jet and the free stream. Although the flow features of the unstart shockwave system are not visualized because of the low free stream density at high-enthalpy free stream – cold N
 $_{2}$
jet and the high-enthalpy free stream – ethylene jet flow conditions, a similar unstart process can be inferred from the jet motion. The discrepancies of unstart threshold in terms of the jet momentum ratio between different flow conditions were explained using a simplified 1-D analysis and the Korkegi criterion.
The flow visualization near the scramjet model inlet reveals that a primary unstart shockwave and multiple secondary unstart shockwaves are generated. The primary unstart shockwave detaches from the lip of the inlet to match the pressure and spills mass from the scramjet model inlet. The reverse directional flow due to excessive mass injection is found to be a cause of multiple secondary unstart shockwaves.
Wall static pressure oscillations are detected after the scramjet model inlet unstart. Flow–combustion interactions, not acoustic resonances, were the cause of the dominant frequency of pressure fluctuation in a combustion-driven flow condition (i.e. high-enthalpy free stream – ethylene jet). In the presence of combustion, the pressure rise at the scramjet model is strongly influenced by the heat release from the combustion as well as by mass addition and flow blockage from the jet. As a result, the flow oscillation in thermally driven unstart is governed by the flow–combustion interactions. The interaction between the jet and the unstart shockwave leads to oscillatory flow motion at a certain frequency.
Acknowledgements
Authors from the University of Notre Dame were supported by the US Air Force Office of Scientific Research (AFOSR, FA9550-12-1-0161), monitored by C. Li of AFOSR. The authors gratefully acknowledge the support.
Supplementary movies
Supplementary movies are available at http://dx.doi.org/10.1017/jfm.2016.282.