Autism Spectrum Disorders are recognized as organic developmental disorders characterized by a triad of core deficits in three basic developmental areas: reciprocal social interaction, verbal and non-verbal communication and cognitive flexibility (DSM-IV). A high degree of variability exists in the disorder’s clinical manifestations, and other problems are frequently associated with autism’s nuclear characteristics, including mental retardation (Sigman & Caps, Reference Sigman and Capps1997) and behavior problems such as stereotyped, self-injurious or aggressive conduct (Bryson, Reference Bryson1996; Hastings, Reference Hastings2003) that persist for the long term (Einfeld, Tonge, & Rees, Reference Einfeld, Tonge and Rees2001).
Children with ASD exhibit special needs in all areas and contexts of development and can cause major familial disturbances (Altiere, Reference Altiere2006; Baker-Ericzen, Brookman-Frazee, & Stahmer, Reference Baker-Ericzén, Brookman-Frazee and Stahmer2005; Shu, Reference Shu2009; Smith et al., Reference Smith, Hong, Seltzer, Greenberg, Almeida and Bishop2010). Studies suggest that mothers of children with ASD are at an increased risk for stress (Hastings, Reference Hastings2003; Herring et al., Reference Herring, Gray, Taffe, Tonge, Sweeney and Einfeld2006; Pozo, Sarriá, & Méndez, Reference Pozo, Sarriá and Méndez2006). Compared to mothers of children with other disorders or with mothers of typically development children, mothers of ASD children exhibit higher stress levels (Baker, Blacher, Crnic, & Edelbrock, Reference Baker, Blacher, Crnic and Edelbrock2002; Baker-Ericzen et al., Reference Baker-Ericzén, Brookman-Frazee and Stahmer2005; Belchic, Reference Belchic1996; Cuxart, Reference Cuxart1995; Hasting & Johnson, Reference Hastings and Johnson2001; Pisula, Reference Pisula2007; Weiss, Reference Weiss2002).
Maternal stress is viewed as a complex set of non-specific, persistent and significant challenges associated with one of a mother’s most important roles: taking care of her own child (Pisula, Reference Pisula and Mohammadi2011). The theoretical framework adopted in most studies is the transactional model of stress and coping (Lazarus & Folkman, Reference Lazarus and Folkman1984). In this approach, stress is a particular type of an individual’s relationship with the environment, which the individual appraises as putting certain demands or overextending his/her resources, and thus threatening his/her well-being. Although the child’s autism severity level can predict maternal stress (Konstantareas & Papageorgiou, Reference Konstantareas and Papageorgiou2006), multiple studies indicate that concomitant behavior problems in ASD are more strongly associated with stress than is the severity of the disorder itself (Baker et al., Reference Baker, Blacher, Crnic and Edelbrock2002; Herring et al., Reference Herring, Gray, Taffe, Tonge, Sweeney and Einfeld2006; Lecavalier, Leone, & Wiltz, Reference Lecavalier, Leone and Wiltz2006; Tomanik, Harris, & Hawkins, Reference Tomanik, Harris and Hawkins2004). The relationship between behavior problems and stress has been found to be stable over time (Herring et al., Reference Herring, Gray, Taffe, Tonge, Sweeney and Einfeld2006).
The adaptation process over time for parents of children with ASD is complex. The needs and challenges facing families of children with ASD change as their children mature, causing families to shift aspects of their personal lives, their personal and professional relationships and their perceptions of the problem (Gray, Reference Gray2006; Scorgey & Sobsey, Reference Scorgie and Sobsey2000). To date, few longitudinal studies have examined these changes in stress and explicative variables of psychological adaptation of parents with children with ASD.
In relation to the characteristics of the child, the longitudinal studies report improvements in children with ASD in the three main areas affected by the disorder: cognitive, social and communicative development (Fecteau, Mottron, Berthiaume, & Burack, Reference Fecteau, Mottron, Berthiaume and Burack2003; McGovern & Sigman, Reference McGovern and Sigman2005). The findings in relation to behavior problems depend on the children’s age. Stability in behavior problems was found in longitudinal studies focused on toddlers with ASD and in studies focused on middle to late childhood (Lecavalier et al., Reference Lecavalier, Leone and Wiltz2006; Matson, Mahan, Hess, Fodstad, & Neil, Reference Matson, Mahan, Hess, Fodstad and Neil2010), with behavior problems declining in adolescents and young adults with ASD (Baker, Smith, Greenberg, Setlzer, & Taylor, Reference Baker, Smith, Greenberg, Seltzer and Taylor2011; Lounds, Seltzer, Greenberg, & Shattuck, Reference Lounds, Seltzer, Greenberg and Shattuck2007; Shattuck et al., Reference Shattuck, Seltzer, Greenberg, Orsmond, Bolt, Kring, Lounds and Lord2007).
Despite having a child with ASD and behavior problems, some families are resilient in adapting to the particular challenges of raising a child with ASD (Bayat, Reference Bayat2007; Gerstein, Crnic, Blacher, & Baker, Reference Gerstein, Crnic, Blacher and Baker2009; Twoy, Connolly, & Novak, Reference Twoy, Connolly and Novak2007). The children’s characteristics are not the only variables that influence parents’ psychological adaptation: other factors are also significantly related to maternal stress. Hastings and Johnson (Reference Hastings and Johnson2001) found that parents’ (92% mothers) stress levels were predicted predominantly by psychological variables (e.g., coping strategies and social support) rather than demographic variables. Additionally, multidimensional studies have shown that social support and perception of the problem play a role in explicative models of maternal stress (Bhen-Zur, Duvdevany, & Lury, Reference Ben-zur, Duvdevany and Lury2005; Pozo et al., Reference Pozo, Sarriá and Méndez2006; Saloviita, Itälinna, & Leinonen, Reference Saloviita, Itaelinna and Leinonen2003).
Dunst, Trivette, and Cross (Reference Dunst, Trivette and Cross1986) define social support “as a multidimensional construct that includes physical and instrumental assistance, attitude transmission, resource and information sharing, and emotional and psychological support” (p. 403). Social support may also refer to formal services one receives from professional organizations and/or services provided by more loosely structured organizations. Studies have examined the negative effects on mothers of a lack of social support (Bromley, Hare, Davison, & Emerson, Reference Bromley, Hare, Davison and Emerson2004; Gray & Holden, Reference Gray and Holden1992; Konstantareas & Homatidis, Reference Konstantareas and Homatidis1989; Sanders & Morgan, Reference Sanders and Morgan1997); their results indicate that a scarcity of social support is related to higher levels of stress, anxiety, depression and pessimism and to decreased social participation.
Social support can alleviate parental stress and improve parental responses to the child’s needs (Bristol, Reference Bristol, Schopler and Mesibov1984; Dyson, Reference Dyson1997; Sharpley & Bitsika, Reference Sharpley and Bitsika1997). Bristol and Schopler (Reference Bristol, Schopler, Schopler and Mesibov1983) have analyzed the differential effects of two types of support on stress, informal and formal support, defining informal support as a network that may include immediate and extended family, friends, neighbors, and other parents of children with disabilities while defining formal support as social, psychological, physical, or financial assistance provided either free or in exchange for a fee through an organized group or agency. Their results revealed that for mothers of children with autism, informal support appears to be a more effective stress buffer than does formal support.
A literature review on the relationship between social support and stress in mothers of children with autism (see Boyd, Reference Boyd2002; Meadan, Halle, & Ebata, Reference Meadan, Halle and Ebata2010) uncovered only a longitudinal study that examined the changes or stability of this explicative variable. Gray (Reference Gray2002, Reference Gray2006) reported changes over the course of 10 years in parents of children with ASD in their perceptions of social support, highlighting the decline of informal supports (those provided by family, neighbors and friends). During semi-structured interviews, parents revealed that the physical maturation of their child with ASD and grandparents’ declining physical capabilities, negatively affected the possibilities for care support of child with ASD.
Perception of the problem is another important factor related to stress in parents of children with developmental disorders. Saloviita et al. (Reference Saloviita, Itaelinna and Leinonen2003) showed that the most important predictor of parental stress is a negative definition of the situation. Other studies have measured positive aspects of problem perception that shield the family from stress and reduce the disability’s impact; these aspects include: a) hardiness (Ben-Zur et al., 2005; Gill & Harris, Reference Gill and Harris1991; Weiss, Reference Weiss2002); b) self-efficacy (Hastings & Brown, Reference Hastings and Brown2002); c) ambiguous loss (Boss, Reference Boss1999); and d) sense of coherence (Olsson & Hwang, Reference Olsson and Hwang2002). In particular, research on maternal stress for mothers with children with ASD has shown that the sense of coherence (SOC) has a significant and inverse association with stress (Mak, Ho, & Law, Reference Mak, Ho and Law2007; Oelofsen & Richardson, Reference Oelofsen and Richardson2006; Olsson & Hwang, Reference Olsson and Hwang2002; Pozo et al., Reference Pozo, Sarriá and Méndez2006). Mothers with higher levels of SOC show lower levels of stress.
The SOC concept was developed from the theory of salutogenesis proposed by Antonovsky (Reference Antonovsky1987), where it was conceptualized as follows:
A global orientation that expresses the extent to which one has a pervasive, enduring though dynamic feeling of confidence that: a) the stimuli deriving from one’s internal and external environments in the course of living are structured, predictable, and explicable; b) the resources are available to meet the demands posed by these stimuli; and c) these demands are challenges worthy of investment and engagement and that life make sense emotionally. (p. 19)
SOC is conceived as a personality characteristic or coping style emerging in childhood, becoming more defined during adolescence, and fully developed around age 30 (Antonovsky & Sagy, Reference Antonovsky and Sagy1986). Studies focused on family resilience across different contexts and disorders (McCubbin & McCubbin, Reference McCubbin, McCubbin, Danielson, Hamel-Bissel and Winstead-Fry1993) have shown that SOC can protect against stress. People with a strong SOC perceive the world as predictable, manageable and meaningful, and they view stressors as important challenges that are worth facing (Antonovsky Reference Antonovsky1992). Some studies have found that SOC is positively related to psychological health and well-being (Cohen & Dekel, Reference Cohen and Dekel2000; Ericksson & Lindström, Reference Ericksson and Lindtröm2006; Pallant & Lae, Reference Pallant and Lae2002; Sagy, Antonovsky, & Adler, Reference Sagy, Antonovsky and Adler1990).
As a stable trait, SOC may be adversely affected by crisis situations, but can be reset and restored to its previous values over time (Antonovsky, Reference Antonovsky1987). The diagnosis and the difficulty of living with a child with ASD can be viewed as a crisis, or at least as an acute stressor that adversely affects parental SOC levels. Comparative studies show that parents of children with ASD have a significantly lower level of SOC than parents of children with typical development or parents of children with intellectual disabilities who do not have autism (Oelofsen & Richardson, Reference Oelofsen and Richardson2006; Olsson & Hwang, Reference Olsson and Hwang2002).
Olsson and Hwang (Reference Olsson and Hwang2002) go further and raise the interesting question of whether parenting a child with autism could become a chronic stressor —a generalized and lifelong condition or characteristic embedded in a person’s life— that influences the parent’s SOC level negatively over time. Their hypothesis, that a child with ASD in the family is a chronic stressor that influences the parents’ SOC level negatively over time, is only partly supported. They initially found lower SOC levels in parents of children with ASD, but their study was cross-sectional and found no relation between the child’s age and SOC levels in parents of children with intellectual disabilities or autism (Olsson & Hwang, Reference Olsson and Hwang2002). The authors pointed out the necessity of longitudinal research to characterize the nature of parenting a child with ASD as an acute or chronic stressor through an analysis of how SOC changes over time.
Studies have demonstrated that mothers of children with ASD present stress levels higher than those of mothers who have typically developing children or children with other developmental disabilities. Mothers and fathers share parenting roles, but mothers typically shoulder greater responsibility for meeting the needs of children with ASD (Gray, Reference Gray2003). Most research on stress levels of parents with ASD has been conducted with mothers (Meadan et al., Reference Meadan, Halle and Ebata2010). Mothers are fundamentally involved in providing for the needs of a child with ASD, and preserving their psychological well-being is crucial for ensuring that their children receive optimal care. In addition, mothers of children with ASD showed significant reductions in child-related stress after participating in certain programs (Brookman-Frazee & Koegel, Reference Brookman-Frazee and Koegel2004; Tonge et al., Reference Tonge, Brereton, Kiomall, Mackinnon, King and Rinehart2006). However, to improve interventions, we first must advance in comprehension. Multiple studies have examined variables related to maternal stress, but the cross-sectional nature of the available data limits our ability to answer questions about the direction of effect between variables. Research founded on longitudinal studies is therefore necessary to deepen our knowledge of relationships’ effect directions.
We conducted the present longitudinal study with two main objectives: to focus on predicting maternal stress by determining whether the child’s, behavior problems, social support, and SOC predict the maternal stress levels 4.5 years later and to examine stability or shifts occurring in stress and predictive variables (behavior problems, social support, and SOC over time.
Because previous research has shown that behavior problems, social support and SOC play important roles in explaining stress, we expect these factors to also play a role as predictors of stress over time.
Regarding the second objective, we propose the following hypothesis to compare the values at time 1 (T1) and time 2 (T2). Given the average age of children with ASD in our study (M = 12.19 years; SD = 7.19) and based on the results of Baker et al. (Reference Baker, Smith, Greenberg, Seltzer and Taylor2011) and Lounds et al. (Reference Lounds, Seltzer, Greenberg and Shattuck2007), we would expect a decrease in behavior problems. Due to the demonstrated relationship between behavioral problems and maternal stress, if we expect a decrease in behavioral problems we will also expect to see a decrease in maternal stress levels. In relation to social support, Gray (Reference Gray2006) reported a decrease in informal support related to changes in family support, indicating we should also expect decreases in social support. Regarding SOC, the lack of published longitudinal studies leaves us ignorant about the evolution of SOC over time in parents of children with ASD. According to Antonovsky (Reference Antonovsky1987), SOC as a stable trait may be adversely affected by crisis situations but over time can be reset and restored to its previous values. We can predict that, over time, mothers of children with ASD will increase their SOC values. Experience and better knowledge of their children’s conditions and needs may increase their perception of life as more orderly, predictable, and manageable.
Method
Participants
Thirty-nine mothers participated in the first study, 21 of who participated in the follow-up study performed approximately 4.5-years later (given a possible variation of three months depending on the delivery and collection of questionnaires).
The loss of 18 participants from the initial study was due to the following: a) 14 mothers who could not be located and b) 4 who were located but declined to participate. We only had data on the initials of the children with ASD, their date of birth, and their educational centre, meaning it was difficult contact mothers of children who had changed schools in those 4.5 years.
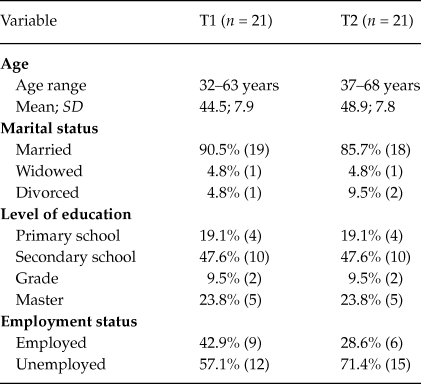
Descriptive characteristics of these 21 mothers at T1 and at T2 are presented in Table 1. Neither the mothers’ marital status nor the level of education varied significantly between T1 and T2. Notably, in relation to their professional work, the percentage of mothers employed outside of the home decreased significantly over time. The McNemar test indicated that this change was significant (p = .03).
Demographic characteristics of mothers at time 1(T1) and time 2 (T2)

The average age of children with ASD in the study was 12.19 years (SD = 7.19) at T1 and 16.7 years (SD = 7.04) at T2; 17 were male, and 4 were female. The children’s diagnosis remained unchanged, with 18 being diagnosed with Autistic Disorders, 1 with Disintegrative Disorders and 2 with Pervasive Developmental Disorders Not Otherwise Specified (all belonging within the category of Autism Spectrum Disorders). These children continued to attend the same schools.
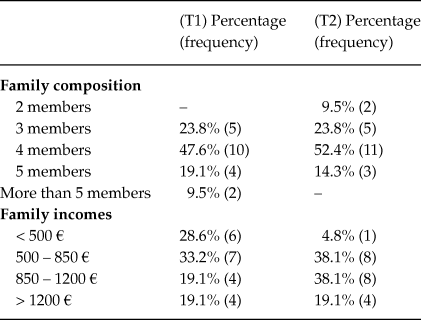
We detected a decrease in the number of members of the family units being studied (see Table 2). Family income had typically increased by the second time point, primarily for those in the lower income ranges.
Family composition and family income per month at time 1 (T1) and at time 2 (T2)

Procedure
In our initial study we contacted psychologists in three specialist schools for children with autism as well as an association dedicated to psychological support for families. We relied on non-probability sampling based on centers’ and individuals’ accessibility to the researcher and their availability for participation (convenience sample). Data were collected through questionnaires delivered at the schools. After 4.5 years, we re-contacted these psychologists to inform mothers of the follow-up study and the importance of providing more data about their children and families. The psychologists distributed the questionnaires in agreement with the researchers.
Instruments
A brief questionnaire designed by the research team was used to obtain demographic information on mothers, children and families. This questionnaire included an item about the degree of severity of children’s behavior problems as perceived by their mothers. Behavior problems were assessed on a 4-point severity scale ranging from 0 (no problem) to 3 (a severe problem). A study with 95 Spanish mothers of children with ASD (Pozo, Reference Pozo2010) reported that the measures provided by this item showed a significant correlation (r = .55, p < .01) with scores from the Behavior Problems Inventory considered a reliable and valid behavior rating instrument for behavior problems in individuals with mental retardation and developmental disabilities (Rojahn, Matson, Lott, Svensen, & Smalls, Reference Rojahn, Matson, Lott, Svensen and Smalls2001).
Additionally, three questionnaires administered in Spanish evaluated social support, SOC and stress variables. We translated the following instruments into Spanish: the Checklist of Support for Parents of the Handicapped, the Sense of Coherence Questionnaire, and the Parental Stress Index Short Form. We adopted the technique of back-translation to ensure translational accuracy. Researchers performed the translation from the original version in English to Spanish first, after which two bilingual experts translated the Spanish versions back into English. We finally compared differences between the two versions and corrected the final Spanish version.
The Checklist of Support for Parents of the Handicapped (CSPH; Bristol, Reference Bristol1979). This is a 23-item questionnaire rated using a 5-point item scale ranging from 0 (nothing useful) to 4 (very useful). The instructions instructed the participant to cross out items related to support unavailable to her. The questionnaire consists of three subscales: a) informal support provided by people close as family and friends, b) formal support or services offered by professionals, and c) informational support or resources to obtain information about the disorder. The total score is obtained by summing all items. This total score includes both information on the amount of support available and the perceived usefulness of that social support. Unavailable support (items crossed by the participants) scored 0 points. In the present study the reliability for total support based on Cronbach’s alpha was .82. For the informal, formal and informational subscales, the reliabilities were .65, .64 and .85, respectively.
The Sense of Coherence Questionnaire (SOC; Antonovsky, Reference Antonovsky1987). This is a 29-item questionnaire rated using a 7-point item scale, with higher scores indicating stronger SOC. Eleven items contribute to comprehensibility (the ability to understand life events and situations as clear, ordered and structured), 10 to manageability (a sense of feeling that life is under control and the person can manage its demands) and 8 to meaningfulness (the perception that life situations are meaningful and are challenges worth facing). The internal consistency of the original questionnaire, measured by Cronbach’s alpha, was .88, with strong test-retest reliability (Antonovsky, Reference Antonovsky1993). The alpha coefficient for the present study was .80 for total SOC. For comprehensibility, manageability and meaningfulness, the subscale reliabilities were .75, .76 and .75, respectively.
Parental Stress Index Short Form (Abidin, Reference Abidin1995). This is a 36-item self-report questionnaire using a 5-point item ranging from 1 (totally disagree) to 5 (totally agree). A score above 90 points for total stress indicates a clinically significant level of stress. Total stress was analyzed in three dimensions: a) the child domain (reflects the stress experienced as a result of the parent’s perceptions of the child’s characteristics and the demands made upon them by the child), b) the parental domain (reflects the stress arising from the parent’s perceptions of themselves and their functioning as a parent), and c) the parent-child interaction domain (reflects the stress caused by the perception of dysfunctional interaction with the child). The reliabilities for the subscales in the study were good, with Cronbach’s alpha for child, parent and interaction domains of .85, .75 and .76, respectively. The reliability of the total scale shown in the study was also good (α = .88). This value is close to that obtained in a recent study using a Spanish sample (Díaz-Herrero, Brito de la Nuez, López Pina, Pérez-López, & Martínez-Fuentes, 2010) with a version adapted into Spanish by these authors, who report an index of internal consistency of .91 for the total scale.
Results
The SPSS 15 program was used to perform stepwise regression and the repeated-measures t-test. The G* Power 3.1 program (Faul, Erdfelder, Buchner, & Lang, Reference Faul, Erdfelder, Buchner and Lang2009) was used for the post hoc power analysis and to calculate the effect size.
Regression
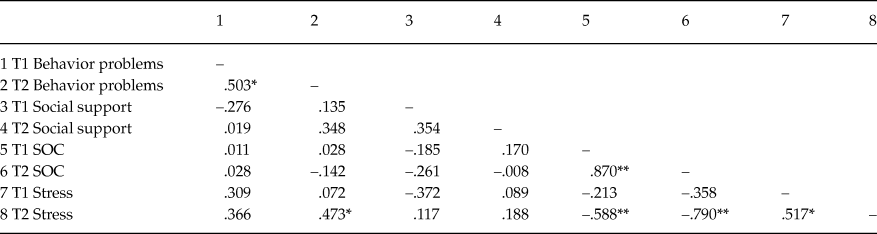
Pearson correlations were calculated for the total measures of study variables at time 1 (T1) and time 2 (T2). As seen in Table 3, significant correlations were obtained between the two time measurements of all variables (behavior problems, SOC and stress), except social support. Stress was also positively associated at T2 with behavior problems and was strongly negatively associated with SOC. The only one significant correlation over time was the association between SOC at T1 and stress at T2.
Pearson correlations coefficients for total measures of study variables at time 1(T1) and time 2 (T2)

* p < .05; **p < .01.
A stepwise multiple regression model was run to determine if stress T2 (variable dependent) could be predicted from behavior problems, total SOC and total stress scores at T1 (predictor variables). The social support variable was excluded from the analysis due to the lack of significant correlation with other study variables. The null hypotheses tested were that multiple R 2 was equal to 0 and that the regression coefficients were equal to 0. There were no missing values for the total scores of any of the scales. Missing values were limited to specific items of the questionnaires and were not always identical. The rates of all missing data were less than 1%. We applied average values from existing values in place of these missing data. The data were screened for violation of assumptions prior to analysis.
Linearity: Review of the partial scatterplot of the predictor variables and the dependent variable indicated that linearity was a reasonable assumption. Normality: The assumption of normality was tested via examination of the unstandardised residuals. Review of the Shapiro-Wilk test of normality (SW = .822, df = 3, p = .17) suggested that normality was a reasonable assumption. Independence: The Durbin-Watson statistic was computed to evaluate independence of errors and was 1.734, which is considered acceptable (on a range of values between 1 and 3). This suggests that the assumption of independent errors has been met. Homogeneity of variance: Review of the scatterplots of studentised residuals against the predicted values and studentised residuals against values of predictor variables provided evidence of homogeneity of variance. Multicollinearity: Tolerance was greater than .10 (.96) and the variance inflation factor was less than 10 (1.05), suggesting that multicollinearity was not an issue.
The results of the regression analysis for total stress at T2 are presented in Table 4. We used the Adjusted R 2 index, which indicates the percentage of variation in the dependent variable explained after adjusting for sample size and the number of predictors. The SOC measure is the main explicative variable, accounting for a significant amount of the variance in stress (Δ adjusted R 2 = .31). Specifically, lower levels of SOC among mothers at T1 predict higher levels of stress at T2 (β = –.59, p < .01). Stress at T1 also accounts for a substantial amount of the variance in the stress (Δ adjusted R 2 = .14). In this case, higher levels of stress at T1 predict higher levels of stress at T2 (β = .41, p < .05). This regression model does not include the third predictive variable proposed in the analysis, indicating that behavior problems do not account for a significant amount of variance after including SOC and stress at T1 as predictive variables. Multiple adjusted R 2 (.45) indicates that approximately 45% of the variation in stress at T2 was predicted by SOC and stress at T1. Interpreted according to Cohen (Reference Cohen1992), this suggests a large effect (ƒ2 = .82). The post hoc power for the overall multiple regression model was .89 (power equal .80 or above is interpreted as sufficient).
Regression analysis predicting the total stress at time 2

** p < .01; *p < .05.
Changes over time: comparative analysis
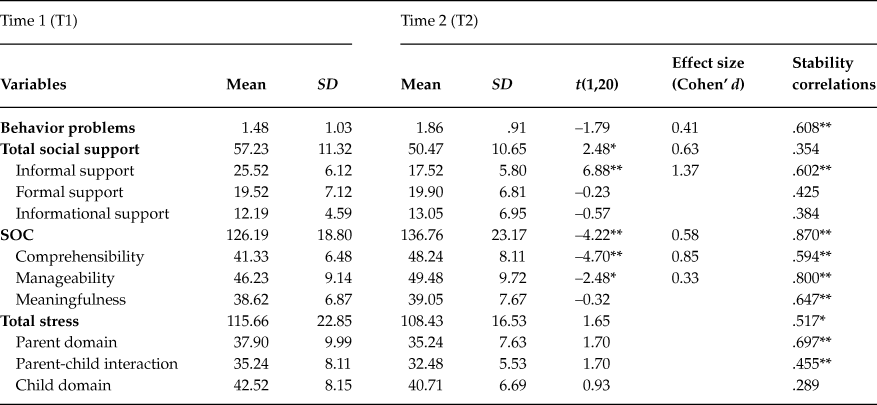
Descriptive statistics for stability and for the change over time for behavior problems, social support, SOC, and stress measures are presented in Table 5. A t-test was applied for behavior problems (t(20) = –1.79, p = .08), which did not change significantly between the two time periods. As indicated in the table, the stability correlation was high and significant (r = .61, p < .01).
Descriptive statistics for stability and change over time for behavior problems, social support, sense of coherence (SOC) and stress

** p < .01; *p < .05.
t-tests were applied for social support and revealed that the total support score was significantly lower at T2, (t(20) = 2.48, p = .02, Cohen’s d = .63). The analysis also showed that informal support significantly decreased over time, (t(20) = 6.88, p < .01, Cohen’s d = 1.37), presenting a significant stability correlation, (r = .6, p < .01).
In relation to SOC, a t-test showed that the total SOC score increased over time (t(20) = –4.22, p < .001, Cohen’ d = .58), as did the two components of SOC, comprehensibility (t(20) = –4.70, p < .001, Cohen’ d = .85) and manageability (t(20) = –2.48, p = .02, Cohen’ d = .33). Table 5 shows that the stability correlations are high and significant for the total SOC and for the three subscales, presenting a stability coefficient average of r = .73.
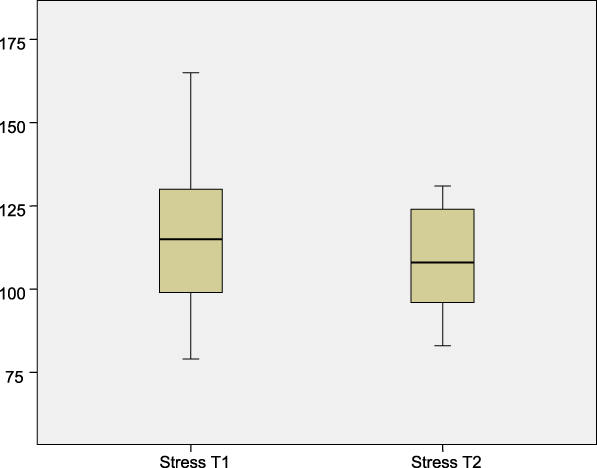
The total stress and parent and child domains were stable over time, with stability coefficients averaging r = .56. Regarding total stress, the mean score at T2 (M = 108.43) was lower than the mean at T1 (M = 115.66). It should be noted that in the “box and whisker” plot (see Figure 1), the stress measures present less variability at T2. In particular, the 95% confidence interval was (105.27, 126.07) at T1 and (100.90, 115.96) at T2.
Box and whisker plot stress T1 and stress T2.

The subscales also exhibited a decrease in variability. The 95% confidence intervals were the following: (33.36, 42.45) at T1 and (31.77, 38.71) at T2 for the parent stress domain; (31.54, 38.93) at T1 and (29.96, 34.99) at T2 for the child-parent interaction domain; and (38.81, 46.23) at T1 and (37.66, 43.76) at T2 for the parent stress domain.
Discussion
This study focuses on change analysis and the prediction of stress in mothers of children with ASD. We have studied the relationship between behavior problems, social support and SOC variables and the stress levels in mothers over time in a longitudinal study. Moreover, we have analyzed changes in stress and its predictive variables.
Regarding the analysis of change in variables over time, in contrast to what was predicted by the hypotheses, results show that both the perception of the severity of behavior problems of children with ASD and the degree of their mothers’ stress did not show significant changes over the 4.5-year period. We consider it important to note that the level of stress experienced by mothers exceeded clinical significance (90 points) at both time points (M = 115.66 at T1 and M = 108.43 at T2). The percentage of mothers with levels of stress over 90 points was 90.5% at T1 and 81% at T2. It is necessary to point out that we do not have normative scale data in a Spanish sample. We could find only one recent study on the psychometric properties of the PSI scales of Spanish parents of infants with typical development (Díaz-Herrero, López-Pina, Pérez-López, Brito de la Nuez, & Martínez-Fuentes, Reference Díaz-Herrero, López-Pina, Pérez-López, Brito de la Nuez and Martínez-Fuentes2011), which did not provide data on the scale as a clinical tool.
Less stress was observed at the second time-point, but this difference was not significant. However, the confidence intervals reflect an interesting decline in the variability of stress measurements. Examining box and whisker plots for stress at T1 and T2, we notice that the decrease in variability is due to the more extreme values of stress at T1 being closer to the median T2 — in particular, the highest values of stress at T1 decrease at T2. That is, the decrease of stress in the group of mothers is not large enough to reach statistical significance, and a very high percentage of mothers still score above the clinically significant level of stress, though there is an improvement in terms of psychological adaptations to decrease stress in mothers with more extreme values at the first time of measurement.
As was mentioned in the introduction, several studies have shown that these two variables (behavior problems and stress) are closely related. The lack of significant changes in stress levels could be explained by the lack of change in child behavior problems. Although educational interventions improve the degree of flexibility and alleviate repetitive or stereotypical behaviors (Bryson, Reference Bryson1996; Hastings, Reference Hastings2003), these improvements were not manifested in our study, possibly owing to the high average age of children in the first study, when the most notable benefits of the educational intervention would have already been gained. Indeed, the perception of behavior problems reported by mothers reflected a medium degree of severity at both time-points (M1 = 1.49 and M2 = 1.87, range 0–3). It is pertinent to recall here that the behavior problems variable in this study does not analyze the problems themselves but rather the mothers’ perception of the severity of their children’s behavior problems.
There was a significant decrease in the social support experienced by mothers. The subscale-specific analysis showed a significant decrease in the informal support but not in the formal support, as Gray (Reference Gray2006) found in his study. It may be pertinent to recall here that the data on the family composition at the two times (Table 2) showed a reduction in the number of members. This decrease may be associated with the decline in informal support. Siblings of the child with ASD growing up and leaving home or the death of grandparents may deprive mothers of a large amount of informal support.
The SOC increased significantly over time, specifically in the dimensions of comprehensibility and manageability. That is, with time and acquired experience, mothers were better able to understand their situation and to handle the specific needs of their children. This is particularly relevant for several reasons.
The finding of increase in SOC can positively resolve the question of whether the presence in a family of a child with ASD is a chronic stressor that negatively influences the parents’ SOC level over time, as posed by Olsson and Hwang (Reference Olsson and Hwang2002), or if, on the contrary, experience allows the parents of children with ASD to feel in greater control of the situation and thus to recover SOC. The results of the study are consistent with the hypothesis of other authors: raising a child with a disability can be a life-changing experience that causes families to examine their belief systems (Dale, Jahoda, & Knott, Reference Dale, Jahoda and Knott2006) and that can change their world views, values, and priorities for gaining control and sense of coherence (King et al., Reference King, Zwaigenbaum, King, Baxter, Rosenbaum and Bates2006).
Regression analysis identifies SOC as the major predictor of stress for mothers after 4.5 years, accounting for 31% of the variance of stress. Mothers with a high SOC consistently presented lower stress values even 4.5 years later. This finding is consistent with research highlighting the protective role of SOC on health and psychological adaptation (Eriksson & Lindström, Reference Ericksson and Lindtröm2006; Pozo, Sarriá, & Brioso, Reference Pozo, Sarriá, Brioso and Mohammadi2011).
This finding is relevant for both methodological and applied reasons. First, we found more than a significant correlation between SOC levels and stress and the predictive power of SOC. The longitudinal nature of the data, allow us to clarify the direction of effect. The only significant correlation over time was the association between SOC at T1 and stress at T2. There is no association between stress at T1 and SOC at T2. This suggests that the direction of effects is such that SOC affects stress. SOC appears as a protective variable associated with lower levels of stress.
As stated earlier, parents of children with autism can reduce their stress and experience improvements in mental health by participating in specific programs (Brookman-Frazee & Koegel, Reference Brookman-Frazee and Koegel2004; Tonge et al., Reference Tonge, Brereton, Kiomall, Mackinnon, King and Rinehart2006), and SOC is a psychological variable with clearly identifiable dimensions that can become the target of specific interventions. These dimensions are comprehensibility (the extent to which stimuli from one external and internal environment are structured, explicable and predictable), manageability (the extent to which resources are available to a person to meet the demands posed by these stimuli), and meaningfulness (the extent to which these demands are challenges worthy of investment and engagement) (Antonovsky, Reference Antonovsky1987).
To increase the cognitive component of SOC (comprehensibility), professionals should provide parents with clear information about the disorder’s characteristics (alterations in basic abilities such as reciprocal social interaction, verbal and nonverbal communication, flexibility, and their selection of interests and behavior) and the risk of other problems associated with challenging behavior and sensory problems. At the same time, to improve manageability, it is important to work with families to identify their needs and appropriate sources of support for resolving daily problems. Training parents in coping strategies will enable them acquire feelings of control and manageability over their lives.
It is essential to understand that a strong SOC is not a particular coping strategy. Potential stressors in life are so numerous and so varied that there is no pattern of coping that fits all of them. For coping to be successful, it is important to respond appropriately, given the nature of the stressor. Providing parents with a wide repertoire of coping strategies, including cognitive, emotional and instrumental, along with the flexibility to choose and implement the most appropriate strategy for each challenge at a given time should be important objectives of professional interventions to help families of children with ASD. Finally, with professional advice, parents can change their belief systems, expectations and goals, learning that demands can be perceived as challenges that are worthy of investment and engagement. The high predictive power of SOC over stress highlights the importance of its consideration in professional interventions with families from the very first moments of engagement.
When considering the findings and implications of the present study, it is important to note its limitations. First, the size of the sample was small. The ratio of participants to variables of the study does not fit the rule of thumb of multiple regression analysis. Although the effect size and especially the power of the analysis have allowed us to considerer the result and draw conclusions, it would have been desirable to have a larger sample. Moreover, the small sample size limited the possibility of including other potentially relevant predictors in our analysis. Second, the high average age of children even at the first time of measurement could limit the sensitivity for changes in some of the study variables, such as behavior problems or social support. In addition, several of our measures were not optimal, like the brief measure of behavior problems and the lack of Spanish normative data of the scales. Finally, another limitation of the study was the necessity of using volunteers as participants whose answers do not inform us of the possible responses of mothers who chose not to participate.
Despite these limitations, we believe that the study provides new findings that will help researchers and clinicians better understand the complexity of how mothers of children with ASD adapt to their situation over time. One major aspect stands out as a possible point for intervention: the protective role of SOC and its resilience to stress.