Introduction
Cattle populations from some of the Latin American countries has its origin from populations brought to America by Christopher Columbus since its second expedition (1 493) from the Iberian peninsula, mainly from Andalucia and Extremadura and from Canary Islands which had cattle from Portugal and Africa (Rouse, Reference Rouse1977; de Alba, Reference de Alba and Hodges1987; Primo, Reference Primo1992). Later in 1 521 the cattle arrived to Mexico at several places along the Mexican Gulf coast from Cuba, Haiti and Jamaica. It is known that by 1 565 the cattle arrived on the Nayarit Pacific coast, reaching the Baja California peninsula in 1 670 (Rouse, Reference Rouse1977). Currently these cattle are known as creoles, chinampos or local domestic cattle breeds. These creoles breeds are composed of non-selected populations raised in traditional production systems and they seem to be well adapted to a wide range of environments, showing high levels of phenotypic variability (Ulloa-Arvizu et al., Reference Ulloa-Arvizu, Montaño, Gayosso-Vázquez, Ramos-Kuri, Estrada and Alonso2008; Espinoza Villavicencio, Guevara Franco and Palacios Espinoza, Reference Espinoza Villavicencio, Guevara Franco and Palacios Espinoza2009). Mexican creole cattle have been characterized using molecular markers like short tandem repeats (STRs), mitochondrial D-Loop, Y-chromosome and single-nucleotide polimorphism (SNPs) (Fernández et al., Reference Fernández, Ríos Ramírez, Gayosso Vázquez, Ulloa-Arvizu and Alonso Morales2008; Ulloa-Arvizu et al., Reference Ulloa-Arvizu, Montaño, Gayosso-Vázquez, Ramos-Kuri, Estrada and Alonso2008; Ginja et al., Reference Ginja, Melucci, Quiroz, Martínez López, Revidatti, Martínez-Martínez, Delgado, Penedo and Gama2009; Delgado et al., Reference Delgado, Martínez, Acosta, Alvarez, Armstrong, Camacho, Cañón, Cortés, Dunner, Landi, Marques, Martín-Burriel, Martínez, Martínez, Melucci, Muñoz, Penedo, Postiglioni, Quiróz, Rodellar, Sponenberg, Uffo, Ulloa-Arvizu, Vega-Pla, Villalobos, Zambrano, Zaragoza, Gama and Ginja2012), and more recently, Giovambattista et al. (Reference Giovambattista, Takesima, Ripoli, Matsumoto, Franco, Saito, Onuma and Aida2013) reported the range of variation at the Major Histocompatibility Complex (MHC) DRB3.2 locus in South America Creole cattle breeds. The MHC is a phenomenal resource of the immunological system for the recognition of antigen peptides from pathogens to mount a proper immune response. The MHC codifies class I and II molecules. MHC class I receptors capture and present intracellular antigens to cytotoxic T-cells and MHC class II receptors capture and present intracellular antigens to helper T-cells. High variability of MHC is present at nucleotide level that translates in a heterodimeric cell surface α and β receptors with broader recognition capabilities of foreign peptides to be presented to T-cells to initiate an immune response (Male et al., Reference Male, Brostoff, Roth and Roitt2013). Particularly, the exon 2 of the β-chain of the MHC class II receptor called bovine lymphocyte antigen DRB 3.2 (BoLA-DRB3.2) (Lewin, Reference Lewin1989; Kelm et al., Reference Kelm, Deitilleux, Freeman, Kehrli, Dietz, Fox, Butler, Kasckovics and Kelly1997), is a suitable gene candidate to study genetic variability in cattle populations. Thus, documenting variability of the DRB3.2 will provide a broader insight of immunogenomic diversity, population dynamics and better understanding of allele frequencies of the DRB3.2 within Mexican creole cattle. In Mexico, creole cattle populations are mostly distributed in isolated areas limited by natural barriers (seas, rivers, semi-desert and mountains). Previous studies have shown that Mexican creole cattle populations have high genetic diversity because of mean number of alleles reported: 5.5–10.8 and 10.2–13.6 (Fernández et al., Reference Fernández, Ríos Ramírez, Gayosso Vázquez, Ulloa-Arvizu and Alonso Morales2008; Ulloa-Arvizu et al., Reference Ulloa-Arvizu, Montaño, Gayosso-Vázquez, Ramos-Kuri, Estrada and Alonso2008). The objective of this study was to determine the genetic diversity in populations of creole cattle in two regions of northwestern Mexico based on the polymorphism of the locus BoLA-DRB3.2.
Materials and methods
Sampling areas
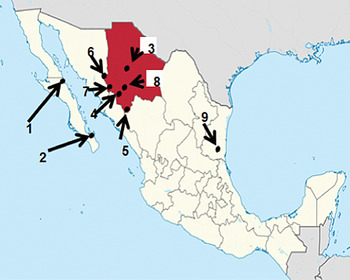
Blood samples were obtained from creole cattle (Bos taurus) from two northwestern states of Mexico: Chihuahua and Baja California Sur. In Chihuahua, creole cattle is mainly concentrated in the Western Mountain Range with approximately 45 000 heads of cattle; while creole cattle from Baja California Sur, held approximately 33 000 cattle in two semiarid regions (SAGARPA, 2014). Three populations were sampled in Chihuahua: Cerocahui (n = 10), Guadalupe y Calvo (n = 11) and Cuauhtémoc (n = 16), and two towns in Baja California Sur: La Paz (n = 10) and Mulegé (n = 9) (Figure 1). Animals were randomly chosen in several herds in each locality that included both sexes. Verbal verification of no relationship between sampled creoles was confirmed.
Geographic location of the populations in the actual study and those reported previously by Fernández et al. (Reference Fernández, Ríos Ramírez, Gayosso Vázquez, Ulloa-Arvizu and Alonso Morales2008). 1) Mulegé, 2) La Paz, 3) Cuauhtémoc, 4) Cerocahui, 5) Guadalupe y Calvo, 6) Moris, 7) Chínipas, 8) Guachochi and 9) Tamaulipas.

Polymerase chain reaction-restriction fragment length polimorphism (PCR-RFLP) of BoLA-DRB3
The methodology of DNA extraction and the conditions of PCR, cloning and digestion of amplicons were described by Fernández et al. (Reference Fernández, Ríos Ramírez, Gayosso Vázquez, Ulloa-Arvizu and Alonso Morales2008). The second exon of the BoLA-DRB (284 pb) was amplified by PCR. For this purpose, a pair of oligonucleotides previously described by van Eijk, Stewart-Haynes and Lewin (Reference van Eijk, Stewart-Haynes and Lewin1992) (HL030: 5′-ATCCTCTCTCTGCAGCACATTTCC-3′ and HL032: 5′-TCGCCGCTGCACAGTGAAACTCTC-3′) were used. The amplification of the BoLA-DRB3.2 gene was performed in a single PCR reaction rather than two subsequent hemi-nested reactions as originally proposed by van Eijk, Stewart-Haynes and Lewin (Reference van Eijk, Stewart-Haynes and Lewin1992).
Allele nomenclature with PCR-RFLP patterns proposed by Davies et al. (Reference Davies, Joosten, Anderson, Arriens, Bernoco, Bissumbhar, Byrns, van Eijk, Kristensen and Lewin1994) was used. The corresponding PCR-RFLP patterns are also comparable with those previously reported by van Eijk, Stewart-Haynes and Lewin (Reference van Eijk, Stewart-Haynes and Lewin1992), Gelhaus et al. (Reference Gelhaus, Schnittger, Mehlitz, Horstmann and Meyer1995), Gilliespie et al. (Reference Gilliespie, Jayarao, Dowlen and Oliver1999), Maillard et al. (Reference Maillard, Renard, Chardon, Chantal and Bensaid1999), da Mota et al. (Reference da Mota, Gabriel, Martinez and Coutinho2002), Martínez et al. (Reference Martínez, Toro, Montoya, Burbano, Tobón, Gallego and Ariza2005), Behl et al. (Reference Behl, Verma, Behl, Mukesh and Ahlawat2007), Sadeghi et al. (Reference Sadeghi, Nassiry, Heydarpour, Shahroudi, Mosafer and Motagh2008), Fernández et al. (Reference Fernández, Ríos Ramírez, Gayosso Vázquez, Ulloa-Arvizu and Alonso Morales2008) and Pashmi et al. (Reference Pashmi, Qanbari, Ghorashi, Sharifi and Simianer2009). Cattle BoLA-DRB nomenclature with alleles names, DBR3-RFLP, and their local names are described in the IPD (2003) website (http://www.ebi.ac.uk/cgi-bin/ipd/mhc/view_nomenclature.cgi?bola.drb3). With the advent of new molecular techniques like capillary sequencing, the nucleotide sequences of BoLA genes can be read out more precisely for allele identification and comparison. However, for laboratories with limited access to novel technologies, the classical molecular biology techniques like PCR-RFLP continue to be a useful tool for BoLA-DRB3.2 genotyping, because of its affordability and, relatively easy to perform. The novel BOLA-DRB3 alleles described in this study were designated by PCR-RFLP patterns.
Statistical analyses
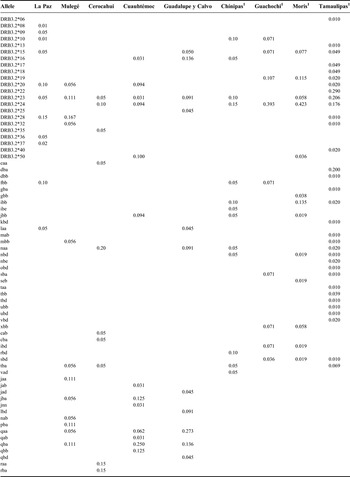
In order to have a wider view of the genetic diversity among creole populations of northwestern Mexico, allele frequencies of three populations of Chihuahua state (Chínipas, Guachochi and Moris) and one from Tamaulipas state, previously reported by Fernández et al. (Reference Fernández, Ríos Ramírez, Gayosso Vázquez, Ulloa-Arvizu and Alonso Morales2008), were included (Table 1).
Allele frequencies of locus DBR3.2 in creole cattle populations from Chihuahua (Cuauhtémoc, Cerocahui, Guadalupe y Calvo, Moris, Chínipas and Guachochi), Baja California Sur (Mulegé and La Paz) and Tamaulipas, Mexico.

New alleles found in this study are in bold.
1 Allele frequencies reported by Fernández et al. (Reference Fernández, Ríos Ramírez, Gayosso Vázquez, Ulloa-Arvizu and Alonso Morales2008).
Calculation of the allele frequencies, observed heterozygosities (Ho) and unbiased expected heterozygosities (He) were carried out using the GENEPOP v.4.0.10 program (Raymond and Rousset, Reference Raymond and Rousset1995). The amount of inbreeding within population (F IS), was estimated according to Weir and Cockerham (Reference Weir and Cockerham1984), measuring the heterozygote deficit/excess. The exact test for population differentiation according to Raymond and Rousset (Reference Raymond and Rousset1995) was applied. Statistical significance was measured by the Markov Chains method (Guo and Thompson, Reference Guo and Thompson1992). A first approach to within-breed diversity was ascertained by calculating the mean number of alleles, observed and unbiased expected estimates of heterozygosity per population (Nei, Reference Nei1973), and their standard deviations. Allelic richness (Rt) was estimated as a measure of the number of alleles independent of sample size, hence allowing comparisons among different sample sizes. Computations were carried out using FSTAT v. 2.9.3.2 (Goudet, Reference Goudet2001). After defining groups of breeds by geographic region (Baja California Sur, Chihuahua and Tamaulipas) and by location of origin, a hierarchical analysis of variance was carried out, which allowed the partitioning of the total genetic variance into components owing to interindividual and interbreed differences. Variance components were used to compute fixation index. The interpretation of population structure by F-statistics was tested using a non-parametric permutation approach as described by Excoffier, Smouse and Quattro (Reference Excoffier, Smouse and Quattro1992). Computations were carried out using an Analysis of Molecular Variance (AMOVA) procedure (Excoffier, Laval and Schneider, Reference Excoffier, Laval and Schneider2005). Genetic divergence among breeds was estimated through a commonly used genetic distance measure; Reynolds genetic distances (Reynolds, Weir and Cockerham, Reference Reynolds, Weir and Cockerham1983). A NeighborNet (Huson and Bryant, Reference Huson and Bryant2006) was constructed from Reynolds genetic distances to graphically represent the relationships between breeds, as well as, to depict evidence of admixture.
Results
Thirty nine alleles were identified in the creoles from Chihuahua and Baja California Sur. The alleles and allelic frequencies are shown in Table 1. The creoles from Chihuahua and Baja California Sur presented 14 previously unreported alleles. For creoles from Cuauhtémoc the cutting patterns detected were: jab, jnn, qab y qbb. In Cerocahui four alleles were detected: cab, cba, rda and rba. In Guadalupe y Calvo three alleles were detected: jad, lbd and qbd. In Mulegé population three alleles were detected: jaa, nab and pba. The restriction digestion patterns more frequently were: qaa (0.27), qba (0.25), naa (0.20), jaa (0.1) and fbb (0.111) for Guadalupe y Calvo, Cuauhtémoc, Cerocahui, Mulegé and La Paz, respectively. Allele DRB3.2*28 was detected only in Baja California Sur populations with high frequency (>0.15). Allele DRB3.2*23 was detected in all populations analyzed. In Mulegé population this allele showed high frequency (0.111). Alleles DRB3.2*16, DRB3.2*24 and DRB3.2*50 were only detected in creoles from Chihuahua.
Genetic diversity and genetic differentiation
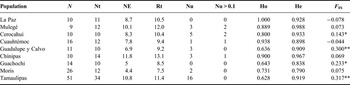
The DBR3 gene shows high genetic diversity He > 0.89 in all populations studied. Mulegé population had the highest genetic diversity (He = 0.988 and Rt = 12) and the lowest value was observed in Cuauhtémoc population (He = 0.898; Table 2). Guadalupe y Calvo population show an excess of homozygotes and registered a value of F IS = 0.3. Only this population did not show Hardy–Weinberg equilibrium (P < 0.01). F-statistics and AMOVA assessed the population structure of Baja California Sur and Chihuahua, having two and six populations each (Table 3). These results suggest that the apparent levels of breed differentiation was moderate, with F SC values indicating that approximately 6.8 percent of the total genetic variation corresponded to differences between populations (P < 0.0001), while the remaining 93.2 percent corresponded to differences among individuals. Among Baja California Sur and Chihuahua populations did not differ significantly F CT = 0.025 (P = 0.14). In metapopulation level (nine subpopulations), a high value of F IT = 0.173 (P < 0.0001) was detected. The F IS index had average value of 0.09 (P < 0.0001) in all the populations analyzed (Table 3).
Number of individuals per population (N) and genetic diversity statistics in nine Mexican creole cattle populations from Chihuahua, Baja California Sur and Tamaulipas, Mexico.

Nt, number of alleles; NE, effective number of alleles; Rt, allelic richness per population based on minimum sample size of nine diploid individuals; Nu, new alleles and with frequency >0.1 (Nu > 0.1); Ho, observed heterozygosity; He, expected heterozygosity; F IS, within-population inbreeding coefficient. *(P < 0.05); **(P < 0.01); Hardy–Weinberg disequilibrium deviations estimated.
Partitioning of genetic variability among the different sources of variation with breeds grouped by States from Chihuahua and Baja California Sur, Mexico.

The following States were defined as creoles from Baja California (La Paz and Mulegé) and from Chihuahua (Cerocahui, Guadalupe y Calvo, Cuauhtémoc, Chínipas, Guachochi and Moris).
Genetic distances
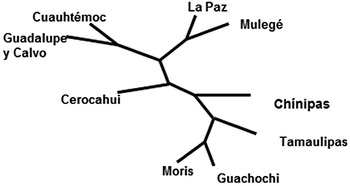
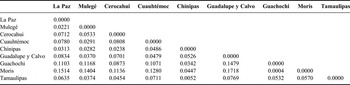
The Reynolds genetic distances among the different populations, studied (Table 4) ranged from 0.022 for La Paz/Mulegé pair to 0.083 for La Paz/Guadalupe y Calvo (P < 0.05). When these were compared with the populations reported by Fernández et al. (Reference Fernández, Ríos Ramírez, Gayosso Vázquez, Ulloa-Arvizu and Alonso Morales2008), Moris population shows the largest genetic distances (0.11–0.17). Chínipas population appears with shorter genetic distances (0.023–0.052). In Figure 2 it is shown a dendrogram where Mulegé and La Paz (Baja California Sur) populations are located in the same branch. While creoles from Cuauhtémoc and Guadalupe y Calvo (Chihuahua) formed a population group near to creoles from Baja California Sur. A second group was formed by the creoles from Moris and Guachochi (Chihuahua). Among them and not grouped are the creoles from Cerocahui and Chínipas (Chihuahua). While creoles from Tamaulipas are located between Chihuahua populations.
Dendrogram showing nine populations of creole cattle from Chihuahua, Baja California Sur and Tamaulipas, Mexico.

Pair wise population Reynolds genetic distances values among nine creole cattle populations from Chihuahua (Cuauhtémoc, Cerocahui, Guadalupe y Calvo, Moris, Chínipas and Guachochi), Baja California Sur (Mulegé and La Paz), and Tamaulipas, Mexico 1 .

1 P < 0.05.
Discussion
Our results indicate that the creoles from Baja California Sur and Chihuahua showed high polymorphism at the locus DRB3.2, given the high number of observed alleles, which is consistent with the other described populations of creole cattle (Giovambattista et al., Reference Giovambattista, Golijow, Dulont and Lojo1996, Reference Giovambattista, Takesima, Ripoli, Matsumoto, Franco, Saito, Onuma and Aida2013; Postiglioni et al., Reference Postiglioni, Rincón, Kelly, Llambi, Fernández, D'Angelo, Gagliardi, Trujillo, de Bethencourt, Guevara, Castellano and Arruga2002; Kelly et al., Reference Kelly, Nicolini, D́Angelo, Nimo, Rincón, Piaggio and Postiglioni2003; Ripoli et al., Reference Ripoli, Lirón, De Luca, Rojas, Dulout and Giovambattista2004; Martínez et al., Reference Martínez, Toro, Montoya, Burbano, Tobón, Gallego and Ariza2005). Allele DRB3.2*23 was observed in all populations of creoles analyzed in this study (La Paz, Mulegé, Cerocahui, Cuauhtémoc and Guadalupe y Calvo) as well as in creole populations reported by Fernández et al. (Reference Fernández, Ríos Ramírez, Gayosso Vázquez, Ulloa-Arvizu and Alonso Morales2008). This means that 90 percent of populations from Baja California Sur, Chihuahua and Tamaulipas share the DRB3.2*23 allele. While allele DRB3.2*24 was only detected in Cerocahui and Cuauhtémoc. This means that altogether 67 percent of the nine populations studied share DRB3.2*24 allele. Likewise, DRB3.2*23 and DRB3.2*24 alleles were observed in creoles from Argentina and Colombia (Giovambattista et al., Reference Giovambattista, Golijow, Dulont and Lojo1996; Martínez et al., Reference Martínez, Toro, Montoya, Burbano, Tobón, Gallego and Ariza2005; Baltian et al., Reference Baltian, Ripoli, Sanfilippo, Takeshima, Aida and Giovambattista2012). Creole cattle have the special ability of surviving in extreme climates and resisting to diseases. The phenotype of the Mexican Creole cattle shows a small frame animal that allows them to adapt to harsh environments allowing them to survive with limited pasture and water. Moreover, Mexican creole cattle constitutes the only type of livestock production system in some of the most marginalized and isolated rural communities of Mexico as a source of milk, meat and as a draft and load animals for agricultural purposes (Ríos Ramírez et al., Reference Ríos Ramírez, Rodríguez Almeida, Espinoza Villavicencio and Fierro1998). For example, Martínez et al. (Reference Martínez, Machado, Nascimento, Silva, Teodoro, Furlong, Prata, Campos, Guimarāes, Azevedo, Pires and Verneque2006) associated the DRB3.2*23 allele with a reduction in the number of ticks on cattle F2 (Gyr x Holstein). In fact, a positive association of DRB3.2*23 allele with resistance to mastitis in Holstein cows was found (Yoshida et al., Reference Yoshida, Mukoyama, Furuta, Holmes, Kosugiyama and Tomogane2008; Baltian et al., Reference Baltian, Ripoli, Sanfilippo, Takeshima, Aida and Giovambattista2012). Meanwhile, Dietz et al. (Reference Dietz, Cohen, Timms and Kehrli1997) associated the DRB3.2*24 allele with the neutrophil count and increased serum IgG2 in Holstein cattle. While the Norwegian Red race DRB3.2*24 allele contributed to mastitis resistance (Kulberg et al., Reference Kulberg, Heringstad, Guttersrud and Olsaker2007). The high frequency detected in the DRB3.2*23 and DRB3.2*24 alleles from multiple breeds, suggest a favourable effect conferring resistance to certain diseases. Creole cattle from Guadalupe y Calvo, Cuauhtémoc, Cerocahui, Mulegé and La Paz, showed a high frequency in the following alleles: qaa, qba, naa, jaa and fbb, respectively. These high frequencies may be the combination of a founder effect, bottleneck and natural selection. However, selection for advantageous mutations cannot explain the unusually high degree of polymorphism and is rather attributable to an overdominant selection (Hughes and Nei, Reference Hughes and Nei1989). This study detected a high value on the number of effective alleles in the populations studied. Creoles from Mulegé showed 12 total alleles, with a high affective value of 10.1, while creoles from Tamaulipas had the highest number of total alleles and only 10.8 effective alleles. Guachochi population did not observe unique alleles, while Cerocahui population observed the largest number of them. This suggests that creoles from Cerocahui possess the highest genetic diversity. Sixteen unique alleles were detected with frequencies <0.1 in creoles from Tamaulipas, while frequencies ≥0.1 were found in creoles from Mulegé, Cuauhtémoc, Chínipas and Cerocahui. These results show the high degree of genetic diversity in populations of creoles from Baja California Sur and Chihuahua, followed by creoles from Tamaulipas. The level of inbreeding determined by AMOVA was high (F IT = 0.17), which is overestimated, since it is due to Wahlund effect when the population subdivision is not considered. However, the average inbreeding estimated by subpopulations was F IS = 0.09. Indeed two populations had an excess of homozygotes which indicates that the effective population size is small, suggesting bottlenecks and geographic isolation. In addition, two populations showed deficiency homozygotes (Cuauhtémoc and La Paz). In fact, in La Paz homozygous animals were found. In this study a large number (64–100 percent) of heterozygous animals were observed. Dendrogram results are in agreement with the geographic location of some of the populations studied. Creoles from Mulegé and La Paz (Baja California Sur) are located in a separate node; these isolated populations are geographically located between the Pacific Ocean and the Gulf of California, while creoles from Chínipas and Cerocahui (Chihuahua) are located on separate nodes. These animals are located in deep canyons of the Western Mountain Range where roads are inaccessible. This independence suggested little gene flow, while populations of Cuauhtémoc and Guadalupe y Calvo, Moris and Guachochi suggest more genetic exchange. In fact, these populations are geographically located in areas with roads more accessible to communication, which probably influenced the exchange of sires and females. Creoles from Tamaulipas are located on a separate node among Chihuahua populations.
Conclusions
Creole cattle from Baja California Sur and Chihuahua in Mexico showed high genetic diversity. Fourteen new haplotypes were detected, of which some had relatively high frequencies that could be the result of the combination of a founder and multiple bottleneck effect and natural selection. Populations from Baja California and Chihuahua were located in different branches in dendrogram; which coincides with the geographic location of the populations studied. Inbreeding was detected in two cattle populations, suggesting the need for appropriate measures to be taken to avoid its negative effects. The results presented in this study may be used to promotion and to assist all stakeholders in the implementation of conservation measures and breeding programs adjusted to the specific characteristics of each cattle population.
Acknowledgements
The authors are grateful to all members of the Laboratorio de Genética Molecular, Facultad de Medicina Veterinaria y Zootecnia, Universidad Nacional Autónoma de México for their assistance and help.
Declaration of interest
The authors declare that there is no conflict of interests.