I. INTRODUCTION
As the economy has developed in the past decades, the demand for electrical conductor materials has been significantly increasing. Reference Engler, Laptyeva and Wang1,Reference Pan, Mirza, Liu and Chen2 The 8xxx aluminum conductor alloys offer significant advantages, such as low density, high electrical conductivity (EC) to weight ratio, and low cost over copper conductors. These materials are progressively replacing the copper conductor alloy in overhead transmission and electrical distribution within buildings. Reference Engler, Laptyeva and Wang1,Reference Mcqueen, Chia and Starke3 For a wider application of aluminum conductors, it is necessary to satisfy the overall requirements of materials properties in the electrical industry, notably the EC, tensile strength, and creep resistance. Reference Pan, Mirza, Liu and Chen2,Reference Mamala and Sciezor4 Consequently, considerable efforts have been devoted to develop aluminum conductor alloys with higher comprehensive properties. Reference Mamala and Sciezor4,Reference Murashkin, Sabirov, Sauvage and Valiev5
Adding minor alloying elements in 8xxx aluminum conductor alloys, such as Cu and Mg, is often considered an efficient and economical way to obtain better comprehensive properties. Reference Mamala and Sciezor4–Reference Marquis, Seidman and Dunand6 Alloying of a commercially pure aluminum alloy may create solid solutions or individual phases that greatly improve the tensile strength due to solid solution strengthening and precipitation strengthening. Reference Ryen, Nijs, Sjolander, Holmedal, Ekstrom and Nes7,Reference Karnesky, Meng and Dunand8 However, the EC may decrease because of the enhanced scattering of free electrons at solute atoms and precipitates. Reference Ashby, Shercliff and Cebon9 For electrical applications, it is a challenge to find a favorable combination of high EC with enhanced mechanical properties in the design and development of alloys.
In addition, creep resistance is one of the most important properties required in aluminum conductor alloys. Reference Pan, Mirza, Liu and Chen2 Previous investigations have demonstrated that the creep properties of aluminum alloys can be significantly affected by alloying elements. Reference Marquis, Seidman and Dunand6,Reference Chaudhury and Mohamed10–Reference Kato15 In general, alloying in pure aluminum increases the creep resistance by decreasing grain boundary mobility, impeding dislocation movement, and accelerating dislocation multiplication. Reference Chaudhury and Mohamed10,Reference Du, Qi, Krajewski and Bower11,Reference Sauvage, Enikeev, Valiev, Nasedkina and Murashkin13 Several researchers have investigated the effect of Cu addition on creep properties in aluminum alloys; however, the results appear to be somewhat inconsistent. Chaudhury et al. Reference Chaudhury and Mohamed10 reported that an Al–2 wt% Cu alloy exhibited higher creep property compared with pure aluminum due to the segregation of Cu atoms to moving dislocations. Reynolds et al. Reference Reynolds, Lenel and Ansell14 investigated the creep behavior of Al alloys containing Cu (0.64–1.72 wt%) and found that the addition of Cu had a negligible effect on the creep properties. Kato Reference Kato15 studied the sliding in bicrystals of Al–Cu solid solutions and noted that small Cu addition decreases the creep property. Conversely, several studies suggested that Mg addition in aluminum could enhance the creep property at relatively high temperatures (>0.5 T m, where T m is the absolute melting point of the alloy). Reference Marquis, Seidman and Dunand6,Reference Du, Qi, Krajewski and Bower11 For instance, Du et al. Reference Du, Qi, Krajewski and Bower11 reported that Mg atoms could increase the creep property by increasing the sliding threshold of grain boundaries by forming immobile Mg–Al clusters. Marquis et al. Reference Marquis, Seidman and Dunand6 reported that Mg addition could strengthen the creep property of Al–2 wt% Mg–0.2 wt% Sc alloy at 300 °C by increasing the threshold stress. To the best of the author’s knowledge, few investigations have been conducted on the effect of Cu and Mg on the creep properties of aluminum conductor alloys at relatively low temperatures (≤0.4 T m), which are the normal service temperature range for most aluminum conductor alloys.
In the present study, 8xxx aluminum alloys with three Fe levels were alloyed with different but small amounts of Cu and Mg. The evolution of EC and tensile strength as a function of Cu, Mg, and Fe contents was explored and quantitatively analyzed. The effect of Cu and Mg on the creep properties at 100 °C was systematically investigated.
II. EXPERIMENTAL
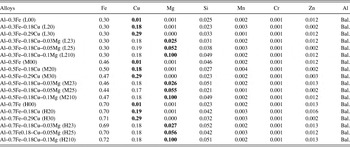
The materials used in the experiments were 8xxx aluminum alloys with three fixed Fe levels (Al–0.3Fe, Al–0.5Fe, and Al–0.7Fe base alloys) alloyed with various Cu and Mg concentrations. Because of a remarkable decrease of EC by solute atoms in aluminum alloys, only small amounts of Cu and Mg were added in the present work to keep a favorable combination of high mechanical strength with reasonable EC. The additions of 0.18% and 0.29% Cu were made to Al–0.3Fe, Al–0.5Fe, and Al–0.7Fe base alloys, and further addition of 0.025%, 0.05%, and 0.1% Mg were made to Al–0.3Fe–0.18Cu, Al–0.5Fe–0.18Cu, and Al–0.7Fe–0.18Cu alloys, respectively. A total of 18 alloys with various Cu, Mg, and Fe contents were batched in an electrical resistance furnace and cast in the form of round billets with 4 inch diameters by a direct chill (DC) cast unit. Their chemical compositions are shown in Table I. All the rod samples with 9.5 mm in diameter, which are equivalent to the industrial 9.5 mm supply rods for drawn wire, were produced by hot extrusion from the DC cast billets.
Chemical compositions of the experimental alloys (wt%).

The EC measurements were directly conducted on 200 mm long samples of a 9.5 mm wire using a Megger DLRO10HD resistance ohmmeter (Megger, Dallas, Texas). Tensile testing was carried out on cylindrical specimens (9.5 mm in diameter and 250 mm in length) according to the ASTM B557 standard at room temperature. The compression creep tests were performed at 100 °C for 100 h under a constant load of 69 MPa using cylindrical specimens (9.5 mm in diameter and 19 mm in length). To confirm the reliability of the results, three tests were repeated for each condition.
For microstructure examination, the extruded rods were first cut to 20 mm in length, and then sectioned longitudinally along the centerline. All of the samples were polished and etched with Keller’s solution for 10 s and were later observed using an optical microscope (OM), scanning electron microscope (SEM), and electron backscattered diffraction (EBSD) technique. The automated EBSD maps were conducted on the deformed structure with a 0.2 µm step size using HKL Channel 5 software for substructure analysis. The linear intercept method was used to measure the subgrain size of alloys with different alloying contents. Reference Shi, Mao and Chen16 To ensure statistical reliability, more than 200 subgrains were measured in each sample.
III. RESULTS AND DISCUSSION
A. Microstructure evolution
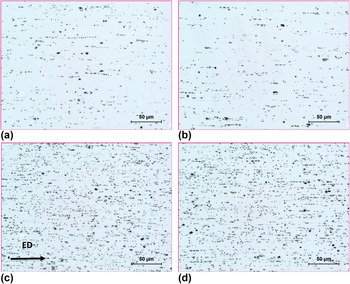
Figure 1 shows optical micrographs of some typical alloys with different compositions after extrusion. Due to a very low solubility of Fe in the aluminum matrix, almost all of the Fe precipitated out in the form of Fe-containing intermetallic particles in the cast microstructure. After hot extrusion, the Fe-containing intermetallic particles were broken down to a number of fine intermetallic dispersion particles. For all of the alloys, the fine intermetallic particles, which were confirmed as AlmFe in our previous work, Reference Pan, Liu, Breton and Chen17 were uniformly distributed along the extrusion direction in the aluminum matrix. By increasing Fe from 0.3 to 0.7% in the three base alloys, the volume fraction of Fe-containing intermetallic particles increased from 1.8% in Al–0.3Fe to 3.2% in Al–0.5Fe and further to 4.4% in Al–0.7Fe alloys. The sizes of the Fe-containing intermetallic particles were very similar for all the alloys studied, with an average size of 0.38 µm. When adding Cu and Mg in the three base alloys, the volume fraction of intermetallic particles was found to remain almost unchanged compared to the corresponding base alloys, which are shown in Figs. 1(a) and 1(b) for the addition of 0.29% Cu and in Figs. 1(c) and 1(d) for the combined addition of 0.18% Cu and 0.1% Mg. This result can be attributed to the higher solid solubility of Cu and Mg in aluminum, which is approximately 0.4% and 1.7% at room temperature, respectively. Reference Spittel and Spittel18 Therefore, all of the additions of Cu up to 0.29% and Mg up to 0.1% in this study are expected to remain in the solid solution after extrusion.
Optical micrographs showing the particles distribution of the alloys: (a) Al–0.3Fe, (b) Al–0.3Fe–0.29Cu, (c) Al–0.7Fe, and (d) Al–0.7Fe–0.18Cu–0.1Mg, showing fine Fe-containing intermetallic particles distributed along the extrusion direction (ED).

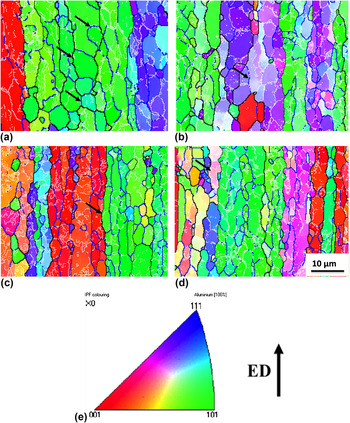
To understand the microstructure evolution with the additions of Cu and Mg in 8xxx aluminum alloys, EBSD orientation maps of the same typical alloy samples as in Fig. 1 were examined, and the results are shown in Fig. 2. It can be observed that all of the extruded alloys showed a characteristic recovered structure, in which a large amount of low-angle boundaries with misorientation angles between of 1 and 5° were observed. In addition, the substructures were organized, and large well-defined subgrains (arrowed in Fig. 2) were formed along the elongated grains with neatly arranged boundaries of 1–15°.
Orientation image mapping showing the extruded microstructure of the alloys: (a) Al–0.3Fe, (b) Al–0.3Fe–0.29Cu, (c) Al–0.7Fe, (d) Al–0.7Fe–0.18Cu–0.1Mg, and (e) inversed pole figure coloring and ED. Boundary misorientation indicated as follows: white lines 1–5°, blue lines: 5–15°, thin black lines: 15–30°, and thick black lines >30°.

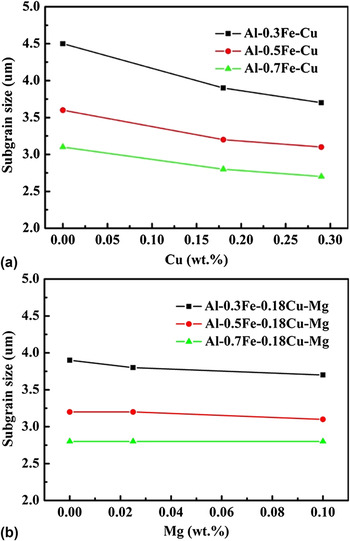
Though the recovered structure is present in all experimental alloys, there are differences in the subgrain size due to the additions of Cu and Mg (Fig. 3). It was observed that by increasing the Cu content to 0.29%, the average subgrain size slightly decreased from 4.5 to 3.8 µm in Al–0.3Fe–Cu, from 3.7 to 3.3 µm in Al–0.5Fe–Cu, and from 3.2 to 2.7 µm in Al–0.7Fe–Cu [Fig. 3(a)], respectively. However, the addition of Mg (0.025–0.1%) in all three base alloys showed a negligible change in subgrain size. As shown in Fig. 3(b), with increasing Mg content, the subgrain size kept almost constant in the three corresponding base alloys. This can be attributed to the various diffusion behaviors of Cu and Mg. Firstly, Cu solutes in aluminum solution have a lower diffusion rate than Al self-diffusion, which would strongly hinder the dislocation movement at the subgrain boundaries and enhance dislocation multiplication, leading to the retardation of the dynamic recovery. Reference Neumann and Tuijn19,Reference Shakiba, Parson and Chen20 However, the diffusion rate of Mg is very close to the Al self-diffusion rate, resulting in little effect on the dynamic recovery. As a result, the subgrain size decreased with increasing Cu level, while the Mg addition exhibited no change in subgrain size.
The evolution of subgrain size with an increase of (a) Cu and (b) Mg contents.

B. EC and tensile strength
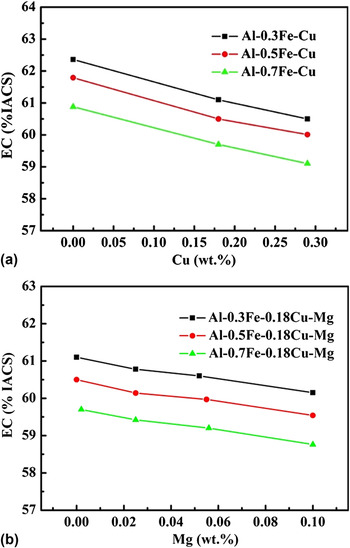
Figure 4 shows the evolution of the EC with different amounts of Cu and Mg. It can be observed that EC slightly decreases with increasing Cu and Mg due to enhanced scattering of free electrons on Cu and Mg solutes in aluminum. Reference Ashby, Shercliff and Cebon9 With increasing Cu content from 0 to 2.9%, EC decreased from 62.4% to 60.5% IACS in Al–0.3Fe alloys and from 60.9% to 59.1% IACS in Al–0.7Fe alloys [Fig. 4(a)]. With increasing Mg content from 0% to 0.1%, EC decreases from 61.1% to 60.2% IACS in Al–0.3Fe–0.18Cu alloys and from 59.7% to 58.8% IACS in Al–0.7Fe–0.18Cu alloys [Fig. 4(b)].
Influence of alloying elements on electrical conductivity: (a) Cu and (b) Mg.

In the present work, Matthiessen’s law was adapted to establish the relationship of the EC with chemical composition as follows: Reference Raeisinia, Poole and Lloyd21
 $${1 \over {{\rm{EC}}}} = {\rho _{\rm{b}}} + \sum\limits_i {{\rho _i}{C_i} + {\rho _{\rm{P}}}{f_{\rm{P}}}} \quad ,$$
where EC is the EC; ρb is the resistivity of the base alloy;
 $\sum\limits_i {{\rho _i}{C_i}}$
is the sum of the resistivity contributions from the various solutes, i.e., ρ
i
is the resistivity parameter and C
i
is the concentration of the i
th solute; ρp is the resistivity parameter of the particles; and f
p is the particle volume fraction. In the present study, due to a very low solubility of Fe in aluminum, it can be assumed that almost all of the Fe precipitated out into Fe-containing intermetallic particles and the amount of Fe solutes is negligible. The volume fraction of Fe-containing intermetallic particles [f
p in Eq. (1)] has a linear relation with Fe concentration (C
Fe).
Reference Spittel and Spittel18
Hence, the particle contribution ρp
f
p in Eq. (1) can be substituted by
 ${\rho '_{{\rm{Fe}}}}{C_{{\rm{Fe}}}}$
, in which
 ${\rho '_{{\rm{Fe}}}}$
is treated as the resistance parameter of the Fe alloying element. As all of the alloys had a similar particle size, consequently, Eq. (1) in the present work can be transformed to
 $${1 \over {{\rm{EC}}}} = {\rho _{\rm{b}}} + {\rho _{{\rm{Cu}}}}{C_{{\rm{Cu}}}} + {\rho _{{\rm{Mg}}}}{C_{{\rm{Mg}}}} + {\rho '_{{\rm{Fe}}}}{C_{{\rm{Fe}}}}\quad ,$$
where EC is in the units of % IACS; ρCu, ρMg, and
 ${\rho '_{{\rm{Fe}}}}$
are the resistivity parameters of Cu, Mg, and Fe alloying elements; and C
Cu, C
Mg, and C
Fe are the concentrations in wt%. Based on the results from Fig. 4, the values of all resistivity parameters (ρ) can be obtained using the multiple linear regression. Therefore, an empirical expression can be obtained to predict the EC as a function of alloying element content,
 $${1 \over {EC}} = 0.01575 + 0.00174{C_{{\rm{Cu}}}} + 0.00289{C_{{\rm{Mg}}}} + 0.00096{C_{{\rm{Fe}}}}\quad .$$
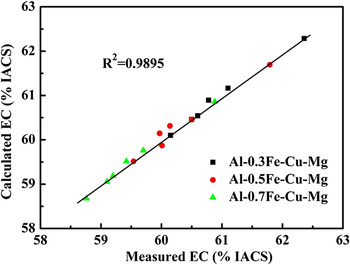
The calculated values of the EC versus the measured values with different Cu and Mg contents in three base alloys are plotted in Fig. 5. As demonstrated, there is excellent agreement between the calculated and experimental results. Furthermore, to evaluate the accuracy of Eq. (3), the error between the calculated EC(C) and the measured EC(M) can be expressed as follows:
 $${\rm{Error}}\% = \left| {{{{\rm{EC}}\left( C \right) - {\rm{EC}}\left( M \right)} \over {{\rm{EC}}\left( M \right)}}} \right|100\quad .$$
Correlation between calculated and experimentally measured EC.

The mean error for the 8xxx alloys with Cu contents ranging from 0% to 0.29% and Mg contents ranging from 0% to 0.1% was determined to be 0.13%, confirming the excellent agreement between the calculated and measured ECs. Therefore, Eq. (3) offers a very useful tool to predict the EC as a function of alloying element (Cu, Mg, and Fe) in 8xxx aluminum alloys.
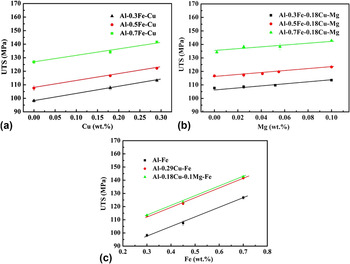
The ultimate tensile strength (UTS) of the alloys was evaluated with different compositions, and the results are shown in Fig. 6. It was found that the UTS showed a nearly linear relationship with Cu, Mg, and Fe contents and the values moderately increased with increasing Cu and Mg concentrations due to the multi-strengthening mechanisms, such as solid solution strengthening, substructure strengthening, and the interaction between solution atoms. Reference Ryen, Nijs, Sjolander, Holmedal, Ekstrom and Nes7 The results reveal a beneficial effect of Cu and Mg on the mechanical properties. The overall strength σ (UTS) of the alloys can be expressed by an empirical equation in the form Reference Marquis, Seidman and Dunand6,Reference Karnesky, Meng and Dunand8
 $$\sigma ({\rm{UTS}}) = {\sigma _{\rm{b}}} + {H_{{\rm{Cu}}}}{C_{{\rm{Cu}}}} + {H_{{\rm{Mg}}}}{C_{{\rm{Mg}}}} + {H_{{\rm{Fe}}}}{C_{{\rm{Fe}}}}\quad ,$$
where σb is the strength of the base alloy in the units of MPa; H Cu, H Mg, and H Fe are the strengthening parameters of Cu, Mg and Fe; and C Cu, C Mg, and C Fe are the concentrations in wt%. By using the multiple linear regression method, the values of σb and strengthening parameters (H) can be determined from the results of Fig. 6. Next, the following equation can be used to describe the UTS as a function of alloying element content:
 $${\rm{UTS}} = 75.6 + 51.1{C_{{\rm{Cu}}}} + 66.7{C_{{\rm{Mg}}}} + 71.0{C_{{\rm{Fe}}}}\quad .$$
Influence of individual alloying elements on UTS: (a) Cu, (b) Mg, and (c) Fe with a linear relationship.

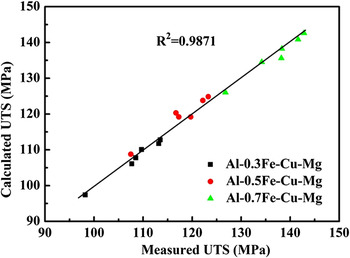
The calculated values of the UTS versus the measured values for 8xxx alloys with various Cu, Mg, and Fe contents in different base alloys are plotted in Fig. 7, which demonstrates a good agreement between the calculated and experimentally measured results. The mean error between the calculated and measured values for the 8xxx alloys was determined to be 1.0%, which confirms the accuracy of Eq. (6). Therefore, the obtained equation could be used to predict the UTS with various Cu, Mg, and Fe additions in 8xxx aluminum alloys.
Correlation between calculated and experimentally measured UTS.

In brief, the changes of properties (EC, UTS, etc.) are greatly related to the microstructure resulted from the various Fe, Cu, and Mg contents. As shown in Fig. 1, the volume fraction of Fe-containing intermetallic particles increases with increasing Fe contents, which is the principle reason for the decrease of EC and the increase of UTS. The substructure derived from the addition of Cu and Mg (Fig. 2) also induces the change of UTS. In addition, Cu and Mg in the solid solution make a remarkable contribution to increase UTS and decrease EC.
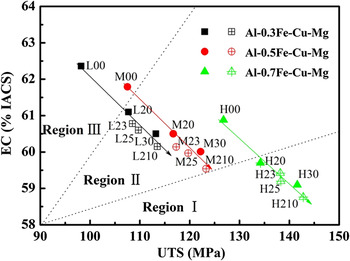
For aluminum conductor alloys, high EC with enhanced UTS is most desirable in 8xxx aluminum alloys. However, high EC and high UTS are usually contradictory because of the metallurgical nature of both properties. In an attempt to have a tool for alloy development and design, the EC and UTS profile of the alloys with different Cu and Mg additions in Al–0.3Fe, Al–0.5Fe, and Al–0.7Fe base alloys is plotted in Fig. 8. This figure can be divided into three regions with different combinations of EC and UTS. It is evident that there is always a trade-off between EC and UTS. Region I has high UTS but low EC while region III has high EC but low UTS. Region II in the middle has balanced EC and UTS. In the present study, both 0.3Fe (L00) and 0.5Fe (M00) alloys have higher EC but lower UTS (region III) compared to the 0.7Fe (H00) alloy (region II). With the additions of Cu and Mg (see black and red arrows), the 0.3Fe and 0.5Fe alloys move to the region II with more balanced EC and UTS. For example, the 0.5Fe alloys with Cu and Mg additions could have enhanced values of UTS at the expense of EC. It is also evident that the 0.7 alloys with Cu and Mg additions tend to move from the region II to the region I, which have higher UTS but relatively lower EC. By adjusting Fe, Cu, and Mg alloying elements, different combinations of EC and UTS could be obtained to fulfill various design requirements for specific applications.
EC and UTS profile of the alloys with different Cu and Mg additions. Arrows show the increasing Cu and Mg additions to their corresponding regions.

C. Effects of Cu and Mg on creep properties
Figure 9(a) shows typical creep curves of samples of Al–0.3Fe alloys with different Cu contents as an example. During compressive creep deformation, the creep strain rapidly increases and the instant creep rate,
 $\dot \varepsilon$
, decreases with increasing time, which can be defined as the primary creep stage. The primary stage ends when
 ${\rm{d}}\dot \varepsilon /{\rm{d}}t \approx 0$
. Subsequently, the creep deformation turns to a quasi-steady state, in which the creep rate,
 $\dot \varepsilon$
, becomes more and less constant, which can be defined as the second stage. The primary creep strain, εp, in the primary stage and the minimum creep rate,
 ${\dot \varepsilon _{\rm{m}}}$
, in the second stage are used here to characterize the creep properties during creep deformation. The primary creep strain, εp, is obtained by extrapolating the second creep curve linearly back to the zero time [Fig. 9(a), dotted line] according to the literature,
Reference Wei, Zu and Zhou22
while the minimum creep rate,
 ${\dot \varepsilon _{\rm{m}}}$
, is calculated as the average creep rate in the second stage [Fig. 9(b)].
Typical compressive creep curves of Al–0.3Fe alloys with different Cu contents, tested at 100 °C and applied load of 69 MPa: (a) creep strain (ε) and (b) instantaneous creep rate (
 $\dot \varepsilon$
).

Results of Fig. 9(a) show that the total creep strain greatly decreases due to the addition of Cu in 0.3Fe alloys, which decreases from 6.9% in Al–0.3Fe base alloys to 2.4% in Al–0.3Fe–0.29Cu alloys, indicating a general beneficial effect of the Cu addition on the creep properties. However, the minimum creep rate is almost unchanged with increasing Cu content [Fig. 9(b)], showing a mixed effect of the Cu addition on the creep properties. To clearly reveal the Cu effect, the primary creep stain, εp, and the minimum creep rate,
 ${\dot \varepsilon _{\rm{m}}}$
, in all three alloys (Al–0.3Fe, Al–0.5Fe, and Al–0.7Fe) have been calculated and the results are shown in Fig. 10. It can be observed that εp is significantly decreased with increasing Cu content at a given Fe level [Fig. 10(a)]. For instance, with increasing Cu content from 0% to 0.29%, εp decreases from 3.82% to 0.43% in Al–0.3Fe alloys (89% reduction), from 1.25% to 0.22% in Al–0.5Fe alloys (82% reduction), and from 0.71% to 0.15% in Al–0.7Fe alloys (79% reduction), respectively. On the other hand, the addition of Cu has almost no influence on
 ${\dot \varepsilon _{\rm{m}}}$
in all studied Fe contents [Fig. 10(b)]. For example, the
 ${\dot \varepsilon _{\rm{m}}}$
keeps almost constant at 8.1 × 10⁻⁸ s−1 with 0.3Fe alloys and 5.5 × 10⁻⁹ s−1 with 0.7Fe alloys, independent from the increase of Cu from 0% to 0.29%. It is evident that minor Cu addition shows a beneficial effect to the creep properties mainly in controlling the creep deformation in the primary stage. However, it has a negligible effect on the minimum creep rate in the second creep stage.
Evolution of the primary creep strain (εp) (a) and minimum creep rate (
 ${\dot \varepsilon _{\rm{m}}}$
) (b) as a function of Cu content.

It is worth mentioning that the benefit of Cu in the primary creep stage is decreased with increasing Fe content in the base alloys [Fig. 10(a)], which can be attributed to the increasing fine Fe-rich dispersoids and small subgrains acting as strong barriers to the dislocation movements during creep deformation from higher Fe content alloys. Reference Shakiba, Parson and Chen20 Therefore, it is suggested that Cu addition would be more effective in increasing the creep property in low Fe content alloys.
To illustrate the influence of Mg addition, the typical creep curves of samples of Al–0.3Fe–0.18Cu alloys with different amounts of Mg are shown in Fig. 11. Both the total creep strain and minimum creep rate considerably decreased with increasing Mg content. The evolution of the primary creep stain εp and the minimum creep rate
 ${\dot \varepsilon _{\rm{m}}}$
as a function of Mg content in three alloys (Al–0.3Fe–0.18Cu, Al–0.5Fe–0.18Cu, and Al–0.7Fe–0.18Cu) is shown in Fig. 12. Similar to the Cu addition, the primary creep strain εp was greatly reduced with the additions of Mg [Fig. 12(a)]. For example, with Mg increasing from 0% to 0.1%, the εp greatly decreases from 1.37% to 0.09% in Al–0.3Fe–0.18Cu alloys (93% reduction), from 0.43% to 0.07% in Al–0.5Fe–0.18Cu alloys (84% reduction), and from 0.25% to 0.05% in Al–0.7Fe–0.18Cu alloys (80% reduction), respectively. However, in contrast to the Cu addition,
 ${\dot \varepsilon _{\rm{m}}}$
was significantly reduced with Mg addition at all studied Fe contents. As shown in Fig. 12(b), with Mg increasing from 0% to 0.1%,
 ${\dot \varepsilon _{\rm{m}}}$
noticeably decreased from 7.5 × 10⁻⁸ s−1 to 4.8 × 10⁻¹⁰ s−1 in Al–0.3Fe–0.18Cu alloys (99% reduction), from 1.8 × 10⁻⁸ s−1 to 2.8 × 10⁻¹⁰ s−1 in Al–0.5Fe–0.18Cu alloys (98% reduction), and further from 5.6 × 10⁻⁹ s−1 to 2.1 × 10⁻¹⁰ s−1 in Al–0.7Fe–0.18Cu alloys (96% reduction), respectively. It can clearly be observed that minor Mg addition can greatly decrease both εp and
 ${\dot \varepsilon _{\rm{m}}}$
and therefore has a great potential to enhance the creep properties, both in the primary stage and secondary stage of the creep deformation.
Typical compressive creep curves of Al–0.3Fe–0.18Cu alloys with different Mg contents, tested at 100 °C and applied load of 69 MPa: (a) creep strain (ε) and (b) instantaneous creep rate (
 $\dot \varepsilon$
).

Evolution of the primary creep strain (εp) (a) and minimum creep rate (
 ${\dot \varepsilon _{\rm{m}}}$
) (b) as a function of Mg content.

In the base alloys free of Cu and Mg, the creep properties are only dependent on the amount of Fe-rich intermetallic dispersion particles, which is in return controlled by Fe content in the alloys (Fig. 1). This is because only the Fe-containing intermetallic dispersion particles can act as barriers to dislocation movement during creep deformation in the base alloys. Higher Fe content and more Fe-containing intermetallic dispersion particles lead to better creep properties (Figs. 10 and 12). With additions of minor Cu and Mg as solute atoms in the aluminum matrix, the creep properties (both εp and
 ${\dot \varepsilon _{\rm{m}}}$
) are significantly changed. For example, with additions of 0.29% Cu [Fig. 10(a)] or of 0.1% Mg [Fig. 12(a)] in Al–0.3Fe alloys, εp remarkably decreased and approached the same value as the Al–0.7% Fe alloys. However, Cu and Mg influence the creep properties differently. Cu has a benefit principally on the primary stage (Figs. 9 and 10), while Mg can have positive impacts on both the primary and second stages of the creep deformation (Figs. 11 and 12). The different contributions of Cu and Mg on creep properties can be derived from the various behaviors of Cu and Mg. Firstly, work hardening is the principle controlling mechanism on the primary stage of creep deformation,
Reference Nabarro23
which is largely related to the solid solution levels that increase the work hardening ability of the material.
Reference Shakiba, Parson and Chen20
Therefore, the primary creep strain was greatly reduced with increasing amounts of Cu and Mg solutes. In addition, the subgrain size decreases with Cu addition (Fig. 3), which can retard the dislocation movement then further decrease the primary creep strain.
Secondly, the second stage of creep deformation is controlled by the glide and climb of dislocations in all studied alloys. Reference Westerlund24 Hence, the creep properties can be influenced by the factors that can have an effect on the dislocation movements. It is reported that the interaction between dislocations and Cu solute atmosphere is low, Reference Mohamed25,Reference Halliday and Beevers26 which is the likely reason for the negligible change in the minimum creep rate from Cu. On the other hand, the interaction of Mg with dislocations is stronger than Cu due to the higher atomic misfit with the aluminum matrix, Reference Spittel and Spittel18,Reference Babicheva, Dmitriev, Zhang, Kok, Srikanth, Liu and Zhou27 resulting in a possible increase in creep resistance in the second stage. Moreover, there is a strong tendency for Mg to form clusters with other elements Reference Ryen, Nijs, Sjolander, Holmedal, Ekstrom and Nes7,Reference Ovid’ko, Sheinerman and Valiev28 due to its much higher diffusivity (1.4 × 10⁻²² m2/s versus 6.3 × 10⁻²⁴ m2/s of Cu at 100 °C Reference Neumann and Tuijn19,Reference Shakiba, Parson and Chen20 ), which could lower the stacking fault energy, provide greater obstacles to dislocation glide, and make intersections more difficult, leading to the further decrease of the minimum creep rate. Reference Lumley, Morton and Polmear12,Reference Sauvage, Enikeev, Valiev, Nasedkina and Murashkin13,Reference Mahmoud, Georgy, Mansy and Kamel29,Reference Liu, Pan, Zhang, Liang, Gao, Zheng and Li30 The formation of Mg clusters has been confirmed by using 3D atom probe tomography techniques, Reference Lumley, Morton and Polmear12,Reference Sauvage, Enikeev, Valiev, Nasedkina and Murashkin13 resulting in a significant increase in the strength and a decrease in the minimum creep rate of aluminum alloys.
The creep is a relatively slow but a time-dependent continuous deformation process. In the aspect of the creep resistance of materials, the improvement in the primary stage of the creep deformation (reducing the primary creep stain, εp) is mainly related to the short-term creep resistance. The decrease of the minimum creep rate,
 ${\dot \varepsilon _{\rm{m}}}$
, in the second stage of the creep deformation has a major contribution to the long-term creep resistance. As shown in Figs. 9 and 10, the minor Cu addition can only reduce εp but has a negligible effect on
 ${\dot \varepsilon _{\rm{m}}}$
; hence, the beneficial effect of Cu in 8xxx alloys is limited to the short-term creep resistance. On the other hand, the minor Mg addition is highly effective in increasing both short-term and long-term creep resistances by simultaneously reducing εp and
 ${\dot \varepsilon _{\rm{m}}}$
. Therefore, minor alloying with Mg is more promising than Cu in terms of the small quantity required to enhance the creep resistance in 8xxx conductor alloys effectively while minimizing the impact on the EC.
IV. CONCLUSIONS
-
(1) The addition of Cu promotes the retardation of the dynamic recovery, leading to a finer subgrain size. However, little change on the microstructure has been observed with the addition of Mg.
-
(2) Additions of Cu and Mg reasonably increase the UTS but slightly decrease EC. The effects of Cu, Mg, and Fe on the UTS and EC were quantitatively evaluated, providing a useful tool to predict the mechanical strength and EC in 8xxx aluminum conductor alloys. With established UTS and EC profiles as a function of alloying elements (Cu, Mg, and Fe), different combinations of UTS and EC could be obtained to fulfill various design requirements for specific applications.
-
(3) The minor addition of Cu remarkably decreases the primary creep stain but shows a negligible effect on the minimum creep rate, leading to a beneficial effect on the short-term creep resistance but no advantage to the creep resistance under the long-term creep process.
-
(4) The minor addition of Mg greatly reduces both the primary creep strain and minimum creep rate, resulting in a significant and effective improvement on the creep resistance of 8xxx aluminum conductor alloys.
ACKNOWLEDGMENTS
The authors would like to acknowledge financial support from Natural Science and Engineering Research Council of Canada (NSERC) and Rio Tinto through the NSERC Industrial Research Chair in Metallurgy of Aluminum Transformation at the University of Quebec at Chicoutimi.