


1. Introduction
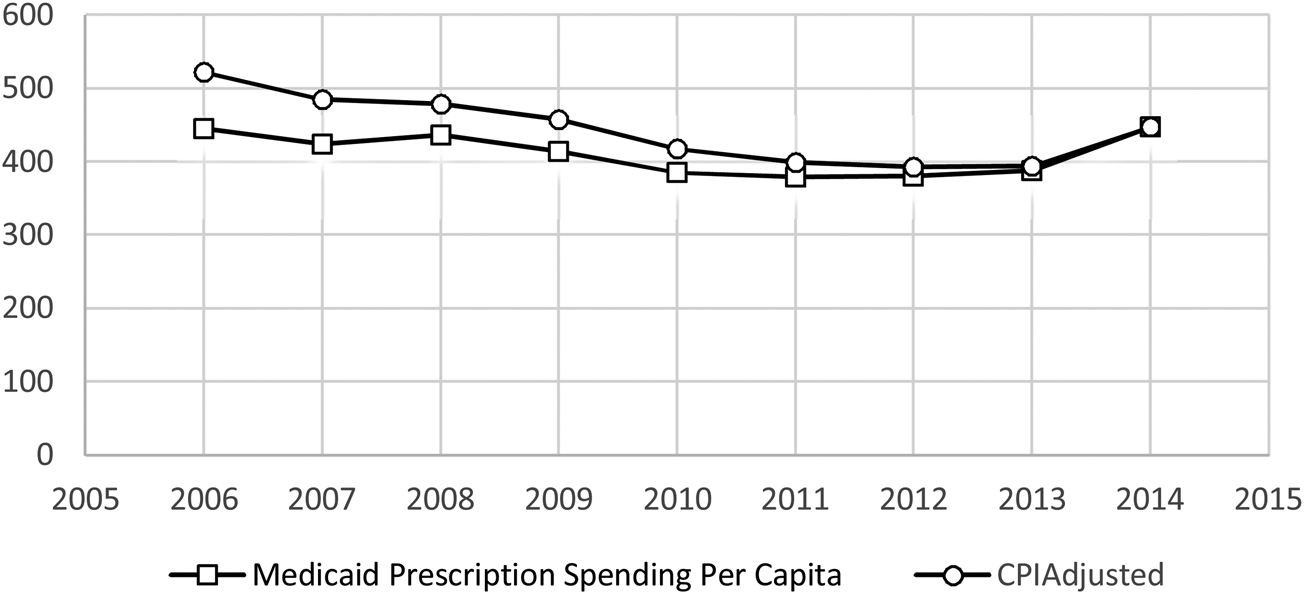
In the contemporary realm of health care policy, Medicaid prescription drug spending represents an extraordinary economic burden on the federal and state governments. Spending on Medicaid prescription drugs dramatically increased to $43 billion in 2014, up from $29.3 billion in 2005. In 2014, the increase in Medicaid prescription spending (24.3%) surpassed overall prescription drug spending (12.2%) and all other health expenditures (4.6%) (Martin et al., Reference Martin, Hartman, Benson and Catlin2015). However, this shift in Medicaid prescription drug costs demonstrates a relatively recent phenomenon. As indicated in Figure 1, trends in state Medicaid prescription spending per capita are not linear, decreasing from 2006 to 2011 but increasing from 2012 to 2014 [Medicaid and CHIP Payment and Access Commission (MACPAC), 2016].
Trends in state Medicaid prescription spending ($) per beneficiary 2006–2014.

This sporadic growth in Medicaid prescription drug spending prompted a variety of cost-containment strategies from state governments, most notably negotiated pricing and price transparency. Other prescription management programs, including preferred drug lists and script limits, have proved less effective in this regard, and most have reached a point of maturity with almost no changes in the number of states utilizing such programs over the past decade [Kaiser Family Foundation (KFF), 2018a]. The negotiated pricing strategy refers to state negotiation with pharmaceutical manufacturers for additional rebates toward prescription costs, possibly contributing to reductions in the amount of spending. The Patient Protection and Affordable Care Act (ACA) of 2010 extended state rebate programs to prescription drugs through Medicaid managed care, establishing the Managed Care Organization (MCO) rebate program. Before the ACA, state rebates were provided on prescription drugs only through fee-for-service settings. The other main strategy, price transparency, addresses information asymmetry between states and manufacturers. Within the price transparency strategy, state operation of All Payer Claims Databases (APCDs) offers access for policymakers to payment data and comparable price information. These two strategies have the potential to contain skyrocketing health care costs by allowing states to negotiate with pharmaceutical companies for lower costs or to obtain comparable information about prescription price differences inside and across states for more competitive markets.
However, few researchers have empirically examined whether the negotiated pricing or price transparency strategy contributes to limiting health care spending. In particular, little scholarly research observes the newly adopted MCO rebate program under the ACA, as well as other related rebate programs. Recent studies reveal the effects of the ACA on coverage gains and reductions in uninsured rates among low-income populations (e.g. Selden et al., Reference Selden, Lipton and Decker2017; Blavin et al., Reference Blavin, Karpman, Kenney and Sommers2018; KFF, 2018b) and improved access to health care services and utilization of services (e.g. Soni et al., Reference Soni, Simon, Cawley and Sabik2018; Winkelman and Chang Reference Winkelman and Chang2018). In addition, relevant scholarly discussions generally focus not on state Medicaid prescription spending, but on the impacts of price transparency on consumer choice of high-value care (e.g. Hibbard et al., Reference Hibbard, Greene, Sofaer, Firminger and Hirsh2012; Rosenthal et al., Reference Rosenthal, Lu and Cram2013) or consumer spending (e.g. Sinaiko and Rosenthal, Reference Sinaiko and Rosenthal2011; Desai et al., Reference Desai, Hatfield, Hicks, Chernew and Mehrotra2016). As an exploratory study of the relationship between various state cost-containment strategies and the size of Medicaid prescription spending, the purpose of this research is to analyze whether the cost of Medicaid prescriptions is associated with the negotiated pricing and price transparency strategies.
This study delves into central issues related to state health policy, with both economic and legal ramifications. The most obvious is the influence of the newly adopted rebates for MCOs, provided for under the ACA, on Medicaid prescription spending. This research analyzes whether state decisions for carving prescription drugs into their Medicaid managed care benefits is related to constraining the cost of Medicaid prescriptions. Furthermore, we compare the negotiated pricing strategy, including single-, multi-state, and MCO rebates, to the price transparency strategy, specifically considering the state operation of APCDs. Such a systematic approach has not previously been applied to investigate the effect of these policy interventions on levels of state prescription spending over time. The next section introduces the state cost-containment strategies for Medicaid prescription spending and explains how the strategies impact varied state expenditures. Several other factors affecting levels of Medicaid prescription spending are then explored in methodology, followed by the results of our analysis. Finally, we offer a discussion of implications and future research.
2. Background
Traditional strategies to reduce the prices of Medicaid prescription drug purchases include price controls and negotiated pricing (National Conference of State Legislatures, 2011; Blumenthal and Squires, Reference Blumenthal and Squires2016). The federal government relies on the former strategy for required rebates or discounts and operates the Medicaid rebate program, which was created by Congress in 1990 ‘to ensure that Medicaid receives a net price that is consistent with the lowest or best price for which manufacturers sold the drug’ (MACPAC, 2016: 1). Under the ACA, the federal Medicaid drug rebates extended to Medicaid prescription drugs through Medicaid managed care plans as well as fee-for-service settings. In addition, changes were made to the rates of rebates on innovator drugs from 15.1% to 23.1% of the average manufacturer price (AMP) per unit, and on generic drugs from 11% to 13% of the AMP unit. The federal rebate program distributes to states ‘the same federal rebate amount for each unit of a particular drug regardless of how much it pays the pharmacy’ (1). Thus, in the investigation of influences on varied state Medicaid prescription spending, this research does not consider the federal rebate program as a factor.
2.1 Negotiated pricing
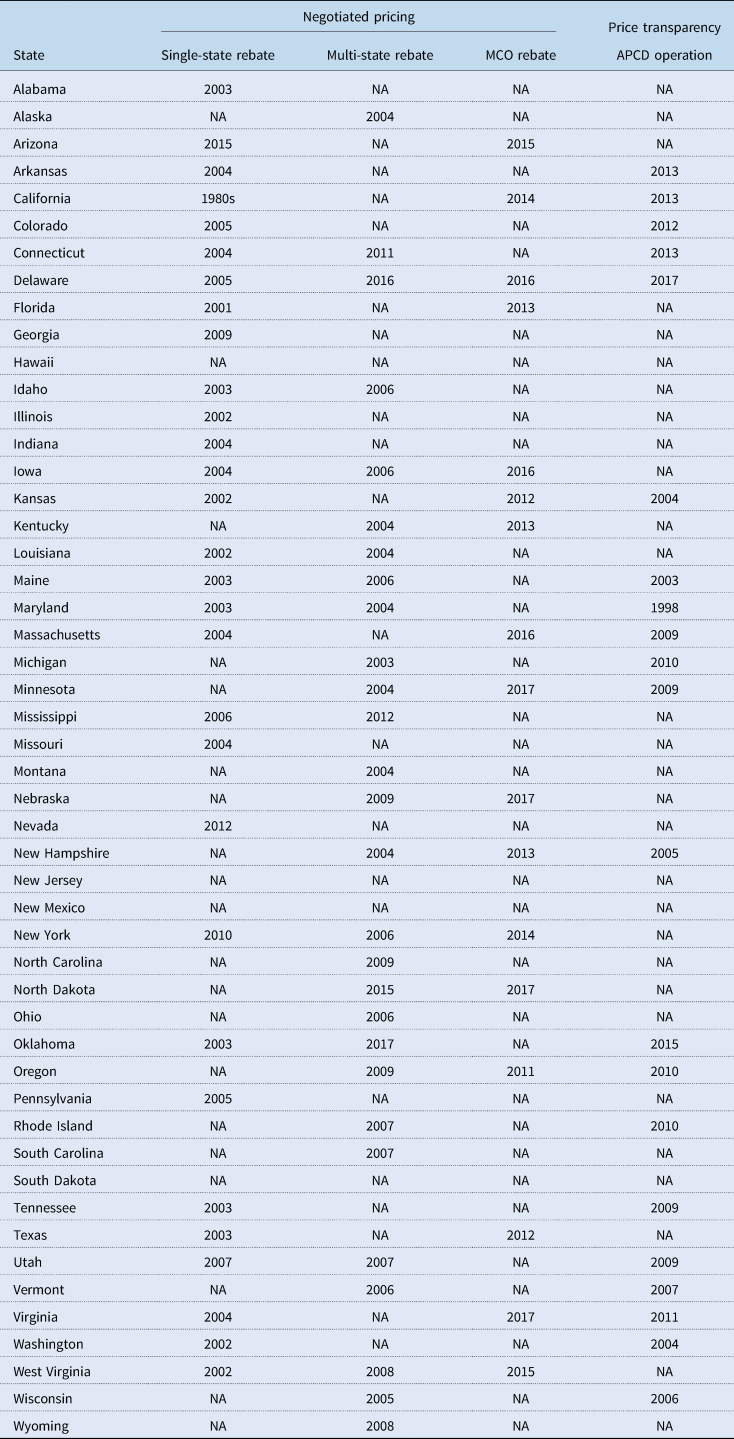
In conjunction with the federal rebates, states can negotiate with pharmaceutical companies for more expansive discounts under single- or multi-state pharmacy Supplemental Rebate Agreements, commonly called state rebate programs. The Center for Medicare and Medicaid Services (CMS) approves state plan amendments for single- or multi-state rebate programs. The amount of state supplemental rebates is as large as the federal rebates (Medicaid.gov, 2017a). Indicated in Table 1, as of 2017, 30 states have single-state programs and 28 states have multi-state programs (Medicaid.gov, 2017b). The states of Indiana, Iowa, Georgia, New York, Vermont, and Washington, which operate rebate programs, reported considerable Medicaid prescription drug savings using 1-year data (National Conference of State Legislatures, 2011). However, research is limited that examines whether the state rebates contribute to lasting cost containment of Medicaid prescriptions over time.
State administration of strategies to address Medicaid prescription spending (effective year)

Source: (1) For state rebate programs, Medicaid.gov. State prescription drug resources. 2017 Available from https://www.medicaid.gov/medicaid/prescription-drugs/state-prescription-drug-resources/index.html (2) For the APCD operation, APCD Council. Interactive state report map. 2017 Available from http://www.apcdcouncil.org/state/map.
After the enactment of the ACA in 2010, the state rebate programs extended to prescription drugs provided not only through fee-for-service Medicaid but also through managed care. This means that, when opted in, states can negotiate with drug manufacturers for supplemental rebates on all Medicaid prescription drugs purchased by managed care plans for their Medicaid beneficiaries in addition to the federal rebates (KFF, 2015). As of 2017, 17 states decided to add pharmacy benefits into their managed care plans to collect supplemental MCO rebates, while other states have opted out of prescription benefits from the managed care benefit packages (MACPAC, 2011, 2016; Medicaid.gov, 2017b). This newly created MCO rebate has the potential to address Medicaid prescription spending growth because more Medicaid beneficiaries are provided health care services through managed care. An MCO provides health care services while controlling the utilization and related costs of those services, increasing the coverage of Medicaid beneficiaries from 64.1% in 2007 to 77% in 2014 (KFF, 2017). States can realize an increased benefit from the rebates when they decide to cover prescription benefits for their Medicaid managed care enrollees, thus possibly slowing the Medicaid prescription spending growth. When states carve prescription drugs into Medicaid managed care, they can gain from the MCO rebates provided by pharmaceutical companies. Therefore, it is important to investigate whether the MCO rebate contributes to constraining Medicaid prescription spending over time.
2.2 Price transparency: all-payer claims databases
State health policymakers may enhance price transparency by operating APCDs and by publishing price information obtained from the databases. The idea of price transparency is to address information asymmetry between health care consumers and providers. For decades, health care service consumers in the U.S. had difficulty in identifying low-cost and high-quality health care providers due to a lack of data (Sinaiko and Rosenthal, Reference Sinaiko and Rosenthal2011; Rosenthal et al., Reference Rosenthal, Lu and Cram2013; Feldstein, Reference Feldstein2015). With price transparency, consumers can compare health care prices and avoid high-price and low-quality providers. Meanwhile, providers are incentivized not to suggest wide price variations unrelated to quality. This is because in ‘reasonably competitive provider markets, purchasers and health plans should be able to use price information to pressure providers to lower their prices or to improve the efficacy of tiered networks or other similar efforts’ (Sinaiko and Rosenthal, Reference Sinaiko and Rosenthal2011: 893).
APCDs are state initiatives to improve price transparency and contain health care spending. The databases collect payment data, including Medicaid prescription spending, and provide state policymakers with comparable price information (APCD Council, 2015). As such, the APCDs can supply state officials with more bargaining power toward manufacturers. As of July 2017, 16 states possessed operational APCDs, and the five states of Delaware, Florida, Hawaii, New York, and West Virginia have recently enacted legislation to establish the databases and to begin implementation (APCD Council, 2017a). The states of Kansas, Maryland, and Maine have collected data for over 10 years, conducting effective data collection and analysis (APCD Council, 2015).
The focus of this research is the negotiated pricing and price transparency strategies. Much existing research has observed state variations in aspects of administering Medicaid. This is because the program provides significant discretionary authority to state officials over the implementation of state Medicaid, resulting in differing eligibility rules and benefits (Cantor et al., Reference Cantor, Thompson and Farnham2013; Jacobs and Callaghan, Reference Jacobs and Callaghan2013; Sparer and Thompson, Reference Sparer, Thompson, Knickman and Kovner2015). According to the literature, state choices in the implementation of federal programs can influence desired policy outputs and outcomes (e.g. Pressman and Wildavsky, Reference Pressman and Wildavsky1984; Goggin et al., Reference Goggin, Bowman, Lester and O'Toole1990; Noh and Krane, Reference Noh and Krane2016). Thus, the choices for state rebate programs and APCDs may impact levels of Medicaid prescription spending. This research analyzes whether the cost of Medicaid prescriptions is associated with the negotiated pricing strategy, as indicated by state rebate programs, or with the price transparency strategy, as indicated by state operation of the APCDs. This research hypothesizes that the negotiated pricing and price transparency strategies contributed to addressing Medicaid prescription spending in states during the period of 2006 to 2014.
3. Methods
To assess the influence of the negotiated pricing and price transparency strategies on levels of state Medicaid prescription spending, we utilized a fixed-effects panel after conducting a Hausman test. Additionally, multiple estimation strategies were adopted to see the robustness of the results: Arellano-Bond estimation and Two-Stage Least Squares (2SLS). First, a dynamic panel data model with Arellano-Bond Estimation was applied for data in the period between 2006 and 2014. This method allows researchers to account for autocorrelation and possible endogeneity (see Arellano and Bond, Reference Arellano and Bond1991). Second, Two-Stage Least Squares (2SLS) regression analysis was employed to address endogeneity in the relationship between state health policy interventions and levels of Medicaid prescription spending.Footnote 1 Our models used robust standard errors to resolve heterogeneity problems. The basic model has the following form:

In this model, MPit is Medicaid prescription spending per capita for state i in year t. Negit is a set of negotiated pricing measures for state i in year t. Trait is a measure of price transparency for state i in year t. Stateit is a set of state political and socioeconomic factors for state i in year t. MPit −1 is a one-year lagged Medicaid prescription spending, and αi is the unobserved time-invariant effect. uit is the error term. This research model comprises data from all 50 U.S. states during the research period of 2006 to 2014 (9 years × 50 states, N = 450).
3.1 Data for state medicaid prescription spending
For the dependent variable, this research utilized a log-transformed per enrollee spending on Medicaid prescription drugs and other non-durable medical products to measure varying levels of Medicaid prescription drug spending in U.S. states from 2006 to 2014. The dependent variable is created by dividing total Medicaid prescription drug and other non-durable spending by Medicaid enrollees in states, capturing levels of a Medicaid enrollee's spending on prescribed drugs, non-prescription drugs, and medical sundries (CMS, 2018). We adjusted this dependent variable according to the Consumer Price Indexes by the Bureau of Labor Statistics. This dependent variable allows the researchers to evaluate how various cost-containment strategies affect levels of Medicaid prescription spending. The timeline of 2006 to 2014 permits the researchers to control for the influence of Medicare on levels of Medicaid prescription spending. Starting in 2006, the Medicare D program replaced Medicaid prescription spending for Medicare beneficiaries. Moreover, this timeline provides for the examination of how the newly established rebates to Medicaid MCOs under the ACA, beginning in 2010, impact Medicaid prescription spending.
3.2 Data for explanatory variables
State variation in the negotiated pricing strategy is indicated by three dummy variables: single-, multi-state, and MCO rebates. For single-state rebates, a state with the rebate program is coded 1, otherwise 0. For multi-state rebates, a state with the rebate program is coded 1, otherwise 0. For the MCO rebates, a state that includes supplemental rebate collections for MCO utilization is coded 1, otherwise 0. For the three dummy variables, data from the Centers for Medicare and Medicaid Services were utilized.
The APCDs can be created and operated by state legislation or by voluntary efforts of insurance companies and health care providers, collecting data on pharmacy, medical, dental, and related claims from Medicaid, Medicare, commercial payers, and other providers (APCD Council, 2017a). Even though there are variations in the scopes of data collected across states, all states with APCDs, whether having been initiated by legal or voluntary efforts, have collected pharmacy data between 2006 and 2014. Hence, this research includes all states with APCDs regardless of their creation methods. For state operation of APCDs, a state with an operating APCD created by state legislation or voluntary efforts is coded 1, otherwise 0.
3.3 Data for control variables
To control for confounding variables associated with the dependent variable, this research considered state political and socioeconomic contexts in the models, including Democrat governor, divided government, the size of Medicaid enrollees, and prior Medicaid prescription spending per capita. As Medicaid is administered by states and funded by both federal and state governments, a state's share of Medicaid spending can be affected by state political and socioeconomic factors (Miller, Reference Miller2005; Nicholson-Crotty, Reference Nicholson-Crotty2015).
To account for state political context, this study considers political configuration. Political configuration is indicated by Democrat governor and divided government, both of which can be associated with levels of state spending on Medicaid (Barrilleaux, Reference Barrilleaux1999; Bernick, Reference Bernick2016; Jordan and Bowling, Reference Jordan and Bowling2016; Nicholson-Crotty, Reference Nicholson-Crotty2015). For Democrat governor, states with governors of Democratic political party affiliation are coded 1, otherwise 0. For divided government, a state with a split between the party affiliation of the governor and the state legislature majority is coded 1, otherwise 0. Data for the two variables uses state and local legislative partisan composition from the National Conference of State Legislatures.
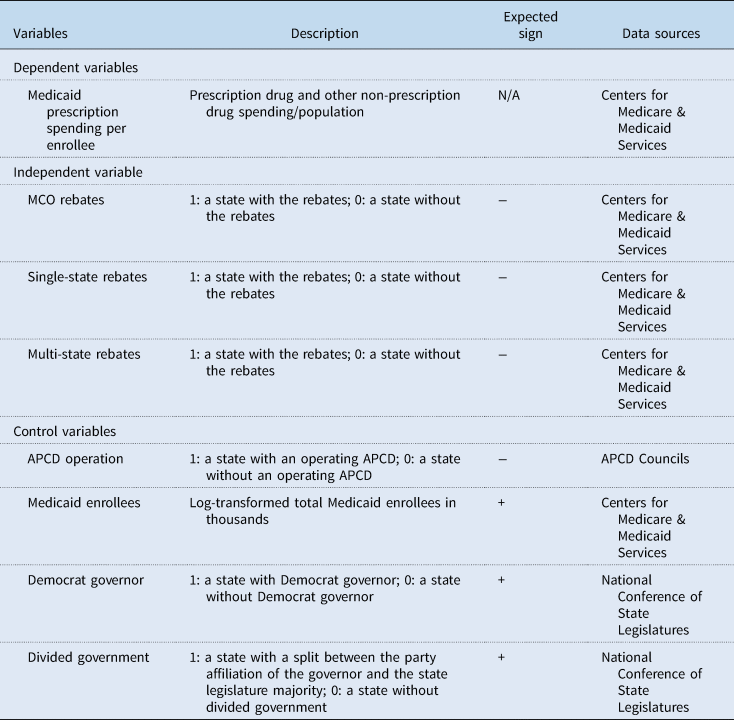
To control for state socioeconomic context, this research considers the size of state Medicaid enrollees and levels of prior spending. State Medicaid prescription spending reflects the number of Medicaid enrollees and the average spending per person (MACPAC, 2016). States with greater enrollment would likely experience more upward pressures on Medicaid prescription spending (Cantor et al., Reference Cantor, Thompson and Farnham2013). In addition, to capture prior spending per enrollees, we included log-transformed prior Medicaid prescription spending. We also controlled for the time effect to obtain how trends influence the hypothesized relationships (Table 2).
Variables, measures, and expected signs

Note: The financial variables are considered constant dollars using Consumer Price Indexes by the Bureau of Labors.
4. Findings
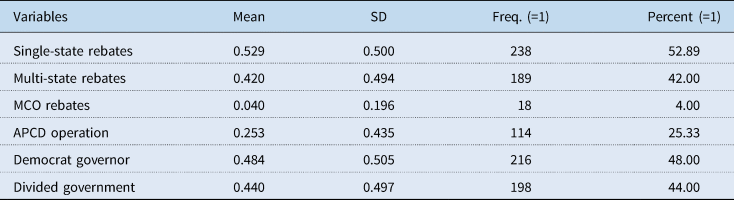
State strategies to address Medicaid prescription spending include participating in single-, multi-state, or MCO rebate programs and/or operating APCDs for price transparency. Tables 3 and 4 show the descriptive results of the Medicaid prescription spending models. The average of per capita Medicaid prescription spending is 438.006. The maximum spending is 1023 while the minimum spending is 146.565.
Descriptive analysis results of the continuous variables

Descriptive analysis results of the binary variables

N = 450.
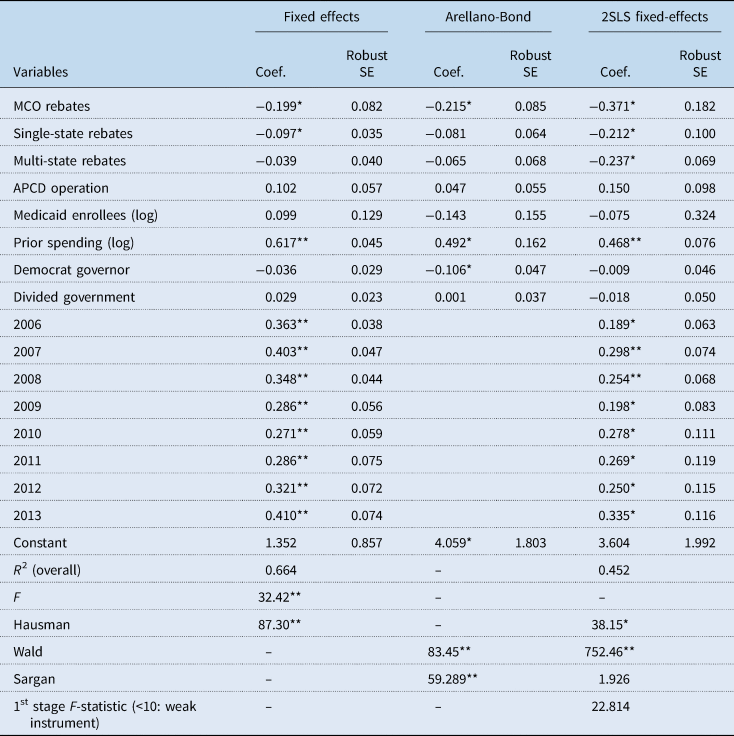
This research hypothesized that the negotiated pricing strategy would be associated with a smaller amount of state Medicaid prescription spending.Footnote 2 Among the indicators for the rebate programs, the MCO rebate decreased Medicaid prescription spending (−0.199; p < 0.05) in Model 1 and was consistently significant in the Arellano-Bond and 2SLS models. The effects of single- and multi-state programs were not consistently significant across the models. Thus, among the three rebate programs, the MCO rebate program was effective in addressing the increase of state Medicaid prescription spending while the single- and multi-state rebate programs were not.
Regarding the influence of the price transparency strategy on the dependent variable, referring to state operation of APCDs, we hypothesized that states operating the databases would spend less on Medicaid prescriptions. The effect of the databases on state spending for Medicaid prescriptions was not significant, with a positive sign, in the models. The findings did not provide evidence that states operating the databases for price transparency spent less on their Medicaid prescriptions for 2006 to 2014 (Table 5).
Factors affecting state variation in Medicaid prescription spending in 50 states

**p < 0.01, *p < 0.05.
This research hypothesized the influences of state political and socioeconomic contexts on Medicaid prescription spending. The findings provide evidence that state political context, as measured by Democrat governor and divided government, is not statistically associated with the expenditure of state Medicaid prescriptions. However, the analysis shows that prior spending has a significantly positive impact on state Medicaid prescription spending in the models, suggesting that, in accordance with incrementalism, prior budgetary trends influence current budget decisions due to time and resource constraints (Lindblom, Reference Lindblom1959; Wildavsky, Reference Wildavsky1984). The time effect models show that all years have significantly positive effects on state Medicaid spending. Moreover, the size of Medicaid enrollees did not influence Medicaid prescription spending. This finding does not support the supposition that states with more enrollees will receive more interest and attention from pharmaceutical manufacturers.
5. Discussion
As Medicaid prescription spending has significantly burdened state governments, state policymakers have adopted a variety of strategies to confront this issue. This research investigated the influence of negotiated pricing and price transparency strategies for Medicaid prescription expenditures in U.S. states for 2006 to 2014. For the negotiated pricing strategy, we hypothesized that Medicaid prescription spending was associated with state decisions for opting into state rebate programs such as single-, multi-state, and MCO rebates. For the price transparency strategy, we considered state operation of APCDs as a factor for influencing prescription spending because the databases allow state policymakers to obtain comparable prescription prices across the states. This study provides evidence that Medicaid prescription spending was influenced by the negotiated pricing strategy, specifically MCO rebates, but not by the price transparency strategy. Additionally, state political and socioeconomic contexts did not contribute to reductions in Medicaid prescription spending.
This research demonstrates the role of states in mitigating levels of Medicaid prescription spending, indicating how state decisions for the newly adopted MCO rebates under the ACA influenced prescription drug costs. After the enactment of the ACA legislation, state governments could collect rebates from manufacturers on all Medicaid-covered prescription drugs regardless of fee-for-service and managed care settings. This research provides evidence that MCO rebates under the ACA have contributed to constraining the increase of Medicaid prescription spending. Responding to the MCO rebates, many states have increased the proportion of the Medicaid enrollees in managed care settings, receiving more MCO rebates and decreasing per capita Medicaid prescription spending (MACPAC, 2016). While states have covered more Medicaid enrollees through managed care organizations, over 75% in 2014 (KFF, 2017), among the 10 states with the largest Medicaid beneficiaries, just the four states of California, Florida, New York, and Texas have participated in the MCO rebate program. By opting into the MCO rebate program, state policymakers may expect to alleviate the increase of Medicaid prescription spending.
Other rebate programs, including single- and multi-state rebates, do not tend to decrease state spending on Medicaid prescription drugs. The state rebates provided very substantial relief to Medicaid prescription spending on a relatively consistent basis, influencing Medicaid fee-for-service prescription drug expenditures (MACPAC, 2011). However, our research shows that single- and multi-state rebates were not associated with Medicaid prescription spending for 2006 to 2014. This may be because many states have begun to carve Medicaid prescription benefits into their managed care plans and serve more Medicaid enrollees in managed care settings, possibly lowering state reliance on the single- and multi-state rebates for reducing Medicaid spending.
Additionally, our research did not provide evidence that state operation of APCDs was effective in addressing Medicaid prescription spending. Two possible situations may account for the deviant results from the hypothesis: (1) the role of learning from experience; and (2) data analysis and reporting. While a few states, including Kansas, Maryland, and Maine, have collected data for over 10 years, other states have been improving the databases for effective data collection and analysis (APCD Council, 2015). This implies that they may suffer from a ‘failure to learn how to do better’ (Pressman and Wildavsky, Reference Pressman and Wildavsky1984) or have ineffectively implemented the intervention due to limited resources or experiences, possibly hindering effective operation of the databases. Likewise, state variation in data release and utilization may account for the unexpected result (Hsu et al., Reference Hsu, Fung, Price, Huang, Brand, Hui, Fireman and Newhouse2008; Hibbard et al., Reference Hibbard, Greene, Sofaer, Firminger and Hirsh2012; APCD Council, 2017b). Currently, many states appear amenable to adopting the price transparency strategy. Twenty-seven states have enacted legislation to establish APCDs or have indicated interest in the program (APCD Council, 2017a). We recommend that state policymakers pay attention to data analysis and utility along with establishing effective data collection systems for improving price transparency.
The findings of our research also did not suggest evidence that state political contexts reduced Medicaid prescription spending. These results are consistent with other current study in this area that reveals a trend of policy negotiation between state legislatures and governors in divided governments, particularly on localized issues such as health care (National Conference of State Legislatures, 2018). While national partisan politics play a role in gubernatorial policy behaviors, the pressures of electoral success on a state level often direct governors toward collective policies that are agreeable to an expansive range of state voter preferences and require a need for compromise with the state legislature (Bernick, Reference Bernick2016). Although political polarization at the state level has increased over the last 20 years, the intensity of this polarization varies by state and suggests a more prominent degree of polarization among states with unified government as opposed to divided government (Jordan and Bowling, Reference Jordan and Bowling2016; Noh, Reference Noh2016).
Recent research also indicates that decreased policy expertise among state elected officials has prompted more collaboration with professionalized executive agencies, overseen by the governor, and state legislatures in policy pursuits (Boushey and McGrath, Reference Boushey and McGrath2017).What is more, the increasing decentralization of health care policy from the federal government to state governments along with partisan stalemates at the national level has provided more discretion toward states in the implementation of health policy, motivating state officials toward their own policy agendas and economic outlays (Weissert and Uttermark, Reference Weissert and Uttermark2017). Therefore, the presumed impact of political and socioeconomic divergences seems to be less influential in the localized state health care policy process.
This analysis was limited by several factors. First, this research is an exploratory study on the effects of state Medicaid cost-containment strategies of negotiated pricing and price transparency related to the size of Medicaid prescription spending. The findings, using a variety of analytic techniques, consistently indicate the significant effect of MCO rebates on the cost of Medicaid prescription drugs. However, the number of states that adopted the MCO rebate program is limited during the research period of 2006 to 2014, while seventeen states have adopted the rebate program as of 2017. Future research may want to investigate the hypothesized relations in this research using a longer period of data. Second, this research did not find the effectiveness of state operation of APCDs in constraining Medicaid prescription spending. This finding may be attributed to state variation in data analysis and reporting. However, due to limited data availability, this research could not consider the state variation here. Third, the focus of this research was on how the rebates from drug manufacturers to states influenced the extent of state Medicaid prescription spending. In the analyses, we could not consider the enrollment mix, the volume of prescription drugs, and the prices paid due to limited data availability. Fourth, the use of state-level data may not reveal micro-trends within states. Future research may want to utilize micro-level data in investigating how state health policy may influence levels of Medicaid prescription spending. Finally, difficulties in measuring various prescription cost-containment strategies limited our ability to test the strategies fully. For example, many states have adopted assorted utilization management strategies, including cost sharing, preferred drug lists, prior authorization, and dispensing limits, which did not allow for comparable measurements across states.
6. Conclusion
This study has two clear implications for state efforts toward constraining Medicaid prescription spending. Primarily, as our findings suggest that state decisions for MCO rebates under the ACA are effective in containing levels of Medicaid prescription spending, state policymakers may want to address cost increases by carving prescription benefits into managed care benefits. As more states have provided Medicaid benefits through managed care settings, there appears to be an advantage by opting into the MCO rebates. Secondly, despite apparent benefits, we did not find that the state operation of APCDs was effective in decreasing Medicaid prescription spending. Given the current trend toward improved price transparency and the enhanced bargaining power offered by APCDs, future research may want to look at how varied data analysis and utility of the databases would be associated with the cost of state Medicaid prescriptions.
Conflict of interest
The Authors declare that there is no conflict of interest.
Appendix 1
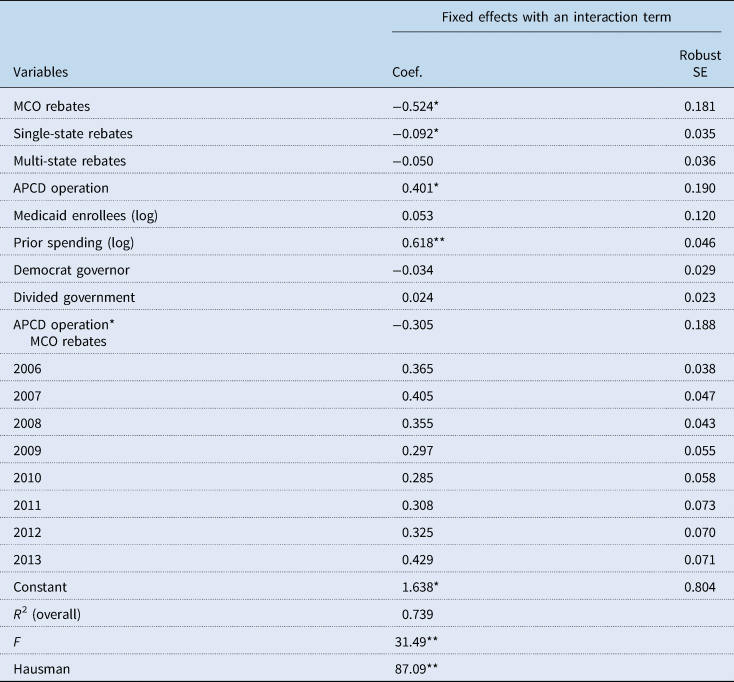
We were concerned about the policy interaction between negotiated pricing and price transparency. Appendix 1 shows the results of the fixed effects with an interaction term. We focus on MCO rebates and APCDs to see the interaction between negotiated pricing and price transparency. The results show that the interaction between negotiated pricing and price transparency is positively associated with Medicaid prescription spending, but this association is not statistically significant. The findings do not provide evidence that state negotiation with drug manufacturers is based on the price transparency offered by the APCDs for state policy decision-makers. MCO rebates and single-state rebates respectively have significantly negative effects on Medicaid prescription spending. However, we have an unexpected relationship where the APCDs have a significantly positive effect on Medicaid prescription spending. This may be because of unsolved methodological problems such as endogeneity and autocorrelation in the model.
Fixed effects with an interaction term