


Repression is a pervasive feature of politics.Footnote 1 The most violent form of repression is one that indiscriminately kills mass populations, or places them in conditions where they die of hunger, exhaustion, or disease (Harff and Gurr Reference Harff and Gurr1988; Wheatcroft Reference Wheatcroft1996). But what do perpetrators of mass repression actually achieve? According to one convention, repression’s central purpose is to deter expressions of political disloyalty (Lichbach Reference Lichbach1987). Yet, repression often does the opposite—it inflames opposition (Gurr Reference Gurr1971). What explains this inconsistency in the political legacy of mass repression?
Despite persistent scholarly interest, this question remains unresolved. There is wide consensus that selective repression—which punishes specific individuals for specific actions—can induce obedience without backlash (Lichbach Reference Lichbach1987; Kalyvas Reference Kalyvas2006; Blaydes Reference Blaydes2018). Nothing close to such consensus exists on the impact of indiscriminate mass repression.Footnote 2 Using equally plausible theories and empirical designs, past research has argued two seemingly conflicting points: Indiscriminate repression induces obedience toward the perpetrator (García-Ponce and Pasquale Reference García-Ponce and Pasquale2015; Lyall Reference Lyall2009; Young Reference Young2019; Zhukov and Talibova Reference Zhukov and Talibova2018), or repression inflames adversarial sentiments and mobilizes opposition (Balcells Reference Balcells2012; Finkel Reference Finkel2015; Kocher, Pepinsky, and Kalyvas Reference Kocher, Pepinsky and Kalyvas2011; Lupu and Peisakhin Reference Lupu and Peisakhin2017; Rozenas, Schutte, and Zhukov Reference Rozenas, Schutte and Zhukov2017).
Our study helps explain why mass repression can generate both obedience and opposition. Repression’s legacy, as we show, is contingent on the political opportunity structure in which future behavior unfolds. Having intimately learned about a regime’s resolve in using violence, populations victimized by past repression—or their descendants—will act more obediently, but only if they expect that the regime—or its successor—is willing and able to punish expressions of disloyalty. Even if past repression inflamed anti-regime sentiments, this threat of retribution can compel victimized populations to “falsify” their preferences and appear loyal in order to avoid repression (Kuran Reference Kuran1995). Conversely, if the regime becomes unable to punish acts of opposition in a consistent and predictable manner, the previously suppressed anti-regime sentiments will manifest through voting, street protests or even armed mobilization. In short, local responses to historical repression depend on the permissiveness of political conditions.
To test this argument, we study the impact of the 1932–34 famine in Soviet Ukraine, locally known as Holodomor (“killing by starvation”). Stalin’s coercive agricultural policies and collective punishment campaign deprived entire communities of food, livestock, and freedom of movement in search of survival. The ensuing famine killed over three million people and ranks among the deadliest acts of political terror in history (Applebaum Reference Applebaum2017; Snyder Reference Snyder2010). The Ukrainian state recognizes the famine as politically motivated genocide, and most Ukrainians share this assessment (Rating Group Ukraine 2017).
We assess the impact of this historical event on an unusually rich set of political outcomes. Using instrumental variables for local famine lethality and exploiting plausibly exogenous changes in Moscow’s coercive threat in Ukraine, we find heterogeneity in famine’s behavioral effects, short- and long-term. When Moscow could credibly respond to the acts of disloyalty with violence—from the later stages of World War II to the late 1980s, and again today, in the areas recently controlled by pro-Russian separatists—famine-struck communities were more hesitant to express anti-Soviet or anti-Russian views. When Moscow’s retributive threat abated—as in the early stages of WWII, or during and after the Soviet collapse—these same communities became hotbeds of opposition to Moscow.
Past research has taken a narrower empirical scope, focusing on “snapshots” of political behavior either soon or long after a spell of violence. As a result, each previous study identified an effect of repression on a specific form of political behavior, measured in a specific political context, predictably leading to diverse findings. By taking a broader view, we suggest a unifying logic to past literature. Mass repression can induce compliance, but only if the threat of resumed violence remains credible. Otherwise, it will have the opposite of its intended effect. This insight advances our understanding of historical legacies (Beissinger and Kotkin Reference Beissinger and Kotkin2014; Simpser, Slater, and Wittenberg Reference Simpser, Slater and Wittenberg2018) and why they vary (Charnysh Reference Charnysh2015; Fouka and Voth Reference Fouka and Voth2016; Wittenberg Reference Wittenberg2006), by showing that the effects of the past are dynamic and contingent on a changing contemporary context.
THE CONTINGENT LEGACY OF REPRESSION
Theoretically, the behavioral consequences of mass repression seem uncertain. Repression can signal a regime’s willingness to extract loyalty through violence (Lichbach Reference Lichbach1987). Acts of past repression create “internalized expectations about the ways in which authority will respond punitively toward challenging acts” (Beissinger Reference Beissinger2002, 326). Where repression was historically intense, citizens should expect expressions of political disloyalty to invite severe punishment from the state. However, many have argued that repression may not only fail to deter opposition, but can actually mobilize it, especially when repression victimizes many innocents (Gurr Reference Gurr1971; Kalyvas Reference Kalyvas2006; Rozenas Reference Rozenas2018).
To resolve this uncertainty, we propose to view the legacy of repression as contingent on the contemporary political context. The key feature of this context relevant to citizens’ calculus is the threat of retribution: the degree to which citizens expect to face punishment for expressing political disloyalty. High threats of retribution will create incentives for all citizens to act loyally, even if doing so contradicts their preferences (Kuran Reference Kuran1995; Wintrobe Reference Wintrobe1998). Incentives for preference falsification will be heightened in the communities previously exposed to repression, which are more cognizant of the regime’s punitive capacity and cruelty. When the threat of retribution is low, incentives for preference falsification dissipate, and the previously suppressed resentments—in part aggravated by repression—will manifest through various adversarial behaviors.
The concept of retributive threat is not the same as regime type. In democracies, the threat of retribution is generally low, but not always (Davenport Reference Davenport2007). Not all dictators, meanwhile, are equally reliant on extra-judicial killings and imprisonment of political opponents (Magaloni Reference Magaloni2008). Retributive threat is also distinct from the broader concept of state capacity, as it pertains specifically to deterrent capacity. Even states that struggle to provide public goods (e.g., Zimbabwe and Venezuela) can effectively deter dissent, by inducing a fear of reprisals by security forces or militias (Young Reference Young2019).
The threat of retribution is a component of the political opportunity structure—the broader constellation of resources and institutions that constrain or facilitate citizen mobilization (Kitschelt Reference Kitschelt1986). The political opportunity structure is “permissive” when the retributive threat is low, all else equal, and it is “restrictive” otherwise. The political opportunity structure typically changes at critical junctures such as economic crises, foreign invasions (Gleditsch and Ruggeri Reference Gleditsch and Ruggeri2010), or power shifts between hard-liners and moderates (Beissinger Reference Beissinger2002). In communities exposed to past repression, local norms of political behavior will favor compliance or opposition, depending on the permissiveness of the political opportunity structure, and particularly the intensity of retributive threats.
People who experience or observe repression directly and intimately are likely to experience its effects more strongly than those who learn about it in abstract.Footnote 3 Nonetheless, repression’s lessons can persist in the long run and shape the attitudes and behavior of people who did not witness it directly: Parents pass political attitudes to their children (Lupu and Peisakhin Reference Lupu and Peisakhin2017), schools and religious institutions educate their audiences (Wittenberg Reference Wittenberg2006), and citizens learn their community’s political norms from their neighbors and peers (Cho, Gimpel, and Dyck Reference Cho, Gimpel and Dyck2006). Over time, these interactions shape prevailing views about politics, including which behaviors might provoke retribution from the state.
TERROR BY HUNGER
We test our theory of contingent legacies of repression with evidence on Holodomor, the Soviet famine in Ukraine. Similar to famines in Ireland in 1846–51 (Ó Gráda Reference Ó Gráda2007) and China in 1959–61 (Meng, Qian, and Yared Reference Meng, Qian and Yared2015), the politics behind Holodomor have been a focus of historiographic debate. The most common interpretation is that Holodomor was “terror by hunger” (Conquest Reference Conquest1987, 224), “state aggression” (Applebaum Reference Applebaum2017) and “clearly premeditated mass murder” (Snyder Reference Snyder2010, 42). Others view it as an unintended by-product of Stalin’s economic policies (Kotkin Reference Kotkin2017; Naumenko Reference Naumenko2017), precipitated by natural factors such as adverse weather and crop infestation (Davies and Wheatcroft Reference Davies and Wheatcroft2009; Tauger Reference Tauger2001). For our purposes, the key question is not whether the Soviet government actually intended to starve millions of Ukrainians to death, but how the government responded to food shortages—intentionally or not—and how the population interpreted the government’s motives and causes of their plight.
The famine occurred after a period of radical reforms to the Soviet agrarian sector, which sought to transform private farms into large-scale government-run collectives. After voluntary collectivization failed, Moscow began forcing peasants to join collective farms and demanded that they deliver fixed quotas of grain. This agricultural system, propped up and managed through coercion, put “the country on a knife-edge, highly susceptible to drought and sudden torrential rains” (Kotkin Reference Kotkin2017, 128). Chronic administrative and technological inefficiencies, combined with disruptions to sowing and germination due to bad weather and pests, led to a 30–5 percent drop in harvest from 1930 to 1932 (Davies and Wheatcroft Reference Davies and Wheatcroft2009, 445–7), making it impossible for many farms to meet requisition quotas.
The key feature of Holodomor that defines it as repression and sets it apart from many other famines, including other famines in Ukraine,Footnote 4 is that state authorities responded to the poor harvest not by relaxing coercive extraction, but by taking a series of punitive steps. Blaming grain shortages on hoarding by “enemies of the state,” Soviet authorities sent State Political Directorate (GPU) agents door-to-door to confiscate food, livestock, and seeds. Farms and villages that failed to meet requisition targets had to make up their losses with increased quotas for the next harvest and were denied access to food purchases and credit. This was effectively “a death sentence… on the population of the given kolkhoz, village, or rayon” (Wolowyna et al. Reference Wolowyna, Plokhy, Levchuk, Rudnytskyi, Shevchuk and Kovbasiuk2016, 19). The state banned private farming, including gardening for household subsistence, and even fishing, and introduced internal passports and residency permits, preventing villagers from seeking food elsewhere.
Without food and unable to search for survival, over three million people—a 10th of Ukraine’s population—died. The famine spread beyond rural areas, with emaciated corpses lying in train stations, and orphans wandering the streets of Kharkiv, Stalino (Donets’k) and other major cities (Kondrashin Reference Kondrashin2012, 665). By the spring of 1933, the famine has reached such horrific proportions that internal OGPU reports started discussing temporal trends not just in deaths (which became too routine), but in cannibalism and “killings for the purpose of eating,” mostly of children (Berelovich Reference Berelovich2005, 428–29).
The state’s vindictive response to failed grain procurements not only precipitated mass starvation but also fostered the belief that Holodomor was a deliberate act of repression. The central government instructed local officials to interpret crop shortages as expressions of political opposition. In response, local officials saw hunger as means to punish and discipline peasants (Snyder Reference Snyder2010). At the height of famine, one local official complained that “hunger has not yet taught many collective farmers good sense” (cited in Ellman Reference Ellman2005). In testimonies, survivors “unanimously associated the famine with the total confiscation of all food (not only grain, but also homegrown produce) by vindictive and brutal squads of ‘activists’ or GPU agents, and… stressed that starving peasants were trapped, imprisoned in their dying villages” (Werth Reference Werth, Graziosi, Hajda and Hryn2013, xxx). Soviet intelligence detected such sentiments as soon as the famine began. In July 1932, one official reported that “It is no secret that people are saying the grain was taken by Moscow” (Marples Reference Marples2009, 512). Perceptions of famine as an act of state violence—where “they” (Soviets) attempted to annihilate “us” (Ukrainians)—persist today (Kul’chyts’kyi Reference Kul’chyts’kyi2007). Over 70 percent of Ukrainians now view Holodomor as genocide (Rating Group Ukraine, 2017).
Schelling (Reference Schelling1966, 2–5) famously argued that the impact of coercion depends less on the punisher’s actual intent than on the interpretation of that intent by others. In this sense, Holodomor presents a rare opportunity to evaluate the behavioral impact of repression in a theoretically plausible way. As we show later, exogenous natural factors impacted local variation in famine deaths, but the exposed population nonetheless attributed these deaths to state repression. This perception of state culpability for famine deaths in the face of exogenous factors is precisely what allows us to empirically estimate how famine, as a form of repression, affected later political developments.
DATA AND HYPOTHESES
We test our theoretical predictions with disaggregated data on historical famine losses and eight decades of subsequent local political behavior. Our main unit of analysis is the 1933-era Ukrainian rayon, a second-order administrative subdivision. Our sample comprises 386 rayons, which does not include western Ukrainian territories the USSR acquired after 1939 (Volhynia, Galicia, Transcarpathia, Budjak), Crimea, or rayons that are now part of Moldova.
We use data on rayon-level famine losses from the Harvard Ukrainian Research Institute’s Mapa: Digital Atlas of Ukraine (Plokhy Reference Plokhy and Plokhy2016; Wolowyna et al. Reference Wolowyna, Plokhy, Levchuk, Rudnytskyi, Shevchuk and Kovbasiuk2016).Footnote 5 We merge these data with pre-famine covariates. From the 1926 Soviet census, we measure rayons’ urban and rural populations, and local proportions of ethnic Ukrainians and Russians (Central Statistical Directorate of USSR 1928–1929). Because Soviet policy favored geographic specialization in crops—which varied in resilience to weather shocks—we include crop suitability indicators for the locally dominant crop (wheat, potato, and dairy) (Krupskiy and Polupyan Reference Krupskiy and Polupyan1979).Footnote 6 From historical Soviet maps, we measure the proportion of land area covered by forests—which limited arable land, and provided cover to partisans in WWII—and area devoted to heavy and light industry (Bondarchuk Reference Bondarchuk1962; Enukidze Reference Enukidze1928; Zhukov Reference Zhukov2015). The descriptive statistics are reported in Appendix 1.
We consider the effect of famine on five sets of political outcomes from 1941 to 2017. This timespan saw fundamental changes to the political opportunity structure in Ukraine, when geopolitical processes and elite power struggles—both plausibly exogenous to local circumstances in Ukraine—radically altered Moscow’s local coercive leverage. To facilitate comparisons, we scale each outcome variable so that higher values represent greater behavioral opposition to Moscow.
In chronological order, our first outcome variable is opposition to Red partisans in 1941–44. For much of World War II, Ukraine was under German occupation and the threat of Soviet retribution was at best ambiguous. The main local agents of Moscow’s power were Red partisans—pro-Soviet guerrillas who attacked German supply lines, personnel, and collaborators. Partisan units had limited geographic areas of responsibility and rarely ventured outside their home rayons. While they occasionally received assistance from the center, the majority of their support—Moscow insisted—was to be “provided entirely by local resources.”Footnote 7 Without shelter, food, or information from locals, partisan units could not easily sustain operations or hide from German forces (Perezhogin Reference Perezhogin1997).
We measure local opposition to Red partisans by estimating the density of partisan base camps per rayon, and taking its additive inverse.Footnote 8 Large values indicate that partisan camps were scarce, implying low support or even opposition to the Soviet cause. While the absence of base camps is not necessarily evidence of pro-German collaboration, partisans often equated reluctance to support them with disloyalty (Statiev Reference Statiev2014, 1,542). For robustness, we later consider several alternative measures of WWII behavior.
The second outcome variable is the percentage of anti-Soviet votes in elections to the Supreme Soviet in 1946–58, when Moscow’s coercive capacity was indisputable.Footnote 9 In Soviet elections, the ballot listed a single candidate nominated by the regime and a voter could only choose to vote “against all” or not. Ballot secrecy was rarely enforced, and citizens had strong incentives to appear loyal by casting “pro-Soviet” votes (Carson Reference Carson1955). For citizens, “voting against the candidate signified dissent with the ruler” (Merl Reference Merl, Jessen and Richter2011, 281). In turn, the authorities interpreted such votes as acts of disloyalty that signaled local hot-spots of opposition (Gilison Reference Gilison1968; Jacobs Reference Jacobs1970).Footnote 10 We measure anti-Soviet votes by matching electoral district-level voting results to 1933-era rayon borders and then calculating the percent votes cast “against all.”
Our third set of political outcomes is anti-Soviet protests in 1987–91. At this time, the Soviet political order was disintegrating and Moscow’s coercive posture varied from inert to inconsistent. To measure protest activity in this period, we geocode Beissinger (Reference Beissinger2002)’s event database and calculate the frequency of demonstrations—against central state or party institutions, or for Ukrainian independence—in each 1933-era rayon.
The fourth set of outcomes is anti-Russian votes in Ukrainian parliamentary and presidential elections in 2002–14. To construct this variable, we match polling station results from Ukraine’s Central Electoral Commission (UCEC) to 1933-era rayons and calculate the average share of votes cast against parties and candidates promoting favorable interpretations of Soviet history and closer ties to Moscow.Footnote 11
The fifth rayon-level outcome is anti-Yanukovych protests in 2009–13, when pro-Russian president Viktor Yanukovych held office. We measure this variable by geocoding disaggregated protest data from Ishchenko (Reference Ishchenko2013), matching them to 1933-era rayons, and calculating the number of local demonstrations against central or local government institutions. Higher counts of protests indicate greater expressed opposition to Moscow.
Finally, we supplement our community-level analyses with Kupatadze, Zeitzoff, and Zhukov (Reference Kupatadze, Zeitzoff and Zhukov2018)'s individual-level survey data on opposition to pro-Russian armed groups in eastern Ukraine in 2017. As the site of ongoing armed conflict between pro-Kyiv forces and Russian-backed separatists (Donets’k and Luhans’k People’s Republics, or DNR/LNR), eastern Ukraine is a place where resumed repression by pro-Moscow forces is a real possibility. The survey comprises 1,246 face-to-face interviews from September 2017, in three eastern Ukrainian provinces (Kharkiv, Donets’k, Luhans’k), randomly selected through a multistage stratified sampling design. Primary sampling units are 100 government-controlled municipalities, half of which DNR/LNR had previously occupied. We measure respondents’ opposition to pro-Russian armed groups, their views on Holodomor’s causes, and whether any of their family members died in the famine (Appendix 2 gives details). In addition to addressing ecological inference concerns, the survey allows us to exploit geographic variation in the threat of coercion. To capture this variation, we count the number of days a respondent’s town or village spent under DNR/LNR control since 2014.Footnote 12
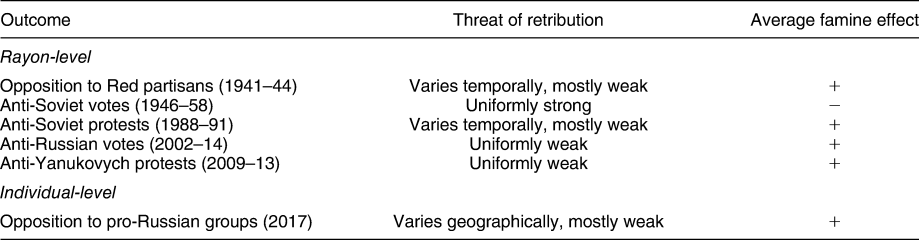
Table 1 summarizes our hypotheses with respect to each post-repression outcome. Three of our outcomes fall entirely within historical periods when the threat of retribution was uniformly strong (anti-Soviet votes) or weak (anti-Russian votes and anti-Yanukovych protests). Accordingly, we expect fewer anti-Soviet votes, but more anti-Russian votes and protests in rayons exposed to more famine.
Post-famine Outcomes, Retribution Threat, and Hypothesized Effects

Three other outcomes (opposition to partisans, anti-Soviet protests, and opposition to pro-Russian armed groups in 2017) unfolded in volatile conditions, with a variable threat of retribution. In the early stages of WWII, Germany had near-complete control over Ukraine, which obviated the local threat of Soviet retribution. In late 1943, as the tide of the war turned in Moscow’s favor, locals saw the Red Army returning and state security services resurrecting the threat of Soviet coercion (Priemel Reference Priemel2015). Since most of this era saw a low threat of Soviet retribution, we expect famine to have inflamed opposition to Red partisans, on average. We then disaggregate this outcome by year, to study the effect of shifting expectations of retribution after 1943.
Anti-Soviet protests in the late 1980s also unfolded in a volatile environment, when Moscow’s retributive threat was initially high, and then declined, with sporadic crackdowns on protests. Since the threat of retribution was weak, on average, in 1987–91, we expect a positive famine effect on protests throughout this period. Later, we explore how this relationship changed depending on the regime’s responses to protests.
Since 2014, much of the variation in coercive threats has been geographic: Between territories Kyiv always controlled and those where pro-Russian separatists had previously established a foothold. DNR/LNR have openly embraced Soviet symbols and methods to suppress dissent and consolidate power, including “nationalizing” large agribusinesses on territories they control, and requisitioning crops from farmers on “state-owned” land.Footnote 13 While we generally expect descendants of famine victims to be more likely than non-descendants to express anti-Moscow views, this relationship should be weaker among descendants who experienced separatist rule.
EMPIRICAL STRATEGY
Our identification strategy exploits exogenous variation in local famine mortality due to weather shocks. Although Ukraine has extremely fertile soil, it is susceptible to adverse weather that occasionally causes dramatic agricultural losses (Kogan, Adamenko, and Kulbida Reference Kogan, Adamenko and Kulbida2011). In 1931–32, successive waves of heat, cold, drought, and excess rainfall disrupted germination and sowing, caused plant infestations, and prompted a drop in yield (Davies and Wheatcroft Reference Davies and Wheatcroft2009; Tauger Reference Tauger2001). This decline in production resulted in locally more intense punitive behaviors by the state and led to more deaths.
We use historical monthly mean air temperature and precipitation data (0.5 × 0.5° grid, Matsuura and Willmott Reference Matsuura and Willmott2014), spatially matched to 1933-era rayons (see Appendix 1.2). Because the famine’s main wave peaked in early 1933 (Rudnytskyi et al. Reference Rudnytskyi, Levchuk, Wolowyna, Shevchuk and Kovbasiuk2015), we use weather variables from January 1931 to December 1932, consistent with time windows emphasized in historical literature (Davies and Wheatcroft Reference Davies and Wheatcroft2009; Tauger Reference Tauger2001). We define weather shocks as deviations from median rainfall and temperature in each rayon and month in 1926–30—a benchmark period for Soviet agricultural planning. By construction, these shocks have no seasonal variation and capture locally unusual weather, which is most disruptive for crops (Cantelaube and Terres Reference Cantelaube and Terres2005).
Due to the high number of potential instruments (2 monthly weather shocks × 12 months × 2 years = 48), we adopt several approaches to systematically select weather shocks (Appendix 3). First, we select weather shocks that have appeared in historical research on famine (e.g., Davies and Wheatcroft Reference Davies and Wheatcroft2009; Tauger Reference Tauger2001). Second, following Belloni et al. (Reference Belloni, Chen, Chernozhukov and Hansen2012), we use LASSO and Bayesian model selection to identify a subset of weather shocks that best predict famine mortality. Third, we use Bayesian model averaging (Raftery, Madigan, and Hoeting Reference Raftery, Madigan and Jennifer1997) to construct a scalar index of weather adversity—a linear combination of weather shocks that optimally predict local variation in famine mortality. The three types of instruments lead to very similar results, as we discuss below. Because a scalar index permits the most efficient and interpretable instrument plausibility and placebo tests, we use the third measure in our baseline specifications.
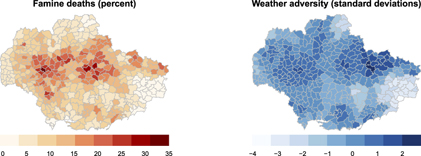
Figure 1 shows the distribution of famine deaths (percent of rayon population) and the weather adversity index (standard deviations from mean). The variables are strongly correlated: all else equal, a standard deviation increase in weather adversity is associated with 2.8 percent greater famine fatalities (p < 0.001). Appendix 4 discusses, quantitatively and qualitatively, potential mechanisms connecting weather shocks to famine.
Famine Deaths and Weather Adversity

Specification
We use the following two-stage regression specification:
 $${\rm{ln}}\left( {{\rm{Famin}}{{\rm{e}}_i}} \right) = \theta \cdot {\rm{Weathe}}{{\rm{r}}_i} + {\rm{Oblas}}{{\rm{t}}_{j\left[ i \right]}} + {\bi{\beta }}\prime {{\bi{x}}_i} + {{\bi{v}}_i} + {\epsilon _i},$$
 $${y_i} = \alpha \cdot {{\hskip2.5pc\hscale670%\vscale150%\widehat}} {\hskip-2.5pc\ln \left( {{\rm{Famin}}{{\rm{e}}_i}} \right)} + {\rm{Oblas}}{{\rm{t}}_{j\left[ i \right]}} + {\bi{\zeta }}\prime {{\bi{x}}_i} + {{\bi{v}}_i} + {u_i}.$$
For each political outcome, denoted by y i, we estimate the parameter α: the causal effect of weather-induced famine deaths. The control variables x i include pre-famine population, proportion rural population, proportion of Ukrainians and Russians, forestation, industrialization, and dominant agricultural products (wheat, potato, and diary). Since proximity to Russia could be a confounding factor, we flexibly control for distance to the Russian border using cubic regression splines. We also include oblast fixed effects to account for variation in political outcomes due to regional political and socioeconomic differences.
Because famine deaths and political outcomes are geographically clustered, both equations include synthetic spatial covariates vi (Moran eigenvectors) to remove autocorrelation from second-stage residuals (Dray, Legendre, and Peres-Neto Reference Dray, Legendre and Peres-Neto2006). To account for regional differences in covariance structures, we cluster standard errors by oblast. Since the treatment and most outcomes are aggregates whose measurement is more precise in large-population areas, we weight observations by pre-famine population.Footnote 14
Instrument Plausibility
A potential concern with our empirical design is that weather instruments “depoliticize” famine—they identify effects that are attributable to natural causes, not repression. The primary causes of Holodomor were political, in that the famine would not have occurred without collectivization, forcible grain requisitions, punitive quotas, mass arrests, and movement restrictions. Nonetheless, archival evidence and multiple historical studies (Davies and Wheatcroft Reference Davies and Wheatcroft2009; Kotkin Reference Kotkin2017; Tauger Reference Tauger2001) suggest that Ukrainian locations that experienced worse weather also saw more famine deaths, in part because it intensified the deleterious effects of Soviet policies.Footnote 15 Crucially, however, even where natural causes contributed to famine mortality, citizens attributed famine deaths to the regime.
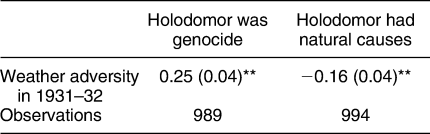
The first piece of evidence in support of this claim comes from our survey, which asked respondents if they considered Holodomor a “premeditated Soviet attempt to destroy the Ukrainian people” (genocide) and whether Holodomor was “largely due to crop failure, and not Soviet actions” (natural causes). We regressed answers to these questions on pre-famine weather adversity. As Table 2 shows, respondents who reside in rayons with adverse weather in 1931–32 are more likely to see Holodomor as genocide and less likely to attribute it to natural factors. Bad weather did not lessen the perceived culpability of the Soviet regime—it intensified it.
Weather and Attribution of Famine’s Causes in Survey

OLS coefficients for rayon-level weather adversity. Standard errors in parentheses clustered by 1933 rayons. Outcome variables measured on five point Likert scale. Significance levels: †p < 0.1; * p < 0.05; and ** p < 0.01.
A second piece of evidence can be found in contemporaneous archival documents and memoirs of famine witnesses (discussed in detail in Appendix 5), for whom bad weather laid bare the merciless nature of Soviet collectivization and grain procurement. Places hit by bad weather had less food to start with, but peasants watched as authorities went “relentlessly tramping from house to house, confiscating everything edible they could find in their attempt to meet state quotas” (Dolot Reference Dolot1985, 174, 222). The regime’s willingness to punish peasants for missing quotas tended to politicize famine deaths, even where weather or other exogenous forces were behind the poor harvest.
Furthermore, places hit by worse weather observed more conspicuous acts of state repression. The Central Committee of Ukraine’s Communist Party explicitly disallowed the use of weather and other exigencies as excuses for missing quotas. Local authorities were instructed to treat all grain shortages as acts of political sabotage:
This sharp decline cannot be explained by any objective causes like rain and so on. The Central Committee believes that the main reason is bad organizational work in the area of grain procurement… This shows that … resistance and sabotage organized by kulak counter-revolutionary elements and their conspirators is not yet broken, the repressive measures against them are applied insufficiently and too hesitantly.Footnote 16
These “insufficiently applied” repressive measures included confiscating livestock and food, using “blacklists” to deny villages access to food purchases, credit, and grain advances, along with public beatings, harassment, and mass arrests, which were, even by internal admissions, indiscriminate and “over-the-top” (Appendix 5). Later, when Soviet authorities attempted to hide the history of famine, locals interpreted these denials as further evidence of state culpability (Applebaum Reference Applebaum2017). In view of this, it is unsurprising that perceptions of state repressiveness would be higher in places hit by bad weather: These places saw more famine deaths and more open expressions of state violence.
RESULTS
Community-Level Effects
Table 3 reports OLS and IV estimates of the effects of famine on the five rayon-level political outcomes. For comparability, we normalized each outcome so that coefficients represent the effect of doubling per capita famine mortality on standard deviation changes in the outcome.Footnote 17 Instruments are strong across all specifications, as first-stage F-statistics indicate.Footnote 18 OLS and IV estimates are identical in direction and similar in magnitude, except for two protest variables where OLS coefficients are substantially smaller, which may indicate that there are omitted variables correlated with famine mortality and protests.Footnote 19
Famine Mortality and Post-famine Averaged Outcomes

The estimates are for the effect of logged famine mortality using normalized outcomes. IV specification uses weather adversity index as instrument. All models control for pre-famine total population, rural population, proportion of Ukrainians and Russians, forestation, industrialization, crop suitability, oblast fixed effects, synthetic spatial covariates, and cubic spline for the distance to Russian border. Standard errors are clustered by oblast. Full TSLS output reported in Appendix 6. Significance levels (two-tailed): † p < 0.1; * p < 0.05; ** p < 0.01.
The results align closely with our theoretical expectations. First, in 1941–44, Red partisans had a significantly harder time operating in rayons hard-hit by famine, even after accounting for forest cover, ethnicity, and other factors that might have facilitated guerrilla warfare. In substantive terms, doubling famine mortality reduced the density of partisan base camps by 0.77 standard deviations (IV specification). This result—suggesting that past repression inflames opposition when the original repressor cannot credibly threaten retribution—resonates with anecdotal accounts of how famine’s memories contributed to local support for German forces early in the war. As one woman recalled, “We were all so happy to see them [Germans]. They were going to save us from the Communists who had taken everything and starved us” (Alexandrow and French Reference Alexandrow and French1995, 56).
Second, after Moscow unambiguously re-established its rule in Ukraine, localities more exposed to famine became less likely to cast anti-Soviet votes in elections (by about 0.50 standard deviations). In 1946–58, Moscow showed no hesitation in using mass deportations, killings, and other violence against anti-Soviet insurgents in western Ukraine and the Baltic States—the areas Stalin annexed in 1939, and which did not experience famine in 1933. While most of this renewed coercion occurred outside our study region, the state’s predisposition to extreme violence was beyond question. Consistent with our expectations, the effect of famine on anti-Soviet votes is negative and statistically significant in this period. The very same communities that were reluctant to support Soviet authorities on the battlefield now signaled their loyalty to the regime at the ballot box.
Third, places that experienced greater famine saw more anti-Soviet protests in 1987–91, when the regime’s ability to suppress behavioral challenges was again in doubt. Earlier, Soviet authorities either violently cracked down on street protests (as in Novocherkassk in 1962), or systematically arrested key participants (as they did under Brezhnev). In the late 1980s, the state’s responses became sporadic and inconsistent, lowering “public expectations about the probability of successful demobilization by force” (Beissinger Reference Beissinger2002, 330). The magnitude of this effect approximates that on anti-Soviet votes, but in the opposite direction. While many differences exist between anti-Soviet votes under Stalin and protests before the Soviet collapse—as we discuss below—the complete reversal of famine’s effect is significant evidence that the legacy of repression is contingent on threats of retribution.
Finally, in 2002–14, when Moscow’s coercive leverage in independent Ukraine was very limited, citizens could express their anti-Russian (and anti-Soviet) preferences without fear of reprisals. Table 3 shows that communities more exposed to famine saw significantly lower electoral support for pro-Russian parties (by 0.36 standard deviations) and significantly more protests (by 0.50 standard deviations) against the “pro-Russian” government of Viktor Yanukovych.
The above results are robust to alternative specifications, alternative weather instruments and measures of WWII behaviors; in addition, these results are not driven by potential outliers or the measurement error in our weather instrument, as we show in Appendix 7. We also conducted a placebo test to evaluate whether potential violations of the exclusion restriction are driving our estimates. Our placebo test exploits the fact that western Ukraine (which is outside our sample) became part of the Soviet Union only in 1939 and did not experience famine in 1933 despite similar climatic conditions to Soviet-administered Ukraine. Therefore, the causal channel relating weather adversity to post-famine political behavior was effectively blocked in these territories. If the reduced-form relationships between weather and political outcomes in western Ukraine are similar to those in central-eastern Ukraine (our sample), this would indicate that weather affected those political outcomes through channels other than famine. Although a single test cannot rule out all potential violations of the exclusion restriction, the placebo tests in Appendix 8 do not indicate problems with the instrument validity: The reduced-form relationships between weather adversity and post-famine outcomes closely resemble the IV estimates in central-eastern Ukraine, but not in western Ukraine.
Individual-Level Effects
To see whether the community-level effects of famine also hold for individuals, we turn to our survey data. Our dependent variable here is an index measure of opposition to pro-Russian armed groups.Footnote 20 The independent variable, Family losses, is equal to one if a respondent’s immediate or extended family members died in the famine.Footnote 21 We expect individuals who lost family members to be more opposed to pro-Russian separatists. However, this effect should attenuate among respondents who had lived under DNR/LNR control, where Moscow’s retributive threat was more apparent.
Table 4 reports OLS coefficients for three regressions. In column 1, we regress the index measure of opposition on Family losses. We see that descendants of famine victims tend to express substantially more opposition to pro-Russian separatists. In column 2, we interact famine losses with DNR/LNR control, and find that the marginal effect of Family losses is decreasing in the duration of separatist control.Footnote 22 The effect of family losses is 0.38 in the areas that pro-Russian separatists never controlled, but it falls to 0.38–0.46 = −0.08 in places they controlled for 90 days. Column 3 restricts comparisons to the immediate conflict zone of Donets’k and Luhans’k oblasts. Here, differences between marginal effects are even more pronounced: 0.46 versus 0.46–0.60 = −0.16, respectively.Footnote 23
Family-Level Effects of Famine Losses by Coercion Threat

The dependent variable is the index measure of opposition to pro-Russian separatism. OLS coefficients with standard errors in parentheses clustered by 1933 rayons. Significance levels: † p < 0.1; * p < 0.05; and ** p < 0.01.
In sum, the individuals whose families were victimized by famine are more willing to express opposition to pro-Russian groups, except in the areas these groups recently controlled. While point estimates in DRN/LNR strata are opposite in sign to those in non-DNR/LNR strata, they are smaller and statistically indistinguishable from zero (although the difference between coefficients is significant). Our sample comprises only government-controlled settlements where separatist rule lasted 90 days at most, and so it is possible that longer pro-Russian control—and a more intense retributive threat—would have further amplified this deterrent effect in DNR/LNR strata.
ALTERNATIVE EXPLANATIONS
We attribute the heterogeneity in famine’s behavioral effects to changes in the political opportunity structure across time (in rayon-level analyses) and space (in survey analyses). These changes—fallout from geopolitical crises and elite power struggles in Moscow—were plausibly exogenous to local events in Ukrainian rayons. Nonetheless, other explanations of this heterogeneity warrant consideration.
Incomparability of Political Behaviors
It is possible that differences in political behaviors, not political conditions, explain the observed heterogeneity in famine’s effects. Opposing pro-regime guerrillas is different from protesting or voting, and placing these side-by-side can be misleading. We therefore examine the heterogeneity of famine effects within two cases when political opportunity structures changed, but citizens’ choices and overall background economic and social conditions stayed largely the same: WWII and the late Soviet era.
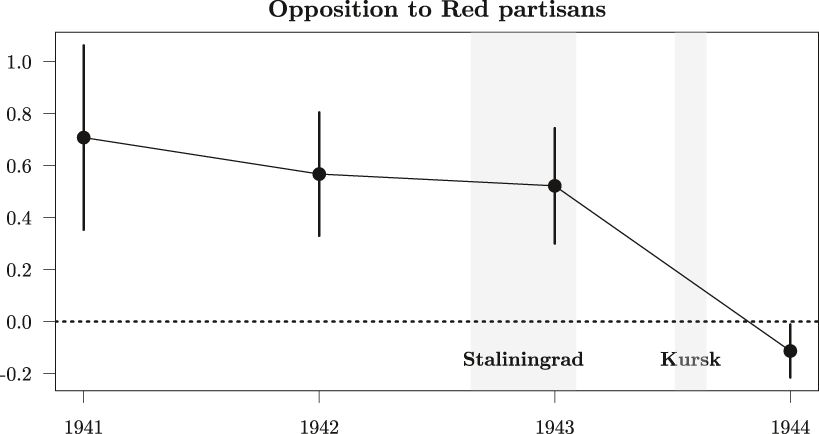
We begin by considering how famine’s effect on Red partisan support varied through different stages of WWII. This disaggregation can help reveal short-term heterogeneity, while holding constant key fundamentals such as war, regime type, economic deprivation, and collectivized agriculture (which continued under German occupation). Figure 2 shows IV coefficient estimates broken down by year (the highest available resolution).Footnote 24 At the start of WWII, opposition to Red partisans was strongest in the famine-ridden areas. This effect gradually declined until 1943, and then reversed. By 1944, Red partisans were encountering significantly less opposition in the famine-ridden areas than elsewhere.
Famine Effects on Red Partisans by Year
The figure shows IV coefficients for famine mortality on the local opposition to Red partisans (in terms of standard deviations from each year’s mean). The vertical bars are 95% confidence intervals.

The structural shift in famine’s effect between 1943 and 1944 corresponds to the changing expectations about the war’s likeliest outcome, and the type of repression that would subsequently ensue. While the outlook in 1941 favored an eventual German victory (Overy Reference Overy1998, 94–6), these expectations changed after Soviet successes in Stalingrad (February 1943) and Kursk (August 1943)—the latter being Germany’s final strategic offensive in the east. Germany’s weakened position soon became apparent to civilians, as occupying authorities began dismantling industrial installations and offered concessions—particularly in land use—to gain local support (Priemel Reference Priemel2015, 49). Ukrainians, in turn, interpreted these moves as a “sure sign that they’re taking to their heels” (Berkhoff Reference Berkhoff2008b, 139). Seeing clear indications that the USSR—and its secret police—was returning in full force, the famine-ridden communities began to fall in line.
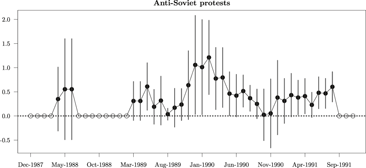
A second period of short-term variation in Moscow’s retributive threat came in 1987–91, when the regime’s posture toward protesters swiftly oscillated between passivity and sporadic confrontation. To evaluate heterogeneity in famine’s effect on protests, we took three initial months of protest data and calculated a normalized protest count within that window for each rayon. We then fitted our baseline IV regression and iteratively advanced the time window by 30 days until December 1991. Figure 3 reports the coefficients for each of those windows. While many factors were behind this dynamic, expectations of the regime’s likely response to dissent appear to have played a role.
Effects of Famine Mortality on anti-Soviet Protests by Time
Figure shows IV coefficients with 95% confidence intervals from the model fit on a three month window rolled forward by 30 days. Dependent variables are standard deviation shifts in the incidence of anti-Soviet protests. Hollow circles are for windows with insufficient data.

In the spring of 1989, authorities permitted the founding of the People’s Movement of Ukraine (Rukh), a civic movement that served as a platform for anti-Soviet dissidents and Ukrainian nationalists. After this political opening, which signaled a more accommodating stance toward expressions of anti-Soviet attitudes, the marginal effect of famine increased and became statistically significant. Famine’s marginal effect peaked in the winter of 1989–90, when the percentage of protests resulting in arrests across the USSR fell from 14% in August to 2% in January. During this period, security forces sought to “avoid participating in internal conflicts… and this position of being a sideline observer… stimulated action… by forces in society” (Beissinger Reference Beissinger2002, 352). The effect of famine on anti-Soviet protests attenuated when Moscow took a more punitive posture—as in late 1990, when arrests rose from 1% of protests in August to 9% in December, culminating with an unsuccessful military intervention in Vilnius, Lithuania, in January. This shift in expectations—and positive famine effect—solidified after the army’s withdrawal from Vilnius and continued through Ukraine’s declaration of independence in August 1991.
Changes to Ethnic Composition
A second possibility is that famine affected political behavior by changing the local ethnic balance. Soviet authorities attempted to resettle the famine-ridden areas with more “trustworthy” inhabitants from Russia and elsewhere in Ukraine, but most new settlers did not stay permanently (Iefimenko Reference Iefimenko2013). Nonetheless, ethnic composition may still have changed due to differential death rates or residential sorting after the famine.Footnote 25
The ethnic explanation could systematically account for our results if famine first increased the local proportion of Ukrainians (to explain anti-Soviet behavior in 1941–43), then these same localities abruptly became more Russian (to explain pro-Soviet behavior in 1944 and 1946–58), and Ukrainian again (to explain later patterns). Such extreme fluctuations in ethnic composition do not seem plausible.
We find no quantitative evidence that famine affected politics by changing local ethnic composition. Using our baseline IV specifications, we estimated the effect of famine on rayon-level proportions of Ukrainians and Russians in 1939 and 2001.Footnote 26 Famine had no effect on local ethnic composition in 1939, suggesting that famine-induced ethnic changes cannot account for political behaviors during and after WWII (see Appendix 13.2). However, famine did increase the local proportion of self-identified Ukrainians in the 2001 census. This change in ethnic self-identification and language adoption is consistent with our story: Rejecting the repressor’s identity is itself a form of behavioral opposition (cf. Balcells Reference Balcells2012), and this option became less costly in independent Ukraine. That said, causal mediation tests reported in Appendix 13.2 show no evidence that ethnic composition in 2001 could be a mediator explaining our post-Soviet results.
Political Mobilization and Propaganda
Yet another possibility is that the effects of famine varied due to political mobilization by different incumbent authorities. In 1941–43, Germany may have used propaganda and agricultural policy to mobilize famine survivors against Moscow. After WWII, Soviet authorities may have sought to mobilize the same communities to act more loyally. In the post-Soviet era, the increasing salience of Holodomor in Ukrainian politics could have similar effects. We discuss each of these possibilities in turn.
German Occupation
Although Germany’s occupation regime did exploit famine memories for propaganda purposes (Applebaum Reference Applebaum2017), it is doubtful that these efforts explain why the famine-ridden communities initially behaved more anti-Soviet. German-sponsored Ukrainian press discussed the famine early in the war, mostly to incite anti-Semitism. Yet, the bulk of Nazi propaganda focused on convincing locals that Stalin was defeated and major Russian cities have fallen (Berkhoff Reference Berkhoff2008b, 50–1, 120). Famine was a risky propaganda topic for Germany, because it cast a spotlight on the Reich’s own coercive food extraction practices, which were heavily modeled on the Soviet example (Snyder Reference Snyder2010, 160–2). Under Himmler’s Generalplan Ost, Germany embraced starvation to coerce and numerically reduce Ukraine’s “superfluous” population, confiscating food from “idling” peasants, searching homes for grain, imposing compulsory farm labor, and using threats of renewed famine to deter collaboration with partisans (Berkhoff Reference Berkhoff2008a, 175; Statiev Reference Statiev2010, 62–5). These practices were difficult to reconcile with propaganda emphasizing the relative brutality of Soviet agricultural policies.
To further investigate this alternative explanation, we examine how experiences of famine affected battlefield behavior of Red Army soldiers drafted from Ukraine.Footnote 27 If, indeed, it was German propaganda that activated anti-Soviet behaviors during the early stages of WWII, then famine should not have affected the behavior of Red Army soldiers who were exposed to Holodomor while living in the famine-ridden areas, but not exposed to German propaganda in occupied territories.Footnote 28
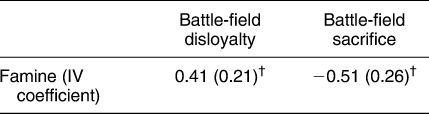
We tested this empirical implication with the personnel records of 1,048,986 Red Army soldiers and officers born on the territory of Soviet Ukraine (Appendix 11). After matching individuals’ birth locations to 1933 rayons, we calculated local Battlefield disloyalty scores: The share of soldiers born in each rayon who deserted, defected, or committed treason were captured or missing.Footnote 29 We also calculated rayon-level Battlefield sacrifice scores: proportion of soldiers killed or wounded in action. We regressed these outcomes on famine mortality, using our baseline IV specification. Table 5 confirms that battlefield disloyalty was higher and sacrifice was lower among Soviet soldiers from the famine-ridden areas. These results support Soviet accounts during the famine that “problems with bread and material difficulties” negatively affected military morale (Kondrashin Reference Kondrashin2011, 284–5). They do not support the notion that German propaganda drove anti-Soviet behavior in WWII.
Famine and Battle-Field Behavior in WWII

Effects of famine mortality in the Red Army soldier’s birth rayons on their battle-field performance (rayon-level averages). IV regressions using baseline specification and standard errors clustered by oblast. Significance levels: † p < 0.1; * p < 0.05; and ** p < 0.01.
The Soviet Period
Could pro-Soviet behavior in the famine-ridden communities after WWII have resulted from propaganda or electoral mobilization efforts by local authorities? In principle, this would have been highly unlikely. Famine was a taboo topic at all levels of government, and local authorities—like the Germans—had neither administrative incentives nor accurate information about famine fatalities to target their efforts in this way.
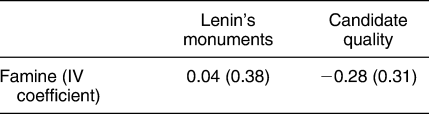
To consider this possibility more directly, we preformed several tests (described in Appendix 12). First, we collected data on the locations of monuments to Lenin—a crucial tool of Soviet propaganda—built by Soviet authorities in Ukraine. If propagandists targeted the famine-ridden communities, we should see more Lenin statues in such places. Second, using archival records on candidates in Supreme Soviet elections, we evaluated whether candidates with greater vote-mobilization capacity—Communist Party members, decorated war veterans, or ethnic Ukrainians—were more likely to be nominated in high-famine areas. If electoral mobilization was more intense in famine-struck rayons, Moscow should have nominated higher quality candidates there. As IV coefficients in Table 6 show, neither of these predictions hold: The famine-ridden communities did not see more monuments to Lenin, or the nomination of higher quality candidates.Footnote 30
Effects of Famine on Soviet Propaganda and Electoral Mobilization

Effects of famine mortality on rayon-level count of Lenin’s statues and average quality of nominated candidates in Soviet elections (rayon-level averages). IV regressions using baseline specification and standard errors clustered by oblast. Significance levels: † p < 0.1; * p < 0.05; and ** p < 0.01.
In Appendix 12, we consider several additional Soviet actions that might help explain a negative effect of famine on behavioral challenges during the Soviet period: vote falsification, famine relief, and economic investment. Neither qualitative nor quantitative evidence indicates that these efforts are behind the reported results.
Finally, ethnographic evidence suggests that the famine-ridden communities were expressing more pro-Soviet attitudes long before WWII. Shortly after the famine, one visitor was stunned that Ukrainian villagers appeared more supportive of the regime (Goychenko Reference Goychenko2012, 300–1). In 1933, another visitor was outraged that people in his birth village so quickly “forgot” and “forgave” what Soviet authorities did (Galagan Reference Galagan1956). Peasants who observed and survived the horrors of famine clearly declared their political loyalties: “We will do everything expected of us” (Kotkin Reference Kotkin2017, 130). Post-WWII Soviet actions cannot account for such immediate effects.
Post-Soviet Period
After the Soviet collapse, Holodomor was no longer a taboo topic and its cultural and political salience rose significantly in Ukraine. Could this increased public awareness explain anti-Russian behavior in the famine-ridden areas today? To investigate this possibility, we examined whether the frequency of references to Holodomor in Ukrainian media and parliamentary debates aligns with temporal variation in famine’s effect (Appendix 13). We found no synchronicity between these trends. The famine’s political salience peaked after the Orange Revolution (especially in 2006–07) and after Euromaidan protests in 2013. Yet, the famine’s inflammatory effect was strongest in 2002–04—before the issue had become a staple of domestic politics—and weakest in the two 2014 elections, at the peak of Holodomor’s salience.Footnote 31
Overall, we find no consistent empirical support for any of the theoretically plausible alternative explanations for why they effects of famine varied the way they did. It is quite possible to formulate an alternative explanation for each individual finding. Taken as a whole, however, the changing political opportunity structure remains the simplest plausible explanation of our findings.
MECHANISMS OF PERSISTENCE
What explains the remarkable durability of famine’s political effects? Past research on historical legacies draws a distinction between the legacy of living through an event and the legacy of the event itself (Pop-Eleches and Tucker Reference Pop-Eleches and Tucker2017). One could attribute the short-term effects of famine to its transformative impact on the beliefs, attitudes, or norms of those who witnessed it (cf. Simpser, Slater, and Wittenberg Reference Simpser, Slater and Wittenberg2018). Yet, the fact that famine still shapes local political behavior eighty years later suggests that its legacy has taken deeper roots.
The existing literature has highlighted several potential channels by which the political lessons of violence can persist, including state propaganda (Charnysh Reference Charnysh2015), religious institutions (Wittenberg Reference Wittenberg2006), and family influences (Balcells Reference Balcells2012; Lupu and Peisakhin Reference Lupu and Peisakhin2017). We do not exclude any of these mechanisms, although quantitative and anecdotal evidence is more supportive of some than others. State propaganda and mobilization, as we have shown, did more to suppress famine memories in the Soviet period, and do not explain much variation thereafter. The Ukrainian Orthodox Church (UOC) served as an incubator of famine memories among the diaspora during Soviet times (Sysyn Reference Sysyn2016), but in post-Soviet Ukraine, the church has been split on the issue. UOC-Moscow Patriarchate’s most recent head, Metropolitan Onufriy, called Holodomor “retribution from God” (Haran and Zdioruk Reference Haran and Zdioruk2012). The family-centered mechanism seems consistent with our survey evidence of anti-Russian views among famine victims’ descendants. However, since only 20 percent of our sample acknowledges losing family members to famine, our discovery of consistent effects on aggregate political behaviors suggests that family is not the only mechanism of persistence.
Our survey data show that respondents from high-famine areas are more likely to hold anti-Russian sentiments than those in low-famine areas, independently of whether their own relatives were victims (Appendix 14). Thus, while important in its own right, family-level exposure is insufficient to explain famine’s persistent effects. As is typical in other cases of mass violence (Blaydes Reference Blaydes2018; Rozenas, Schutte, and Zhukov Reference Rozenas, Schutte and Zhukov2017), people who lived through Holodomor perceived it as an assault not against individuals or families, but against their communities, geographically or ethnically defined (see the narratives of survivors in Appendix 5). It is not surprising, therefore, that people living in the famine-ridden areas would become exposed to narratives of group victimization—not only through their relatives but also their friends, neighbors, co-workers and other community members. This community-level mechanism of persistence warrants closer study in future work.
CONCLUSION
To understand how indiscriminate mass repression affects political behavior, we analyzed the legacy of famine in Soviet Ukraine. We find that Stalin’s “terror by hunger” had a contingent political legacy. Ukrainian localities that experienced harsher famine in 1933 behaved more loyally toward Moscow when and where a threat of retribution for anti-Soviet behaviors was present and clear—in the late stages of WWII and in the aftermath of the war, as well as in the areas that had been controlled by pro-Russian separatist forces. However, these same localities behaved disloyally when such threats abated—in the early stages of WWII, during and after the breakdown of the Soviet Union. Past mass repression can deter behavioral challenges, but only if a regime can credibly threaten violence in response to expressions of opposition.
Our evidence for this proposition draws from a single country, and as such, the usual caveats about external validity apply. Recent research, however, suggests that changes to the threat or retribution—or political opportunity structure more generally—can help explain patterns in other, vastly different environments. Studies in democratic settings—where threats of coercion are generally low—tend to document inflammatory effects of past repression (Balcells Reference Balcells2012; Costalli and Ruggeri Reference Costalli and Ruggeri2015; Fouka and Voth Reference Fouka and Voth2016). Meanwhile, studies in less permissive environments suggest deterrent effects of mass repression (Byman Reference Byman2016; García-Ponce and Wantchekon Reference García-Ponce and Wantchekon2011; Lyall Reference Lyall2009). Taken collectively, this literature yields a coherent set of results, once we appropriately account for underlying heterogeneity in retributive threats. Of course, we cannot rule out the possibility that divergent results are due to differences between the cases that are not captured in our framework—this is something that future research should investigate more thoroughly.
Our findings provide a needed synthesis of two previously disconnected literatures. The scholars of autocratic politics have long argued that threats of coercion can induce citizens to fabricate political loyalty—this is the essence of “preference falsification” (Kuran Reference Kuran1995) and the “dictator’s dilemma” (Wintrobe Reference Wintrobe1998). Surprisingly, the rich empirical literature on repression has not fully integrated these foundational ideas. As our evidence shows, these insights can potentially illuminate why the impact of repression varies so much.
“Terror by hunger” was an extreme form of repression, even by Soviet standards. Consequently, we can only speculate whether similar patterns might accompany other instances of indiscriminate mass terror. Previous studies suggest that some types of violence—mass executions, detentions, and deportations—have effects consistent with at least part of the story that emerges here. Future research should examine more closely how historical legacies materialize, coalesce, and change.
SUPPLEMENTARY MATERIAL
To view supplementary material for this article, please visit https://doi.org/10.1017/S0003055419000066.
Replication materials can be found on Dataverse at: https://doi.org/10.7910/DVN/XKMNAO.






Comments
No Comments have been published for this article.