Introduction
The Silverleaf whitefly (SLW), Bemisia tabaci (Gennadius) B-biotype is an important pest of cropping systems worldwide (Brown et al., Reference Brown, Frohlich and Rosell1995; De Barro, Reference De Barro1995; Ellsworth et al., Reference Ellsworth, Tronstad, Leser, Goodell, Godfrey, Henneberry, Headrix, Brushwood, Naranjo, Castle and Nichols1999; Oliveira et al., Reference Oliveira, Henneberry and Anderson2001). The presence of SLW in Australia was first detected in 1994 (Gunning et al., Reference Gunning, Byrne, Condé, Connelly, Heegstrom and Devonshire1995); the pest has since become a major production constraint on a wide variety of horticultural, fibre, summer grain and oilseed crops in major coastal cropping regions of Queensland and New South Wales (De Barro, Reference De Barro1995; Gunning & Cottage, Reference Gunning and Cottage2000).
The SLW threat to the cotton industry stems principally from the contamination of lint by honeydew excreted by the immature stages and adults. Honeydew contamination can result in crippling price penalties or, in severe cases, make the lint unmarketable. Regional cotton industries with endemic whitefly problems become vulnerable to the stigma of sticky cotton and the consequential negative market sentiment and long-term economic handicap (Hector & Hodkinson, Reference Hector and Hodkinson1989; Ellsworth et al., Reference Ellsworth, Tronstad, Leser, Goodell, Godfrey, Henneberry, Headrix, Brushwood, Naranjo, Castle and Nichols1999).
SLW was first detected in the Emerald Irrigation Area (EIA) of central Queensland (CQ) in 1998, mainly on ornamental plants in parks and gardens (Franzmann et al., Reference Franzmann, Lea and De Barro1998). However, it was not until the winter of 2001 that large numbers of SLW requiring control developed in a few fields of pumpkin, melon and squash (De Barro, Reference De Barro2001). In the following summer months (December 2001–February 2002), the pest increased in numbers rapidly and the EIA experienced its first large-scale outbreak of SLW on cotton, summer grain, horticultural crops, nursery plants and broad-leaved uncultivated host plants (weeds hereafter) (De Barro, Reference De Barro2002; Moore et al., Reference Moore, Sequeira and Woodger2004).
Insect pest activity in the 2001/02 growing season (September–June) in the EIA was dominated overwhelmingly by SLW. Unsuccessful attempts to control the pest in cotton with commonly used insecticides are likely to have contributed to population growth and subsequent spread of the outbreak by March 2002. In the following months, significant SLW activity was also detected in rain-fed crops surrounding the EIA and in the nearby Dawson Valley (Theodore), thereby broadening the threat posed by the pest to one of regional significance.
Here, we report on the population dynamics, host plant relationships and parasitism of SLW in the EIA over four consecutive growing seasons, 2001/02–2004/05. This program of research was undertaken in response to the need to understand SLW field ecology and drivers of pest status and to aid the development of an effective management strategy. Spatial and temporal population growth profiles of SLW, the importance of natural mortality factors and relationships between major whitefly-hosting components of the EIA cropping system were investigated. An index of parasitism by native aphelinid wasps was used to examine the activity of natural enemies and gauge their potential role in the population dynamics of SLW. The results are discussed in the context of local weather conditions and crop management practices.
Materials and methods
Spatial and temporal abundance of SLW
Sampling was conducted on the broad-leaved cropping system components that were known to be susceptible to infestation viz, field crops, weeds and cucurbit crops. Field crops sampled included cotton, sunflower, pulses (soybean, mungbean, navy bean, adzucki bean), melons, pumpkin, peanut and lucerne. The importance of broad-leaved weed plants as sources of future SLW crop infestations was gauged by sampling Sonchus olearaceus L. (sowthistle), which is prolific in the CQ cropping system and one that is most commonly associated with SLW.
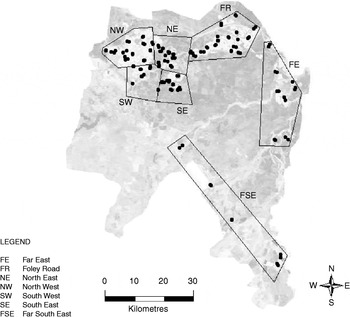
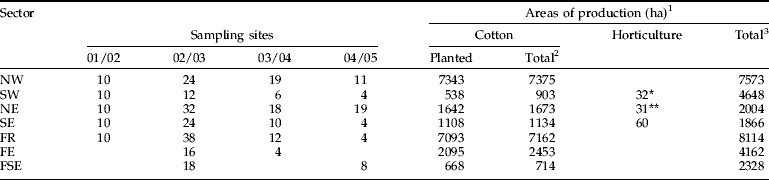
The irrigated cropping area in and around the town of Emerald (23°23′S, 148°10′E) was compartmentalised into seven sampling sectors demarcated by major roads. Fixed sampling sites representing cotton, cucurbit, other (non-cotton) field crop and weed plants were identified for year-round sampling within each area sector (fig. 1). GPS coordinates marked the centre of each sampling site. Cotton and weed sites were represented in all sampling sectors. The NW and FR sectors accounted for the bulk of the cotton production area and, consequently, the majority of cotton sampling sites (table 1). Horticultural sites were split between mostly small (<2 ha) cucurbit fields in the SE sector, watermelons in the SW and rockmelons in the NE sector (table 1).
Distribution of sampling sites and area sectors across the Emerald cropping system. The confluence of the northwest, northeast, southwest and southeast sectors marks the township of Emerald.

Sampling sectors, number of sites sampled (all crops) and areas of production (ha) under cotton and horticulture (cucurbits and melons) in the Emerald Irrigation Area. (Source: W. Wilkinson, Department of Natural Resources, Emerald).
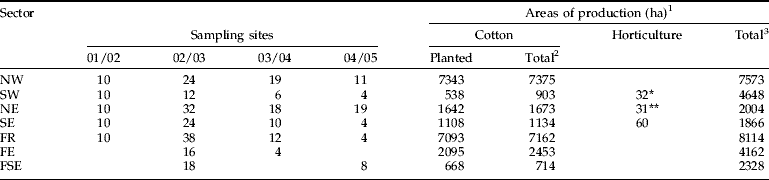
1 2002/03 growing season; 2 Includes fallow cotton areas; 3 Includes areas under grain legumes, summer and winter cereals; * Watermelon; ** Rockmelon.
In the first (2001/02) season, sampling was conducted at monthly intervals within the NE, NW, SE, SW and FR sectors (fig. 1, table 1), primarily on cotton. Within each sector, adult and large (3rd and 4th instar) nymph counts were obtained from 200 cotton plants from each of ten sampling sites. Sampling of weeds was limited by the paucity of suitable sites as a result of drought conditions. Weed sites were sampled according to availability, primarily between July and September. Counts of adult and juvenile SLW were obtained from ten sowthistle plants within each of ten sites within each sector.
The scope of the sampling effort was expanded in 2002/03 to 164 sites over all crops (table 1) in response to the large scale of the outbreak in the previous season. The frequency of sampling was increased to fortnightly intervals whilst the sample size was reduced to 30 plants. At weed sampling sites where plant population density declined as a result of drought, the sample size was reduced to 15 plants. The sampling effort was progressively reduced in the third and fourth growing seasons (69 and 50 sites, respectively), reflecting a shift in the research focus from area-wide population dynamics to field and crop level aspects of bionomics, and development of management tactics.
Sampling cotton crops
Cotton sampling was based on protocols for monitoring SLW in field crops developed in Arizona, USA (Naranjo et al., Reference Naranjo, Ellsworth and Diehl1997; Ellsworth & Martinez-Carrillo, Reference Ellsworth and Martinez-Carrillo2001). Commercial crop sites were sampled in a zigzag or U-shaped pattern after walking approximately 20 m into the crop and allowing 5 m between individual samples. In 2002/03, sampling was restricted to the 5th node leaf, so as to test the applicability of Arizona cotton sampling protocols (Naranjo et al., Reference Naranjo, Ellsworth and Diehl1997) for making insecticide application decisions in CQ cotton fields. Adult density was estimated by gently turning over a single leaf and counting the total number of insects on the abaxial side. The same leaf was used to estimate the density of nymphs. All large nymphs within a 3.88 cm2 disk placed in the leaf sector formed by the left and middle major veins on the underside were counted. In all other seasons, the estimation of SLW density was based on a more flexible sampling protocol to account for variation in plant phenology within and between cropping units (fields); adult density was assessed on a randomly selected 3rd, 4th or 5th node leaf, whereas the density of large nymphs was assessed on a randomly selected 5th, 6th or 7th node leaf using a 3.88 cm2 disk.
Sampling non-cotton crops
The protocol for SLW sampling in non-cotton crops was based on the general trend for spatial segregation of adults and juvenile stages along the main stem of the plant, as reported in the literature (reviewed by De Barro, Reference De Barro1995). In cucurbit fields, adult density was estimated visually on the abaxial side of one leaf randomly selected from the apical half of each vine, whereas large nymph numbers were estimated from a randomly selected leaf from the lower half using a leaf disc. In lucerne and peanut crops, terminal leaves were examined for SLW adults and crown leaves were scrutinized for the large nymphs. The 3.88 cm2 disc was not suitable for plants with tri-foliate leaves. In these cases, the number of large nymphs on the entire trifoliate leaf was recorded.
Sampling weeds
Adults density was estimated visually on the abaxial side of one randomly selected fully unfurled leaf from the apical half of the plant (excluding the youngest leaves). The density of large nymphs was estimated from a 3.88 cm2 disk placed on a randomly selected leaf from the bottom half of the plant.
Unless stated otherwise, individual leaf counts (leaf−1 and cm−2 for adults and nymphs, respectively) were log10 (x+1) transformed prior to analysis, and sampling site means were used in all analyses.
Parasitism of SLW
Parasitism by Encarsia and Eretmocerus parasitoid wasps was assessed from a subset of the GPS tagged sampling sites surveyed for SLW abundance. In Australia, only species of Eretmocerus and Encarsia parasitise B. tabaci. Within individual parasitized nymphs, the two genera are easily distinguished by the shape of the larva and by the presence of meconium pellets in whitefly parasitised by Encarsia (De Barro & Coombs, Reference De Barro and Coombsin press).
Following the same protocol used to estimate SLW abundance (see previous section) in cotton, other field crops and weeds, a set of 30 leaves with large nymphs was collected from each site (total of 72 sites in 2002/03, 100 in 2003/04 and 44 in 2004/04) for examination using a microscope to determine parasitism. One leaf was excised from the lower half of a randomly selected plant; sample size for weeds varied from 15–30 leaves depending on the size of the plant stands. The status of each large nymph (parasitized or healthy) was recorded in all samples. The immature wasp within each parasitised nymph in the 2003/04 and 2004/05 samples was identified to the genus level. Percentage parasitism of large nymphs was computed after summing over all the leaves collected from all sampling sites. Estimates of standard error for proportions were calculated according to Zar (Reference Zar1998).
Analysis
The relative significance of whitefly-susceptible cropping system components as inter-seasonal sources of, and sinks for, SLW was investigated by means of a basic spatial analysis using the combined 2002/03 and 2003/04 nymph and adult abundance data. The analysis was restricted to the cotton and weeds components because they were adequately represented in the sampling scheme; the cucurbit component was excluded because of the relatively insignificant production area and limited number of sampling sites.
A geographical information systems computer package, ArcGIS® 9.2 (Environmental Systems Research Institute Inc. California, USA), was used to produce a two-dimensional spatial map showing the geo-referenced locations of cotton and weed sampling sites in relation to each other. A circle with 5-km radius was drawn around the centre of each weed site. The mean density of SLW and the mean distance to the centre of the weed site were estimated for all cotton sites within each circle. Linear regression was used to quantify the relationship between mean log SLW abundance and mean log distance from a weed site at each sampling date between October and February.
Results
Spatial and temporal abundance of SLW
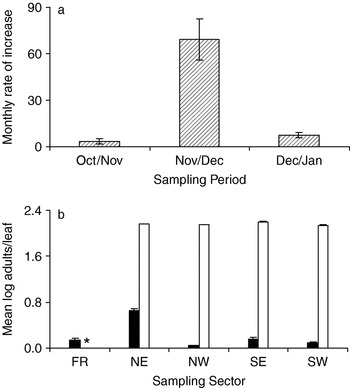
The 2001/02 growing season began with low numbers and a moderate threefold increase in the population growth rate of SLW on cotton crops between October and November (fig. 2a). A 70-fold increase in the growth rate between November and December fuelled exponential population growth to March 2002, by which time cotton crops in all sectors of the EIA and the CQ region were infested with SLW (fig. 2b). Dispersal of adults from cotton to other crops and weeds commenced around mid-January, well before defoliation.
Changes in abundance of SLW in the Emerald Irrigation Area between October 2001 and March 2002. (a) Mean monthly rate of increase in total SLW density (adults+large nymphs) on cotton. (b) Spatial abundance profile of adults (leaf−1 site−1) on cotton sampled on 19 December (coloured bars) and 6 March (clear bars). Error bars show SEM. *, indicates missing data.

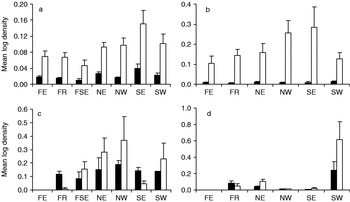
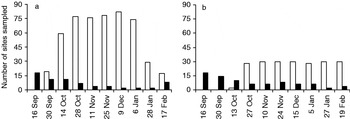
In post-outbreak seasons (2002/03–2004/05), mean seasonal density of SLW on cotton peaked at less than one-tenth of the corresponding density in 2001/02. Population growth on cotton and weeds varied among sampling sectors (fig. 3a–d). The abundance of SLW on weeds largely reflects the survival of weed stands in 2003 and 2004. Progressively fewer weed sites were sampled during the season as the availability of sites declined as a result of persisting drought conditions in 2002/03 and 2003/04 (fig. 4a, b). By comparison, the number of cotton sites sampled was limited not by availability but by the beginning and end of the commercial cotton season.
Seasonal mean sector-wide density of SLW large nymphs (▪) (cm−2 site−1 sample−1) and adults (□) (leaf−1 site−1 sample−1) on cotton in (a) 2002/03, (b) 2003/04 and on sowthistle in (c) 2002/03, (d) 2003/04 in the Emerald Irrigation Area. Error bars show SEM.

The number of cotton (clear bars) and sowthistle (coloured bars) sites sampled for SLW in (a) 2002/03 and (b) 2003/04 in the Emerald Irrigation Area.

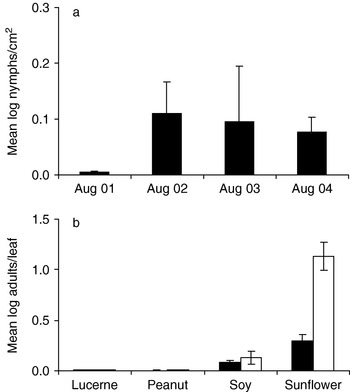
In the absence of cultivated SLW-susceptible (host) crops through winter and early spring, SLW populations persisted through this period each year on broad-leaved weeds such as sowthistle. The area-wide spring reservoir of SLW increased after the 2001/02 season and remained relatively stable thereafter, as evidenced by the abundance of large nymphs on sowthistle in August each year (fig. 5a). The August 2003 survey showed low SLW densities on weeds in all sampling sectors except SW; extensive sowthistle plant stands carrying large SLW populations were found along the borders of fields and in the under-storey of citrus orchards in the SW sector.
Changes in abundance of SLW in crop and non-crop host plants in and around the Emerald Irrigation Area. (a) Large nymphs (cm−2) on sowthistle in August 2001–04. (b) Large nymphs (coloured bars; cm−2) and adults (clear bars; leaf−1) on lucerne, peanut, soybean and sunflower in the 2002/03 growing season. Error bars show SEM.

Variable densities of SLW were found in sunflower, pulse (soybean, navy bean, Dolichos, adzuki bean), peanut and lucerne crops planted in summer (December–February) in and around the EIA. Sunflower and soybean were generally more attractive to SLW than lucerne and peanut in terms of colonization and population growth (fig. 5b). Mass colonization of sunflower and pulse crops by SLW as far as 100 km away from the irrigation area was observed in February and March each year.
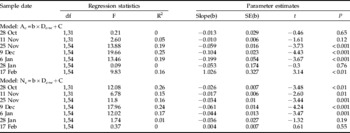
Seasonal SLW population profiles showed a steady decrease in abundance of SLW on weeds in spring each year followed by a rapid increase on cotton in early summer (December; fig. 6a–c). The outputs of the spatial analysis showed that regression of mean log abundance (large nymph and adult) in cotton fields on mean log distance from the centre of over-wintering weed sites resulted in a negative coefficient (slope) at all sampling dates except 17 February (table 2). The regression coefficients for nymph abundance were statistically significant at all sample dates leading up to the open bolls and defoliation stages (26 January and 17 February). The corresponding coefficients for adult abundance were statistically significant in the cotton post-flowering, active growth stages (25 November–6 January; table 2).
Population density profiles of SLW large nymphs on cotton (•) and weeds (□) in the Emerald Irrigation Area over three consecutive growing seasons: (a) 2002/03, (b) 2003/04 and (c) 2004/05. Error bars show SEM.

Parameter estimates and statistics for linear regression of mean log adult (Ac) and large SLW nymph (Nc) abundance at cotton sampling sites in the vicinity (5 km radius) of a winter/spring weed source on mean log distance (Dc-w) to the centre of the weed source for the combined 2002/03 and 2003/04 SLW survey data collected in the Emerald Irrigation Area at fixed (geo-references) cotton and weed sampling sites.

b, regression coefficient.
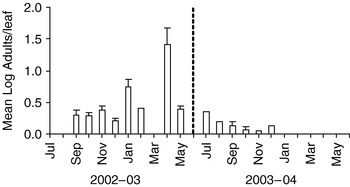
Cucurbit fields, particularly rockmelon and pumpkin, harboured substantial SLW populations (fig. 7). In the SE sector, where most of the small-scale cucurbit fields were located, in the 2002/03 season the mean (±SEM) log density of SLW large nymphs on cotton within 400 m of cucurbit population sources in the October–February sampling period was 0.068 cm−2 (0.031 cm−2), whereas the corresponding density estimate for cotton sites >1500 m away was tenfold lower at 0.009 cm−2 (0.003 cm−2). Due to prevailing drought conditions in the 2004/05 season, there were no small-scale horticultural crops of any significance in the region except the commercial rockmelon crops grown by one grower in the NE sector. These commercial crops experienced early SLW infestations but were not seriously affected.
Monthly mean density of SLW adults on cucurbit crops in the Emerald irrigation area in 2002/03 and 2003/04. Error bars show SEM.

Parasitism of SLW
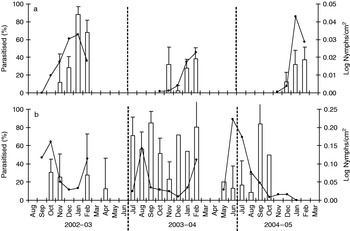
Identification of the immature wasp within parasitised nymphs on cotton and weeds to genus level revealed the presence of Eretmocerus and Encarsia spp. Within the Emerald Irrigation Area, parasitism of large nymphs in cotton generally tracked changes in host density over time in all the sampling seasons (fig. 8a). The within-season profiles of parasitism show an uninterrupted build-up in 2002/03, a mid-season (December) crash in 2003/04 and a delayed build-up in 2004/05. In contrast to cotton, the build-up of parasitoid activity on sowthistle was more variable in space and time, rising from <40% in 2002/03 to >80% of the winter/spring populations in the following seasons (fig. 8b).
Temporal changes in mean total parasitism (site−1; bars) by the native aphelinid wasps Eretmocerus and Encarsia spp. in relation to changes in mean abundance of large SLW nymphs (lines) on (a) cotton and (b) sowthistle host plants in the Emerald Irrigation Area. Error bars show SEM.

Rates of parasitism varied among sectors. Microscopic examination of large nymphs collected on sowthistle in August 2003 showed that of 123 and 334 collected from the FR and NE sectors, respectively, around 80% were parasitised; whereas, in the SW sector where the highest autumn/winter density of SLW was recorded, only 1% of 967 large nymphs were found to be parasitised. From a seasonal perspective, examination of 1049 and 1815 parasitized large nymphs from cotton and sowthistle, respectively, in 2003/04 revealed 69% Eretmocerus wasps in both groups. In 2004/05, Eretmocerus accounted for 41% of 422 and 48% of 794 parasitized large nymphs from cotton and sowthistle, respectively. Encarsia wasps made up the difference in both seasons. Rates of combined parasitism by both groups of wasps ranged from 25–38% of large nymphs across all collections in both seasons.
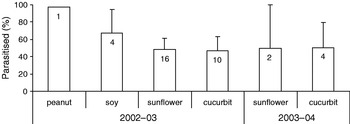
Parasitism of SLW on cucurbit and other crops (fig. 9) varied with time of year and availability of host plants, sometimes reaching levels >80%. In grain, pulse and oilseed host crops, levels of parasitism varied with the time of year and mode of colonisation. In crops that experienced a gradual build up of SLW, parasitism levels ranged from moderate to high. Parasitism was particularly high in peanut although the crop did not appear to be particularly attractive to SLW. Parasitism was often found to be very low or negligible in crops (e.g. sunflower and soybean) that experienced mass colonisation by SLW in mid-summer.
Mean proportion of large SLW nymphs parasitised on cucurbit, grain, pulse and oilseed crops in the Emerald Irrigation Area. Number of sites sampled is shown at the top of each bar. Error bars represent estimated binomial error of the proportion.

Discussion
From a SLW population dynamics perspective, the EIA represents a simple agro-ecosystem with distinct (non-overlapping) spring/summer and autumn/winter cropping options. Cotton, with a largely contiguous production area of ~21,000 ha (65% of the EIA; table 1) during the study period, was by far the largest intensively cultivated host plant resource facilitating population growth of SLW that contributed to the outbreak in late 2001 and the persistence of the SLW pest problem in subsequent seasons.
In the absence of crop options capable of supporting over-wintering populations, broad-leaved weeds, including volunteer crop plants in fallow fields, are the main sources of SLW in spring each year. Inter-seasonal cycling between weeds in autumn/winter and spring/summer host crops, particularly cotton, is a notable feature of SLW population dynamics in the EIA. The within-season population profiles (fig. 6) are consistent with steady, low-level dispersal of SLW from gradually diminishing stands of weeds (e.g. Sonchus) scattered broadly in and around the irrigation area to cotton in spring.
The proposed SLW source-sink relationship between winter weeds and spring cotton is supported by the results of the spatial analysis. Statistically significant negative coefficients for the regression of mean SLW adult and nymph densities in cotton on mean distance from weed sites (table 2) indicate higher population densities on cotton closer to spring weed sources of SLW. The pattern of negative coefficients at all sampling dates leading up to physiological maturity is consistent with higher population growth rates on cotton closer to spring weed sources as a result of earlier colonisation and the ensuing developmental advantage.
The spatial analysis does not provide quantitative analytical support for the reverse source-sink relationship (cotton to weeds) in late summer. However, cotton was revealed as the only significant source of large SLW populations at the end of summer in the four-year survey period. The observed late increase in SLW abundance on weeds regenerated by summer rainfall events (fig. 6a, b) and other host crops in January/February is consistent in timing with the dispersal of adults from finishing cotton crops.
In mixed cropping systems such as the low desert agro-ecosystems of Arizona and the Lower Rio Grande Valley of Texas, USA, small-scale horticultural crops often serve as foci for SLW, resulting in the development of localised population hotspots in adjacent crops (Blua et al., Reference Blua, Perring, Nuessly, Duffus and Toscano1994; Legaspi et al., Reference Legaspi, Legaspi, Carruthers, Goolsby, Hadman, Jones, Murden and Wendel1997). Consistent with these findings, our study shows that cucurbit crops are good whitefly hosts that can be sources of substantial SLW populations (fig. 7) and can result in higher SLW densities in adjacent (<1 km) cotton fields.
In general, cucurbit crops did not appear to contribute significantly to the regional pool or dispersal patterns of SLW in our study, primarily because of the relatively small areas under these crops (table 1) in any year. By comparison, sunflower and pulse (soybean, navy bean, Dolichos, adzuki bean) crops that follow cotton in the cropping sequence adopted in the EIA and surrounding cropping areas served as intermediate hosts for SLW populations, facilitating the transition from cotton to over-wintering weed hosts. Low densities of SLW in lucerne and peanut are consistent with the results of field choice tests (Moore et al., Reference Moore, Sequeira and Woodger2004), which show that they are not preferred host plants, even in outbreak situations.
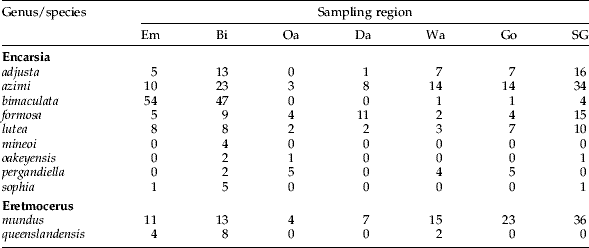
SLW is attacked by numerous predatory and parasitic arthropods worldwide (Gerling et al., Reference Gerling, Alomar and Arnó2001). In Australia, aphelinid wasps from the genera Encarsia and Eretmocerus are among the most important in terms of natural biological control (De Barro et al., Reference De Barro, Hart and Morton2000; Schmidt et al., Reference Schmidt, Nauman and De Barro2001). SLW surveys and collections over several years in the main grain cropping areas of Queensland have revealed the presence of at least ten species of Encarsia and three species of Eretmocerus (table 3).
Parasitoids of Bemisia tabaci and frequency of encounters in survey collections throughout major cropping areas of Queensland, between July 1998 and June 2001. (Data Source: Dr B.A. Franzmann, Queensland Department of Primary Industries & Fisheries, Toowoomba).
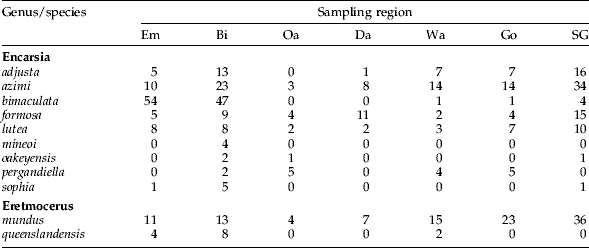
Em, Emerald; Bi, Biloela; Oa, Oakey; Da, Dalby; Wa, Warra; Go, Goondiwindi; SG, St. George.
The parasitism data leave little doubt that parasitoids are an important source of whitefly mortality in Australian cotton fields. Parasitoid activity was negligible or undetectable in cotton fields in the 2001/02 season (P. De Barro, unpublished data). In subsequent seasons, the rapid build-up of parasitoid activity in the EIA, mirrored in other cropping areas of CQ, e.g. Dawson-Callide valley (P. Grundy, personal communication), undoubtedly contributed to the post-outbreak decline and subsequent stability of SLW populations in the region.
The rapid increase in parasitism levels during the 2002/03 season can be attributed to cooler weather conditions (relative to the previous season) and a voluntary avoidance of broad-spectrum insecticides for cotton pest management (fig. 10, see below). A partial resurgence in organophosphate (OP) usage in cotton attributed to increased sucking pest and Helicoverpa spp activity, explains lower levels of parasitism in the following seasons. These results are consistent with experiences in cotton systems overseas, wherein rapid increases in natural enemy populations and associated pest mortality have been documented in IPM-friendly crop management regimes (Ellsworth & Martinez-Carrillo, Reference Ellsworth and Martinez-Carrillo2001; Naranjo, Reference Naranjo2001).
Feral host plants and unsprayed broad-leaved summer crops are not only sinks and sources of SLW at different times but also nurseries for parasitoids and other natural enemies. De Barro & Coombs (Reference De Barro and Coombsin press) noted in surveys between 1995 and 1999 that while parasitoid diversity was high, average parasitism over this period was less than 5%. In our study, parasitism was at times higher than this and suggests that local factors can contribute to wide variation in levels of parasitism. The significance of predatory arthropods for SLW population dynamics was not formally assessed in our study. Characterisation of interactions between various species of natural enemy will be important to the further understanding of their relative impacts on pest host species such as SLW.
Increased whitefly population growth rates in response to higher temperatures (Butler et al., Reference Butler, Henneberry and Clayton1983; Powell & Bellows, Reference Powell and Bellows1992; Wagner, Reference Wagner1993), combined with the negative impacts of broad-spectrum insecticides on beneficial insect populations (Abdelrahman & Munir, Reference Abdelrahman and Munir1989; Devine et al., Reference Devine, Ishaaya, Horowitz and Denholm1998; Simmons & Jackson, Reference Simmons and Jackson2000; Naranjo, Reference Naranjo2001), are likely to have provided the ecosystem pre-requisites for explosive population growth in 2001/02. Temperature and rainfall records obtained from the Australian Bureau of Meteorology indicate that the November 2001–January 2002 period was unusually warm in comparison to previous years and most parts of CQ received around 50% or less of the average rainfall and more than twice the average number of ‘hot’ days (>36°C). The use of organophosphate and pyrethroid insecticides peaked in 2001/02 (fig. 9) before dropping sharply in 2002/03 and subsequent seasons due to the voluntary action of the CQ cotton industry to minimise flaring of SLW populations.
Chemical insecticide usage (kg of active ingredient) in conventional (clear bars) and Bt cotton (hatched bars) crops in the Emerald Irrigation Area. (a) Organophosphates, (b) Pyrethroids. (Data source: Cotton Consultants Australia).

SLW has developed resistance to many commonly used agricultural insecticides, particularly the older broad-spectrum chemical groups such as OPs and pyrethroids (Palumbo et al., Reference Palumbo, Horowitz and Prabhaker2001). Only a few relatively new chemical insecticides are currently effective in the control of SLW (Ellsworth & Martinez-Carrillo, Reference Ellsworth and Martinez-Carrillo2001). Attempts to control the pest with broad-spectrum chemicals often result in flaring – increased population growth rate and ultimately more whitefly – primarily due to the negative impacts of these products on most beneficial arthropods that are normally important agents of natural mortality and population regulation (Abdelrahman & Munir, Reference Abdelrahman and Munir1989; Devine et al., Reference Devine, Ishaaya, Horowitz and Denholm1998).
From a management perspective, the data presented here indicate that sustainable regional management of SLW requires an integrated cropping system approach with a central focus on control of SLW in cotton, the main driver of SLW population dynamics, in CQ. Successful control of SLW on cotton would contribute significantly to regional management of the pest and reduction of the whitefly threat to non-cotton cropping industries in the region.
Acknowledgements
This research was funded by the Australian cotton and grains research and development organisations (CRDC and GRDC).