


INTRODUCTION
Dengue virus (DENV) belongs to family Flaviviridae, genus Flavivirus. Like all Flavivirus members, it has a single-stranded positive-sense RNA genome which encodes three structural proteins (C, prM, E) and seven non-structural proteins (NS1, NS2A, NS2B, NS3, NS4A, NS4B, NS5). Humans are usually infected by mosquito (e.g. Aedes aegypti) bite and develop self-limited febrile disease called dengue fever (DF), or potentially fatal dengue haemorrhagic fever/dengue shock syndrome (DHF/DSS). In recent decades, probably due to globalization, urbanization, human population increase and lack of effective mosquito control, four serotypes of DENV (DENV1 to DENV4) have been distributed to almost all tropical and subtropical countries and regions, with increasing numbers of humans becoming infected. It is estimated that 50–100 million infections occur annually, and more than 2·5 billion people are at risk [Reference Gubler1, Reference Gubler2].
Thailand is representative of countries where DENVs are endemic almost annually, with co-circulation of four serotypes. Since the viruses were first confirmed in 1958 [Reference Halstead3], the incidence of dengue diseases has increased markedly. From 1985 to 2006, the case load has been consistently above 10 000. In addition, there are sufficient sequences of virus strains isolated from this country; therefore, Thailand is an ideal locality to address the long-term molecular evolution of DENVs. In this study, we analysed all DENV sequences with known isolation date to elucidate co-evolution of DENVs in Thailand.
MATERIALS AND METHODS
Sequence datasets
The DENV E protein was the major antigen and was also associated with virus binding and entry. Thus, the majority of phylogenetic and evolutionary analysis of DENV had focused on the E protein [Reference Holmes4]. All complete E gene sequences were collected from GenBank (www.ncbi.nlm.nih.gov). The following criteria were used when choosing the sequences: (1) all sequences had a known date of isolation; (2) all putative recombinant sequences were excluded [Reference Holmes5–Reference Toulou7]; (3) all sylvatic strains were excluded; (4) sequences with 100% similarity were excluded. DENV strain numbers and date of isolation range were: 114 strains for DENV1 (1980–2007), 144 strains for DENV2 (1974–2006), 98 strains for DENV3 (1973–2005), and 61 strains for DENV4 (1976–2007). No recombinant DENV strains were identified in these cohorts. All sequences and alignments in this study are available from the author upon request.
Phylogenetic analysis
The TREE-PUZZLE program [Reference Schmidt8] was used to infer maximum-likelihood trees for DENV1, DENV2, DENV3, and DENV4. Trees were rooted by using strains from different serotypes.
Molecular clock and Bayesian skyline plot analysis
The rate of nucleotide substitution per site and the time to the most recent common ancestor (TMRCA) were estimated using the Bayesian Markov Chain Monte Carlo (MCMC) approach as implemented in the BEAST 1.5.3 package (http://beast.bio.ed.ac.uk) [Reference Drummond9]. The analysis was performed using the GTR+ G + &Ggr;4 substitution model under a coalescent model of constant population size. In each case, the relaxed (uncorrelated lognormal) molecular clock model was used (the relaxed clock model was favoured over the strict clock model in these datasets). A final chain length of 10 million or 20 million was employed to make an effective sample size for parameter estimates >200. The resulting convergence and the relative genetic diversity were analysed using Tracer 1.4.1 (http://evolve.zoo.ox.ac.uk). To reveal the uncertainty in the estimations, the 95% high probability density (HPD) interval in each case was also determined.
RESULTS
Phylogenetic analysis
According to our phylogenetic analysis of 114 DENV1 E gene sequences (Supplementary Fig. S1 a), all DENV1 strains consisted of two genotypes (genotypes I and III). Almost all DENV1 strains belonged to genotype I (110 strains), with the exception of four strains isolated in 1980 (ThD1_0673_80, ThD1_ 0442_80, ThD1_0127_80, ThD1_0038_83). Most notably, all genotype I strains could be divided into two distinct clades. The first clade (clade 1980–1994) consisted of 40 strains from 1980 to 1994 and the second clade (clade 1990–2007) consisted of 70 strains from 1990 to 2007.
DENV2 strains (Supplementary Fig. S1 b) consisted of three genotypes (genotype Asian I, Cosmospolitan, Asian/American). Almost all strains belonged to genotype Asian I (133 strains) except for 11 strains (CAMR14 fell into genotype Cosmospolitan and the other 10 strains fell into genotype Asian/American). One clade (clade 1983–2006), which consisted of 100 strains from 1983 to 2006, was identified in genotype Asian I. Only 21% (11/52) of strains isolated prior to 1990 fell into clade 1983–2006.
For DENV3, only two genotypes (I and II) circulated in Thailand (Supplementary Fig. S1 c). Genotype I consisted of 11 strains isolated in 2005. The remaining 87 strains fell into genotype II. One clade (clade 1991–2003), which consisted of 56 strains post-1990, was identified in genotype II, except for three strains (98901640, 98901590, 00-27-1HuNIID2000).
For DENV4, three genotypes (I, II, III) were confirmed (Supplementary Fig. S1d). All strains belonged to genotype I (55 strains), with the exception of one strain (ThD4_0734_00) in genotype II and five strains (ThD4_1270_98, ThD4_0439_01, ThD4_0476_97, ThD4_0164_99, ThD4_0017_97) in genotype III. One clade (clade 1991–2007), which consisted of 37 strains from 1991 to 2007, was identified in genotype I.
Specific mutations in each clade
In the above-mentioned clades, we found that all strains within these clades contained specific mutations in the envelope protein compared to those strains outside the corresponding clade (Table 1). Specifically, three (Asn8Ser, Val324Ile, Val351Leu), one (Asn83Lys), one (Ala479Val), and three [Val96Met, Lys203Asn(Ser), Phe461Leu] mutations were identified in DENV1-4 clades, respectively.
Substitution mutations in the envelope protein of predominant genotypes
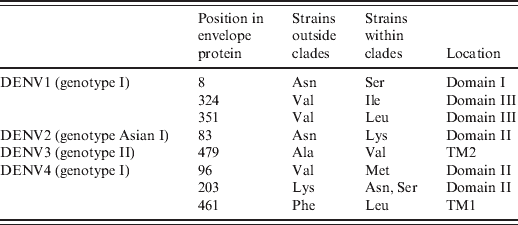
TM, Transmembrane domain.
Evolutionary rates and ancestral time analysis
Our Bayesian MCMC analysis (Table 2) revealed that overall substitution rates of DENV1 (n = 70), DENV2 (n = 100) and DENV3 (n = 56) clade datasets were between (8·5–8·7) × 10−4 substitutions/site per year. However, the rate of DENV4 clade dataset (n = 37) was markedly lower (6·4 × 10−5 substitutions/site per year). Ages of the TMRCA for each DENV clade were 31·4 (DENV1), 26·0 (DENV2), 17·1 (DENV3), and 1713·4 (DENV4) years, respectively.
Evolutionary processes on E gene of dengue viruses
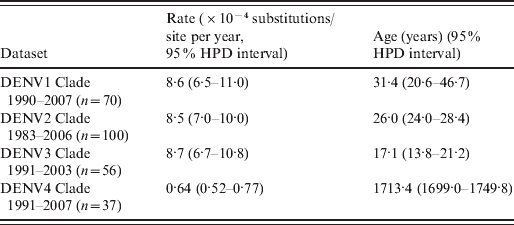
HPD, High probability density.
Estimate of genetic diversity
Bayesian skyline plot analysis (Fig. 1) indicated that the relative genetic diversity of the predominant genotype of each serotype tended to slightly increase over time followed by a stationary phase after 2000.
Bayesian skyline plot analysis of (a) DENV1, (b) DENV2, (c) DENV3, (d) DENV4. The black lines indicate the median estimates, and the shaded areas indicate the 95% high probability density intervals.

DISCUSSION
In this study we confirmed that strains of DENV2 and DENV4 post-1990 grouped into clades which were significantly different from those prior to 1990, as DENV1 and DENV3 described here and previously [Reference Zhang10]. The origin and dispersion of Flavivirus in some countries has been described previously [Reference Ospina11, Reference Chen12]. In this study, we hypothesized that DENV1–3 clades could have been introduced from other countries or evolved in situ in the late 1970s or early 1980s (DENV1, 31·4 years old; DENV2, 26·0 years old; DENV3, 17·1 years old). However, DENV4 clade appeared 1713 years ago (DENV4, 1713 years old). Because these strains harboured specific mutations, they might have improved fitness in mosquitoes (e.g. Aedes aegypti) or humans, allowing them to survive better than other strains. In fact, these specific mutations were first confirmed in the envelope protein of these strains (Table 1), e.g. Asn8 → Ser8, Val324 → Ile324, Val351 → Leu351 in DENV1 genotype I Asn83 → Lys83 in DENV2 genotype Asian I, Ala479→ Val479 in DENV3 genotype II, Val96 → Met96, Lys203 → Thr203(Ala203), Phe461 → Leu461 in DENV4 genotype I. The above-mentioned mutations were located within the important structural domains of the outer E protein (Table 1). E was believed to be mediate receptor binding, membrane fusion, and it also induced protective immunity [Reference Whitehead13]. According to the crystal structure of E protein [Reference Rey14, Reference Modis15], it consisted of three domains (domains I, II, III), followed by the stem region (H1, H2) and the transmembrane domain (TM1, TM2). Domain I was the molecular hinge region involved in low-pH-triggered conformational changes [Reference Roehrig16], domain II was involved in dimerization and membrane fusion [Reference Rey14], domain III played a role in receptor binding [Reference Rey14], and transmembrane domains were involved in virion assembly [Reference Hsieh17]. As described previously [Reference Hang18, Reference Van Slyke19], lineage replacement and point mutations often improve viral fitness, which might be why strains in these clades could be repeatedly endemic in Thailand under purifying selection [Reference Zhang10, Reference Zhang20, Reference Klungthong21] and/or immune selection [Reference Twiddy22]. Due to limited availability of full-length viral genomes, only the envelope protein was analysed in this study. Therefore, some specific mutations might also exist in non-structural proteins, other structural proteins (e.g. C and prM) and non-coding regions of these clades because some virulent sites have already been identified in these regions [Reference Bordignon23–Reference Grant25]. Certainly, DENV mutants harbouring these mutations should be constructed to validate this deduction.
The epidemiological feature of DENVs in Thailand is considerably different from those in Singapore, a neighbouring country in South East Asia, where more genotypes were co-circulating in the last decade [Reference Lee26]. The high diversity of DENVs in Singapore might be due to increased globalization in Singapore, as this country was a regional and global commercial and travel centre and therefore able to frequently exchange and import DENV through human movement.
Moreover, substitution rates of DENV1, DENV2 and DENV3 clades presented here are consistent with those described previously [Reference Zhang20, Reference Sall27]. However, the DENV4 clade evolved much more slowly (6·4 × 10−5 substitutions/site per year) than the other three clades described here and the DENV4 strains isolated in Thailand prior to 2002 [Reference Klungthong21]. In fact, the substitution rate of strains prior to 1990 (18 strains outside clade 1991–2007) in DENV4 genotype I was 1·37 × 10−3 substitutions/site per year (95% HPD interval: 0·85 × 10−3 to 1·94 × 10−3), which was 21·4 times higher than for DENV4 clade 1991–2007. The lower substitution rate showed a lower replication cycle of virus, particularly tropism, and transmission modes [Reference Gray28, Reference Hanada29]. This might be one reason that DENV4 was the least frequently circulating serotype in Thailand since 1991 [Reference Drummond9].
As shown in Figure 1, the predominant genotypes of DENV1–4 showed a similar demographic pattern in genetic diversity: several ‘invasion’ phases followed by a ‘stationary’ phase which started from 2000. The ‘invasion’ phase was characterized by an increase in the genetic diversity of DENV. Markedly, apparent ‘invasion’ phases (1994 for DENV1, 1985 for DENV2, 1992 for DENV3, 1991 for DENV4) appeared just after the time of the first isolated strain in each DENV clade (1990 for DENV1, 1983 for DENV2, 1991 for DENV3, 1991 for DENV4), which suggested that new strains in DENV1–4 clades began to be responsible for the local dengue outbreak. Consistent with such a fact: DENV1 clade 1990–2007, DENV2 clade 1983–2006, DENV3 clade 1991–2003, and DENV4 clade 1991–2007 were predominant from 1994, 1985, 1992, and 1991, respectively. However, there were only four strains in DENV1 clade 1990–2007 but 15 strains outside this clade from 1990 to 1993 (Supplementary Fig. S1 a); there were only three strains in DENV2 clade 1983– 2006 but eight strains outside this clade from 1983 to 1984 (Supplementary Fig. S1 b); and there was one strain in DENV3 1991–2003 and one strain outside this clade in 1991 (Supplementary Fig. S1 c). Because strains in DENV1–4 clades had improved fitness in hosts (humans and mosquitoes), they survived better than other strains and were predominant so that the genetic diversity remained constant after 2000.
In summary, clade replacements in DENV1–4 took place in strains isolated in Thailand. The DENV strains in the new clades harbour specific mutations in the E protein and are responsible for local dengue epidemics post-1990.
SUPPLEMENTARY MATERIAL
For supplementary material accompanying this paper visit http://dx.doi.org/10·1017/S0950268812000908.
DECLARATION OF INTEREST
None.



