Introduction
In the latter half of the twentieth century, maritime Antarctica was one of the most rapidly warming regions on Earth, with rises in surface air temperatures of 1–3°C being recorded between the 1950s and late 1990s (Adams et al. Reference Adams, Arthern, Atkinson, Barbante, Bargagli, Bergstrom, Turner, Bindschadler, Convey, di Prisco, Fahrbach and Gutt2009). Although this warming trend slowed at around the turn of the millennium (Turner et al. Reference Turner, Lu, White, King, Phillips and Hosking2016), climate models forced with only moderate greenhouse gas emission scenarios predict further rises in surface air temperatures of 2–4°C in maritime Antarctica by 2100 (Bracegirdle et al. Reference Bracegirdle, Connolley and Turner2008, Bracegirdle & Stephenson Reference Bracegirdle and Stephenson2012). The effects of these changes in air temperature in the maritime Antarctic physical environment are well established, with further ice-shelf disintegration and glacial recession being almost inevitable as the region warms (Fox & Cooper Reference Fox and Cooper1998, Cook et al. Reference Cook, Fox, Vaughan and Ferrigno2005, Adams et al. Reference Adams, Arthern, Atkinson, Barbante, Bargagli, Bergstrom, Turner, Bindschadler, Convey, di Prisco, Fahrbach and Gutt2009). However, the effects of rising air temperatures on the flora and fauna of maritime Antarctic terrestrial ecosystems are much less well defined. To date, research suggests that warming will give rise to expansions in vascular plant and bryophyte populations (Royles et al. Reference Royles, Amesbury, Convey, Griffiths, Hodgson, Leng and Charman2013, Amesbury et al. Reference Amesbury, Roland, Royles, Hodgson, Convey, Griffiths and Charman2017), more frequent biological invasions (Hughes et al. Reference Hughes, Pescott, Peyton, Adriaens, Cottier-Cook and Key2020) and changes to soil microbial diversity and edaphic factors (Newsham et al. Reference Newsham, Hopkins, Carvalhais, Fretwell, Rushton, O'Donnell and Dennis2016, Horrocks et al. Reference Horrocks, Newsham, Cox, Garnett, Robinson and Dungait2020).
Despite these anticipated effects, the influence of rising air temperatures on maritime Antarctic soil animals are presently not well defined. In particular, there are conflicting reports on the responses to warming of nematodes, which are typically the most abundant animals in maritime Antarctic soils and have central roles in the simple terrestrial food webs of the region (Spaull Reference Spaull1973, Maslen Reference Maslen1981). A previous experiment on Alexander Island in the southern maritime Antarctic indicated that warming the soil surface with screens led to orders of magnitude increases in nematode community density after 12–13 months of treatment, with the genus Plectus accounting for the majority of the community in warmed soil (Convey & Wynn-Williams Reference Convey and Wynn-Williams2002). However, a subsequent sampling of the same experiment after three years indicated diminished effects of screens on community density, with increases of only a few fold in nematode abundances compared with control soils (Convey Reference Convey, Huiskes, Gieskes, Rozema, Schorno, van der Vies and Wolff2003). In contrast, a separate study on King George Island in the South Shetland Islands indicated no effects of warming with open-top chambers (OTCs) after eight years on nematode community density in cores taken from two moss species (Prather et al. Reference Prather, Casanova-Katny, Clements, Chmielewski, Balkan and Shortlidge2019). There is thus a current lack of clarity regarding how nematode communities and populations will respond to warming in maritime Antarctica.
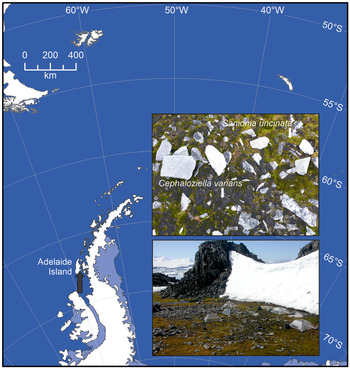
Here, we report a three year study designed to measure the effects of warming with OTCs in the natural environment on the abundances of nematodes associated with two widespread maritime Antarctic bryophytes, the leafy liverwort Cephaloziella varians (Gottsche) Steph. and the moss Sanionia uncinata (Hedw.) Loeske. In addition to testing for the main effects of OTCs on community and population densities, we tested for the interactive effects of OTCs and bryophyte species on nematode abundance. We hypothesized that the higher temperatures that are reached during summer in sun-exposed mats of C. varians, which are black in colour owing to the synthesis of riccionidin A (Snell et al. Reference Snell, Kokubun, Griffiths, Convey, Hodgson and Newsham2009), would amplify the effects of warming on nematodes compared with those associated with mats of S. uncinata, which are light green in colour (Fig. 1, upper inset) and consequently do not heat to the same extent as the liverwort (Newsham Reference Newsham2010).
Map showing the position of Rothera Point (arrow) on Adelaide Island in the maritime Antarctic. The upper inset shows mats of the moss Sanionia uncinata and the leafy liverwort Cephaloziella varians at Rothera Point. The lower inset shows the warming experiment, consisting of five control plots and five plots covered with open-top chambers.

Methods
The warming experiment was set up on 16 February 2007 at Rothera Point on Adelaide Island in the maritime Antarctic (Fig. 1) in a vegetated gully (67°34.429′S, 68°07.284′W) permanently hydrated by meltwater from a nearby snowbank during summer (Fig. 1, lower inset). The experiment consisted of five control plots and five treated plots covered with OTCs, which were constructed from 3 mm-thick UV-transparent PMMA Plexiglas (GS2458, Röhm GmbH & Co., Darmstadt, Germany) and had upper and lower apertures of 0.10 and 0.37 m2, respectively (Fig. S1a). Contrary to previous reports (Bokhorst et al. Reference Bokhorst, Huiskes, Convey, Sinclair, Lebouvier, van de Vijver and Wall2011, Reference Bokhorst, Huiskes, Aerts, Convey, Cooper and Dalen2013), snow did not accumulate in OTCs during winter (Fig. S1b). On 16 February 2007, 17 March 2007, 10 April 2007, 12 January 2008, 18 March 2008, 16 January 2010, 15 February 2010 and 17 March 2010, four samples each of C. varians and S. uncinata mats (each measuring ~10 mm × 10 mm in area, cut down to the bedrock ~10–20 mm below the mats) were collected from each plot into clean plastic bags. Permanent ice cover precluded sampling in the summer of 2008–09. Directly after collection, the four samples from each plot were taken to a laboratory at the nearby Rothera Research Station, where the method of Hooper (Reference Hooper and Southey1986) was used to extract nematodes from the bryophytes. The four samples of liverwort or moss from each plot were combined, wrapped in a single ply of pre-weighed clean tissue paper and placed onto a stainless steel mesh in the mouth of a funnel with a tube attached to its neck, to which a clip had been added. The funnels were mounted in a retort stand and water was added so that it just covered the samples, which were left in the dark at ~13°C. After 65 h, the clip was released and the water was run off from each funnel into a 50 ml-capacity tube, which was left undisturbed at 4°C for 24 h. The supernatant was then pipetted off, leaving soil animals in ~1 ml of water, to which hot (65°C) fixative, consisting of 4% formaldehyde and 2% glycerol in water, was added. The bryophyte sample and tissue paper were dried at 80°C for 48 h, cooled over desiccant and weighed, with dry plant biomass subsequently being calculated, accounting for the weight of the paper.
The fixed nematodes, which had been returned to the UK at room temperature, were examined at up to ×400 magnification using an inverted microscope, with ×1000 magnification under a compound microscope being used when greater detail was required. Nematodes were identified to genus or species levels based on morphological and morphometric features from the original formal descriptions of the taxa (see Maslen & Convey Reference Maslen and Convey2006). The total number of nematodes in each sample, along with the numbers of males, females and juveniles of each species, as well as the numbers of gravid females of each species and the number of eggs in gravid females at the samplings in the summers of 2007–08 and 2009–10, were recorded. In total, 23 559 nematodes were recovered from the bryophytes over the eight samplings. The most abundant species was Plectus belgicae de Man, with 14 618 individuals recovered. Rhyssocolpus paradoxus (Loof) Andrássy was the next most frequent species (6660), followed by Coomansus gerlachei (de Man) Jairajpuri & Khan (744), Eudorylaimus spp. (727), an unidentified species of Plectus (496), Plectus antarcticus de Man (179) and Aphelenchoides haguei Maslen (134). A single individual of Laimaphelenchus helicosoma Maslen was also recovered.
The temperatures of C. varians and S. uncinata were measured by inserting button loggers (SL51 Smart Button Logger, Status Instruments, Tewkesbury, UK) at depths of ~10 mm into mats of each species in control and chambered plots. Temperature data were recorded every 3 h between 16 February 2007 and 29 November 2008. Loggers were repeatedly removed from the mats by inquisitive south polar skuas (Stercorarius maccormicki), with multiple loggers having to be deployed in order to generate continuous runs of data. Although mat temperatures were not measured in the summer of 2009–10, air temperature, relative humidity and cloud cover recorded ~150 m from the experiment, which each correlated significantly with mat temperatures (Fig. S2a–c), were similar in the summers of 2006–07, 2007–08 and 2009/10 (Fig. S2d–f), and it thus follows that mat temperatures would also have been similar during the three summers. In support of this view, measurements in the summer of 2010–11, after the experiment reported here had been terminated, indicated that there were similar effects of OTCs on the temperatures of C. varians and S. uncinata mats to those reported below (K.K. Newsham, unpublished data 2011).
The moisture concentrations of bryophyte mats were measured on 24 November 2007, 7 December 2007, 28 November 2009 and 15 December 2009, when four samples of C. varians and S. uncinata, each measuring ~10 mm × 10 mm in area, were collected from each plot into clean plastic bags. The bags were sealed and taken to the laboratory on Rothera Point, where the bryophyte tissues were immediately weighed, dried at 80°C for 48 h, cooled over desiccant and reweighed. As for mat temperatures, the moisture concentrations of the C. varians and S. uncinata mats measured in the summer of 2013–14, after the experiment reported here had ended, were similar to those reported below (K.K. Newsham, unpublished data 2014).
Statistical analyses
The numbers of individuals of each nematode taxon and of total nematodes were calculated per gram dry weight (dwt) of bryophyte mat. The values were log10(n + 1) transformed and were subjected to Kolmogorov-Smirnov tests, which indicated normally distributed data for total nematodes and for P. belgicae, the most abundant species. Further statistical analyses hence focused on the population density of this species (i.e. the number of P. belgicae individuals g-1 dwt mat) and community density (i.e. the total number of nematode individuals of all taxa g-1 dwt mat). These data were analysed using repeated-measures analysis of variance (ANOVA), with OTC and bryophyte species as fixed factors, plot and sampling as random factors and plot being nested in treatment. The analyses tested for the effects of OTCs on the abundances of different life stages and sexes of P. belgicae, with regression models also being fitted to test for differences in the rates of change in abundances between OTCs and control plots. Two-way ANOVA was also used to analyse the effects of OTCs and bryophyte species on community and population densities at individual samplings. Differences in mat temperatures between control plots and OTCs and between bryophyte species were determined with paired t-tests. In addition, repeated-measures ANOVA was used to test the main and interactive effects of OTCs and bryophyte species on the moisture concentrations of mats. All statistical analyses were performed in MINITAB 18.1 (MINITAB, Inc., State College, PA, USA).
Results
Bryophyte temperatures
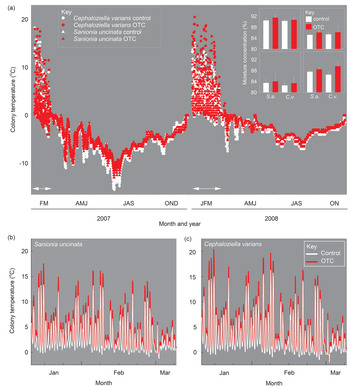
OTCs principally heated bryophytes during summer, when ice and snow cover over plants had melted (Fig. 2a). The chambers heated the moss and the liverwort to different extents during this season: analyses of temperatures measured between early January and early March 2008 showed that they increased mean daily temperatures of S. uncinata mats by on average 1.0°C (t(60) = 31.2, P < 0.001), with a maximum difference in temperature between chambered and control plots of 4.1°C and maximum temperatures in mats of the moss in OTCs and control plots of 17.5°C and 13.4°C, respectively (Fig. 2b). In contrast, analyses of mean daily temperatures measured in C. varians mats during this period indicated that OTCs heated the liverwort by 1.1°C (t(60) = 33.1, P < 0.001), with up to a 5.4°C difference in temperature between mats in chambered and control plots and maximum temperatures of C. varians measured in these plots during this period of 20.4°C and 16.3°C, respectively (Fig. 2c). The mean daily temperatures of S. uncinata and C. varians mats between early January and early March 2008 were 3.2°C and 3.5°C, respectively (t(60) = 6.9, P < 0.001).
Temperatures in control plots and open-top chambers (OTCs) of a. Sanionia uncinata and Cephaloziella varians mats between 16 February 2007 and 29 November 2008 and b. S. uncinata and c. C. varians mats between 11 January and 8 March 2008. Horizontal arrows in a. denote the periods when mats were free of snow and ice. The insets in a. show the moisture concentrations of S. uncinata and C. varians mats on 24 November 2007 (top left), 7 December 2007 (top right), 28 November 2009 (bottom left) and 15 December 2009 (bottom right).

Bryophyte moisture concentrations
Moisture concentrations of mats at four samplings ranged between 82.6% and 91.5% (Fig. 2a, insets). Analyses using repeated-measures ANOVA across the four samplings indicated no effects of OTCs or bryophyte species, or interactions between these two factors, on the moisture concentrations of S. uncinata or C. varians mats (both F 1,64 < 2.70, P > 0.140). Similarly, two-way ANOVA at each of the four samplings showed no effects of OTCs or bryophyte species, or OTC × bryophyte species interactions, on mat moisture concentrations (all F 1,15 < 3.52, P > 0.080).
Nematode community density
Repeated-measures ANOVA indicated that OTCs did not affect nematode community density over the course of the experiment (F 1,122 = 1.78, P = 0.219). However, two-way ANOVA showed that OTCs increased community density by five- to eight-fold at the final sampling in March 2010, with mean (± standard error of the mean; SEM) abundances in control plots and OTCs of 82 (± 41) and 488 (± 280) individuals (ind.) g-1 dwt in mats of C. varians and 161 (± 80) and 1434 (± 753) ind. g-1 dwt in those of S. uncinata, respectively (F 1,16 = 13.54, P = 0.002) (Fig. 3). The larger community density in OTCs at the final sampling was owing to 8- to 12-fold increases in the abundances of the genus Plectus extracted from the mats of both bryophytes relative to control plots (Fig. 3).
Mean abundances of nematode taxa extracted from mats of a. & b. Cephaloziella varians and c. & d. Sanionia uncinata sampled from a. & c. control plots and b. & d. open-top chambers (OTCs) at eight samplings. Note that the y-axes are scaled identically for each bryophyte species and that the nematode taxa are stacked in the columns in the same order as they are in the key (see inset in a.).

Plectus belgicae population density
Repeated-measures ANOVA indicated a significant main effect of OTCs on P. belgicae population density over the duration of the experiment (F 1,122 = 14.12, P = 0.006). Across all samplings, life stages and sexes, there was a six-fold increase in the population density of this species, from a mean (± SEM) of 30.2 (± 11.3) ind. g-1 dwt in control plots to 213.5 (± 83.0) ind. g-1 dwt in OTCs. Warming affected males and females to similar extents, with OTCs eliciting four- to five-fold increases in the abundances of each sex over the course of the experiment, with means (± SEM) in control plots and OTCs of 0.3 (± 0.2) ind. g-1 dwt and 1.9 (± 0.6) ind. g-1 dwt for males and 6.1 (± 1.5) ind. g-1 dwt and 30.1 (± 8.1) ind. g-1 dwt for females (F 1,122 = 14.07, P = 0.006 and F 1,122 = 31.40, P < 0.001, respectively). There was also a strong effect of OTCs on juvenile P. belgicae over the experiment's duration, with a seven-fold increase in their abundances, from 23.8 (± 10.0) to 181.4 (± 75.2) ind. g-1 dwt in control and OTC plots, respectively (F 1,122 = 16.64, P < 0.004). Analyses of data from the summers of 2007–08 and 2009–10 using repeated-measures ANOVA similarly indicated that OTCs significantly increased the abundances of gravid P. belgicae by six-fold, from 2.1 (± 0.6) to 14.7 (± 6.9) ind. g-1 dwt in control and OTC plots, respectively (F 1,103 = 24.21, P = 0.001). The mean number of eggs in each gravid female was 1.09, and so similar effects of OTCs were recorded on the abundances of eggs (F 1,103 = 23.80, P = 0.001).
The effects of OTCs on the abundances of the different sexes and life stages of P. belgicae increased over the course of the experiment, with no effects at any of the samplings in 2007, but increasingly strong effects from 2008 onwards (Fig. 4). Over the course of the experiment, the abundances of male, female and juvenile P. belgicae increased in OTCs, but not in control plots, with 2- to 17-fold increases in the abundances of all three classes in the liverwort or moss at the last three samplings in 2010 (Fig. 4a–f). Regression analyses confirmed that the rates of change in the abundances of males, females and juveniles of the species were faster in OTCs than in control plots, with significant OTC × time interactions being recorded for both sexes and juveniles in liverwort and moss mats (F 1,76 > 7.26, all P < 0.009). A significant OTC × time interaction was similarly recorded for the abundance of gravid female P. belgicae extracted from C. varians (F 1,56 = 7.87, P = 0.007 (Fig. 4c, inset), but not for those extracted from S. uncinata (F 1,56 = 1.00, P = 0.323) (Fig. 4d, inset).
Abundances of a. & b. male, c. & d. female and e. & f. juvenile Plectus belgicae extracted from a., c. & e. Cephaloziella varians and b., d. & f. Sanionia uncinata from control plots (white circles) and open-top chambers (OTCs; red circles) at eight samplings. The insets in c. & d. show abundances of gravid females extracted from C. varians and S. uncinata at five samplings. The inset in f. shows the abundances of juveniles extracted from S. uncinata at three samplings. Values are means of five replicates ± standard error of the mean (SEM), with negative and positive SEM shown for control plots and OTCs, respectively. Significant differences between values in OTCs and control plots are marked as *P < 0.05 and ***P < 0.001. Note that the y-axes are not scaled identically.

The main effect of bryophyte had no effect on the population density of P. belgicae, with mean (± SEM) population densities over the duration of the experiment of 167 (± 73) and 47 (± 17) ind. g-1 dwt in S. uncinata and C. varians mats, respectively (F 1,122 = 1.96, P = 0.164). The OTC × bryophyte interaction similarly had no effect on the population density of the species (F 1,122 = 1.58, P = 0.211).
Discussion
The experiment reported here showed strong effects of warming for 37 months in the natural environment on the densities of P. belgicae populations associated with a widespread maritime Antarctic moss and leafy liverwort. It hence broadly corroborates a previous study into the effects of warming on soil nematode populations at Mars and Ares oases on Alexander Island, 500 km south of Rothera Point, which found two to three orders of magnitude increases in total nematode community density after 12–13 months of warming, with 96–98% of nematodes in warmed soil belonging to the genus Plectus (Convey & Wynn-Williams Reference Convey and Wynn-Williams2002). However, in contrast to the observations here, which indicated strong cumulative effects of OTCs on P. belgicae populations over three years, a subsequent sampling of the same experiment, also after three years, showed diminished effects of the warming treatment on total nematode community density, with the treatment increasing the abundances of nematodes by approximately three-fold (Convey Reference Convey, Huiskes, Gieskes, Rozema, Schorno, van der Vies and Wolff2003). This difference in response to the treatment between samplings was ascribed to possible interactions between Plectus spp. and other members of the nematode community after three years of warming (Convey Reference Convey, Huiskes, Gieskes, Rozema, Schorno, van der Vies and Wolff2003). Despite the differences in the timings and magnitudes of the treatment effects between the experiments on Adelaide Island and Alexander Island, neither are corroborated by the results of a study on King George Island, which found no effects of warming with OTCs for 8 years on the abundances of total nematodes extracted from cores of the mosses Polytrichastrum alpinum and Sanionia georgicouncinata (Prather et al. Reference Prather, Casanova-Katny, Clements, Chmielewski, Balkan and Shortlidge2019). At present, it is unclear why the nematode community on King George Island failed to respond to the warming treatment, particularly in light of the positive effect of OTCs on the abundance of springtails and mites in moss cores (Prather et al. Reference Prather, Casanova-Katny, Clements, Chmielewski, Balkan and Shortlidge2019).
Although warming enhances the metabolic rates of maritime Antarctic terrestrial fauna and flora, resulting in increased biomass and reproduction (Convey & Wynn-Williams Reference Convey and Wynn-Williams2002, Convey et al. Reference Convey, Pugh, Jackson, Murray, Ruhland, Xiong and Day2002, Convey Reference Convey, Huiskes, Gieskes, Rozema, Schorno, van der Vies and Wolff2003, Day et al. Reference Day, Ruhland, Strauss, Park, Krieg, Krna and Bryant2009, Prather et al. Reference Prather, Casanova-Katny, Clements, Chmielewski, Balkan and Shortlidge2019), its effects are superseded by water availability (Kennedy Reference Kennedy1993). Soil moisture concentrations can be influenced by OTCs, either through increased evaporation from chambered plots during summer or through the accumulation of snow in chambers during winter, confounding the interpretation of data from field warming experiments in polar and alpine regions (Bokhorst et al. Reference Bokhorst, Huiskes, Convey, Sinclair, Lebouvier, van de Vijver and Wall2011, Reference Bokhorst, Huiskes, Aerts, Convey, Cooper and Dalen2013). However, the majority of the OTC treatment effects reported here can be ascribed to the increased moss and liverwort mat temperatures recorded in chambers during summer, as mat moisture concentrations did not differ between control plots and OTCs at four samplings, most probably owing to the proximity of a large snowbank, meltwater from which hydrated plants throughout the summer. In addition, no evidence was found here for snow accumulation in OTCs during winter, which, as well as increasing soil temperatures during this season, influences the moisture concentrations of soil and vegetation during late spring and early summer (Bokhorst et al. Reference Bokhorst, Huiskes, Convey, Sinclair, Lebouvier, van de Vijver and Wall2011, Reference Bokhorst, Huiskes, Aerts, Convey, Cooper and Dalen2013).
Positive responses to warming with OTCs are typically recorded under adequately hydrated conditions. For example, in experiments on Anvers Island, strong interactive effects of warming and water application were found on the abundance of the springtail Cryptopygus antarcticus in soils that had been warmed and watered for two years, with two- to ten-fold increases in its abundance relative to control soils, and smaller (up to one-fold) main effects of the two treatments (Day et al. Reference Day, Ruhland, Strauss, Park, Krieg, Krna and Bryant2009). Similarly, the positive response of P. belgicae to warming reported here can most probably be attributed to enhanced metabolism and reproduction under high water availability, with moisture concentrations of 83–92% being measured in bryophyte mats. In contrast, studies in the McMurdo Dry Valleys in continental Antarctica have shown negative effects of warming with OTCs on the population densities of the nematode Scottnema lindsayae, with 42% reductions in the abundance of individuals in chambered relative to control soils over 8 years of treatment (Simmons et al. Reference Simmons, Wall, Adams, Ayres, Barrett and Virginia2009). At present, it is unclear why S. lindsayae does not respond positively to warming, but it is possible that the much lower moisture concentrations of soils in the McMurdo Dry Valleys of 0.3–0.5% (Simmons et al. Reference Simmons, Wall, Adams, Ayres, Barrett and Virginia2009) may constrain the responses of its populations to warming.
Other than enhanced metabolic rates associated with higher temperatures under high water availability, what factors might be responsible for the effects of warming on the population densities of soil- and bryophyte-associated Plectus populations in maritime Antarctica? As previously suggested (Convey & Wynn-Williams Reference Convey and Wynn-Williams2002), one possibility is that warming stimulates microbial growth in soils and vegetation, with studies using OTCs on Anchorage Island, 5 km from Rothera Point, reporting an approximate order of magnitude increase in the abundance of bacterial ribosomal RNA genes in warmed vegetated soils following three years of treatment (Yergeau et al. Reference Yergeau, Bokhorst, Kang, Zhou, Greer, Aerts and Kowalchuk2012). As maritime Antarctic Plectus spp. are microbivores, selectively feeding on bacteria and unicellular algae (Newsham et al. Reference Newsham, Rolf, Pearce and Strachan2004), increases in their population densities in warmed soils and vegetation may arise from the enhanced availability of microbial prey. However, the apparently exclusive effects of the warming treatment on P. belgicae may simply have been owing to it being the most abundant species in the community, as Plectus spp. were in the previous study on Alexander Island (Convey & Wynn-Williams Reference Convey and Wynn-Williams2002, Convey Reference Convey, Huiskes, Gieskes, Rozema, Schorno, van der Vies and Wolff2003), with the failure of less abundant species to meet assumptions of normality precluding their inclusion in statistical analyses.
In agreement with previous observations (Newsham Reference Newsham2010), the OTCs used here warmed the tissues of C. varians and S. uncinata to different extents during summer, with peak temperatures measured in chambers of 20.4°C and 17.5°C, respectively, and maximum differences in temperature between chambered and control plots of 5.4°C and 4.1°C in mats of the liverwort and the moss, respectively. Despite these differences, there was no evidence to support our hypothesis that the higher temperatures reached in C. varians mats affected the abundances of nematodes associated with the liverwort (either positively or negatively), with no interactive effect of OTCs and bryophyte species on P. belgicae population densities being identified. Thus, although nematode metabolism responds positively to warming below optimum cardinal temperatures (Ferris et al. Reference Ferris, Lau and Venette1995), it is apparent that the higher temperatures that were reached in chambered mats of C. varians compared with in those of S. uncinata were insufficient to alter P. belgicae population density. Furthermore, although a temperature of 15°C applied constantly for 10–11 weeks inhibits the reproduction of S. lindsayae isolated from continental Antarctic soils (Overhoff et al. Reference Overhoff, Freckman and Virginia1993), it is evident that temperatures of 15–20°C, which were reached regularly in chambered C. varians mats during the summer at Rothera Point, did not adversely affect nematode community or population densities.
Despite the apparent current hiatus in the warming of maritime Antarctica (Turner et al. Reference Turner, Lu, White, King, Phillips and Hosking2016), climate models forced with moderate greenhouse gas emission scenarios predict rises in surface air temperatures of 2–4°C in the region before 2100 (Bracegirdle et al. Reference Bracegirdle, Connolley and Turner2008, Bracegirdle & Stephenson Reference Bracegirdle and Stephenson2012). Given that the effects of warming recorded in the present study arose from mean increases of only 1.0–1.1°C in bryophyte temperatures during summer, it seems probable that the densities of Plectus populations in hydrated soils and vegetation in maritime Antarctica could alter over the next few decades if surface air temperatures in the region continue to rise. Owing to the abundance of this nematode genus in maritime Antarctica and its prominent role as a consumer in the simple soil food webs of the region (Spaull Reference Spaull1973, Maslen Reference Maslen1981, Newsham et al. Reference Newsham, Rolf, Pearce and Strachan2004), it seems probable that such increases in its population densities could have widespread effects on the abundances of its microbial prey. Given the measurable effects of nematodes on carbon cycling in Antarctic soils (2–7% of heterotrophic carbon flux) (Barrett et al. Reference Barrett, Virginia, Wall and Adams2008), it is plausible that such effects might also have wider impacts on soil carbon cycling. Further research is required to identify such impacts.
Supplementary material
Two supplemental figures will be found at https://doi.org/10.1017/S0954102020000528.
Acknowledgements
Matthew von Tersch collected and processed samples in 2010, Steve Colwell supplied the data shown in Fig. S2 and Laura Gerrish drew the map for Fig. 1. Pete Convey and two anonymous reviewers provided helpful comments on the manuscript.
Author contributions
RJH set up and maintained the field experiment, NRM counted and identified nematodes and KKN analysed the data and wrote the manuscript.
Financial support
Funding for the field experiment was provided by the Natural Environment Research Council (NERC) through the British Antarctic Survey's Long Term Monitoring and Survey Programme. KKN is supported by NERC core funding to BAS's ‘Biodiversity, Evolution and Adaptation’ team.
Details of data deposit
Data supporting this article are lodged in the UK Polar Data Centre (https://doi.org/10.5285/B7BAEB38-311B-439E-B94B-6C90D7DC749D).