


Introduction
Empirical studies and journalistic accounts suggest that the escalation of the Syrian civil war, rising sectarian violence in Iraq, and the Saudi-led intervention in Yemen have been marked by a proliferation of harmful rhetoric online, especially anti-Shia hate speech (Abdo Reference Abdo2013; Zelin and Smyth Reference Zelin and Smyth2014).Footnote 1 Anti-Shia hate speech, or language that frames members of a religious outgroup as apostates, false Muslims, or infidels, has become more widespread—among clerics, fighters on the ground, and everyday citizens alike (Abdo Reference Abdo2015). The popularization of sectarian hate speech is especially visible online, where extremist voices are elevated and viral content spreads instantaneously. This content transcends national borders in real time, amplifying tensions and globalizing hostile sectarian discourse (Siegel Reference Siegel2015; Wehrey Reference Wehrey2013).
At first glance, online hate speech might appear relatively inconsequential in the face of rising regional instability and mounting battlefield casualties, but such discourse can play a key role in mobilizing intergroup conflict. Intergroup conflict is more likely to occur and spread when groups have the opportunity to publicly express shared grievances and coordinate collective action (Cederman, Wimmer, and Min Reference Cederman, Wimmer and Min2010; Weidmann Reference Weidmann2009). Recent research suggests that digital technology reduces barriers to collective action among ingroup members by improving access to information, increasing the likelihood of conflict and accelerating its spread across borders (Bailard Reference Bailard2015; Pierskalla and Hollenbach Reference Pierskalla and Hollenbach2013; Weidmann Reference Weidmann2015). Moreover, while hate speech is just one of many factors that interact to mobilize intergroup conflict, it plays a particularly potent role in intensifying feelings of hate in mass publics (Gagliardone Reference Gagliardone2014; Vollhardt et al. Reference Vollhardt, Coutin, Staub, Weiss and Deflander2007). Recognizing the importance of online hate speech as an early warning sign of ethnic violence, databases of multilingual hate speech are increasingly used by governments, policy makers, and nongovernmental organizations to detect and predict political instability, violence, and even genocide (Gagliardone Reference Gagliardone2014; Gitari et al. Reference Gitari, Zuping, Damien and Long2015a; Tuckwood Reference Tuckwood2014). More generally, hate speech is an extreme form of intolerant rhetoric. In contrast to merely “uncivil” rhetoric, it is considered to be particularly harmful for intergroup relations and politics (Boatright et al. Reference Boatright, Shaffer, Sobieraj and Young2019; Rossini Reference Rossini2018).
The popularity of sectarian hate speech in the Arab online sphere is troubling from a policy perspective, given the role that this rhetoric has played in recruitment efforts by extremist groups, who seek to exacerbate intergroup tensions to achieve their goals. As unprecedented numbers of foreign fighters traveled to Iraq and Syria to join the Islamic State, western and Arab governments became increasingly concerned with the power of online narratives and tools that facilitated recruitment on such a large scale (Benmelech and Klor Reference Benmelech and Klor2016; Bora Reference Bora2015). While often neglected by policy makers, sectarian hate speech is an important component in radicalization and extremist mobilization strategies on and offline (Gerges Reference Gerges2014; Matthiesen Reference Matthiesen2015; Siegel and Tucker Reference Siegel and Tucker2018; Smith Reference Smith2015).
A growing body of literature has explored the causes, dynamics, consequences, and detection methods of online hate speech and political incivility.Footnote 2 However, much less is known about what kinds of interventions might be most effective for combating the spread of online hate. The majority of studies addressing this topic have assessed the efficacy of policies banning, punishing, or deleting hateful content online,Footnote 3 but they do not explore what interventions might reduce support for or willingness to spread such rhetoric in the first place.Footnote 4
Seeking to gain a better understanding of what types of interventions are most effective for reducing the spread of sectarian hate speech online—and support for this rhetoric more broadly—we conduct an online experiment across the Arab Twittersphere and a nationally representative survey experiment in Lebanon. In particular, we explore whether messages priming a common national identity or common religious identity—with and without eliteFootnote 5 endorsements—reduce support for and the use of hostile anti-outgroup language.
In the first experiment, we use a sockpuppet, a Twitter account that we create and control, to tweet a variety of counter-speechFootnote 6 messages at Arab Twitter users who regularly tweet sectarian content. Our sockpuppet, which appears to be an average Sunni Twitter user from the Arabian Gulf, replies to Twitter users who have recently tweeted anti-Shia content with one of five randomly assigned messages. The first four messages sanction Twitter users for using sectarian slurs and include one of the following primes:Footnote 7 (1) common Muslim religious identity, (2) common Arab national identity, (3) common Muslim religious identity with an endorsement from religious elites, or (4) common national identity with an endorsement from political elites. In the fifth treatment condition, users receive a sanctioning message that does not contain a prime, allowing us to assess whether the experience of being confronted alone is sufficient to change behavior. A sixth set of users are assigned to a control group and receive no message at all. While most of our treatments have null effects, we find that messages priming a common religious identity, with an endorsement from religious elites, are the most consistently effective in decreasing the spread of sectarian hate speech in the Arab Twittersphere. These effects persist one month after treatment. Exploratory analysisFootnote 8 suggests that these effects are particularly strong for Twitter users who have fewer friends in their networks who regularly tweet sectarian content and Twitter users that have lower numbers of followers and may have been more likely to see and pay attention to our treatments.Footnote 9
While our Twitter experiment goes directly to the source and tests the real-time effect of counter-speech messages on individuals who regularly produce online hate speech, it does not tell us anything about how our interventions might affect the millions of individuals who may be incidentally exposed to or influenced by sectarian hate speech in the online sphere. To evaluate how our counter-speech interventions might affect everyday citizens who may indirectly or directly encounter online hate speech, we also test our messages on a sample of Arab citizens of all sectarian backgrounds. Specifically, we conduct a nationally representative survey experiment in Lebanon, a country with a diverse confessional makeup.Footnote 10 After receiving a message priming a common religious identity or a common national identity—with or without an elite endorsement—our survey respondents were asked to rate a series of sectarian (anti-outgroup) tweets and counter-sectarian (promoting positive intergroup relations) tweets from the Arab Twittersphere. They assessed how favorably they felt towards each message and its author, and indicated the likelihood that they would share the message themselves if they had encountered it on social media. In this way, our survey experiment enables us to assess how a representative sample of citizens who are incidentally exposed to online hate speech might react to our counter-speech interventions. In line with the results of the Twitter experiment, the elite-endorsed common-religious-identity prime produced the lowest favorability ratings of sectarian or anti-outgroup tweets and the highest levels of support for counter-sectarian messages, or those promoting positive intergroup relations among Lebanese citizens.
By testing the relative effectiveness of several counter-speech interventions in decreasing the spread of anti-outgroup hate speech both among real-world producers of online hate speech and among a representative sample of citizens who were exposed to such language, this study contributes to our understanding of strategies to reduce hate speech and prejudicial behavior more generally. Our consistent finding that messages endorsed by religious elites are most effective offers suggestive evidence of the potential for religious elites to play a mitigating role in the public expression of anti-outgroup hostility.
This work also delivers perspective on the mechanisms by which counter-speech interventions might reduce online hate speech.Footnote 11 The results of the Twitter experiment suggest that simply receiving a sanctioning message may lead individuals to tweet less sectarian content—particularly for those who do not regularly see sectarian hate speech in their networks. When people are criticized and alerted to social norms, they may avoid engaging in deviant behavior. Similarly, the results of our survey experiment provide preliminary evidence that Lebanese citizens who incidentally observe hate speech are especially disinclined to express support for such messages if they are concerned with appearing prejudiced. Taken together, our results suggest the potential for religious elites to reduce online hate speech, indicate that counter-speech interventions may work not only on producers of hate speech but also on those who may be incidentally exposed to it, and demonstrate that counter-speech can be effective even under conditions of ongoing regional intergroup conflict.
Theoretical Motivation and Expectations
Sectarianism Defined
From a social psychological perspective, sectarianism can be defined as pro-ingroup bias based on affiliation to a particular confessional or religious group (Cairns et al. Reference Cairns, Kenworthy, Campbell and Hewstone2006). Ingroup favoritism and preference for one’s own sect are key aspects of sectarian belonging and identification (Brewer Reference Brewer2007). Therefore, sectarianism involves a process of identifying with a confessional group, or categorization of oneself and others along sectarian lines. Such identification with an ingroup is frequently associated with anti-outgroup attitudes and behaviors, especially when the distinction between groups is morality based (Weisel and Böhm Reference Weisel and Böhm2015) or under conditions of perceived threat (McDoom Reference McDoom2012; Quillian Reference Quillian1995; Sullivan et al. Reference Sullivan, Marcus, Feldman and Piereson1981).
Decades of social psychology research suggest that identification with a group—even random assignment to a relatively meaningless group in a laboratory setting—leads individuals to establish an “us versus them” mentality and can exacerbate prejudicial attitudes and behaviors.Footnote 12 But can heightened ingroup identity salience, a powerful psychological force that often exacerbates intergroup hostility, instead be harnessed to reduce anti-outgroup behavior? The social psychology literature on self-categorization suggests that it can.
Identity Recategorization and Reducing Prejudicial Behavior
Self-categorization theory (Turner et al. Reference Turner, Hogg, Oakes, Reicher and Wetherell1987) posits that we cognitively construe the self through a process of comparison with other individuals in order to establish a sense of identification with an ingroup and, consequently, establish who is part of the outgroup. It is therefore possible for us to simultaneously hold multiple identities, and these identities vary in their degree of inclusiveness of others (Brewer Reference Brewer2007; Brewer and Gaertner Reference Brewer, Gaertner, Brown and Gaertner2001). Self-categorization is dynamic, as several identity levels can be activated at the same time. One can move up and down levels of identification, to more and less inclusive group identities, depending on the contextual cues they receive (Crisp and Hewstone Reference Crisp and Hewstone2007; Dovidio and Gaertner Reference Dovidio and Gaertner2010; Oakes et al. Reference Oakes, Brown and Gaertner2001).
The malleability of group identity suggests that intergroup bias can be effectively combated through identity recategorization—the process by which members of different groups are primed to view themselves as part of a single, more inclusive superordinate group. More specifically, the common ingroup identity model, proposed by Gaertner et al. (Reference Gaertner, Dovidio, Banker, Houlette, Johnson and McGlynn2000), establishes a theoretical link between recategorization and the reduction of prejudicial attitudes and behaviors. The model suggests that recategorization shifts perceptions of ingroup boundaries by seeking to incorporate the outgroup into the ingroup. Laboratory studies and survey experiments employing diverse interventions in a variety of cultural contexts have demonstrated that recategorization, or shifting from a lower-level identity (e.g., sect) to a higher-order superordinate identity (e.g., common religious identity), frequently results in more positive attitudes and behaviors towards members of an outgroup.Footnote 13
These studies suggest that recategorization can systematically reduce prejudicial attitudes and behaviors by redefining what it means to be a member of an ingroup and directing ingroup favoritism toward a more inclusive category of people. Demonstrating the strength of these superordinate identity categories, when subgroups are recategorized within a larger identity group, they may show even greater bias against the newly defined outgroup. For example, following the reunification of Germany, while recategorization alleviated conflict between the previously distinct East German and West German subgroups, it resulted in greater bias against the new superordinate outgroup: foreigners (Kessler and Mummendey Reference Kessler and Mummendey2001).Footnote 14
Social Norms and Ingroup Identity
But what prompts members of a given group to see themselves as part of a more inclusive superordinate identity category? As Tajfel et al. (Reference Tajfel, Billig, Bundy and Flament1971, 151) explain, “by definition there can be no intergroup behavior without the relevant aspects of the social environment having been categorized in terms of whatever may be the pertinent social criteria for the lines of division of people into ‘us’ and ‘them,’ into ingroups and outgroups.” In other words, self-categorization occurs when people become alerted to social normsFootnote 15 delineating ingroup and outgroup identities (Hogg and Reid Reference Hogg and Reid2006). Indeed people learn about social identities through communication with fellow ingroup members. This often occurs through “norm talk” or people discussing directly or indirectly what the group is or is not (Hogg and Rinella Reference Hogg and Rinella2018).
Importantly, people tend to draw inferences about ingroup norms and the boundaries of ingroup identity from social referents—individuals who are particularly influential over people’s perceptions of norms (Paluck, Shepherd, and Aronow Reference Paluck, Shepherd and Aronow2016). In the sectarian-political context, one could conceptualize religious leaders as well as political leaders, due to their presumed expertise and social status, as possible elite referents who shape social norms. As Hogg and Rinella (Reference Hogg and Rinella2018, 8) describe, “In learning about themselves, people seek out and pay more attention to those who they believe are more reliable and trusted sources of valid information about the ingroup prototype and identity. Typically, these are group leaders who members believe are both legitimate ingroup leaders and prototypical group members for whom the group’s identity is a central part of who they are.”
More generally, extensive research in both the United States and comparative contexts suggests that citizens rely on simple and reliable signals from elites in order to make policy judgments.Footnote 16 For example, elites may move public opinion against policies that violate the civil liberties of an opposition or outgroup (Stein Reference Stein2013). Signals from elites can shape perceptions of an outgroup (Hogg and Reid Reference Hogg and Reid2006), especially in a polarized political environment. Elites alert the public to social norms within their ingroup, strongly influencing mass attitudes and behaviors toward the outgroup (Dyck and Pearson-Merkowitz Reference Dyck and Pearson-Merkowitz2014; Pettigrew Reference Pettigrew1998). Along these lines, experimental evidence suggests that top-down approaches to reducing sectarian behavior may be particularly effective (Kobeissi and Harb Reference Kobeissi and Harb2013).Footnote 17
Taken together, the social psychology literature suggests that identity recategorization can be an effective tool in reducing prejudicial attitudes and behaviors. It may be especially effective when trusted elites—who have a great deal of power to shape norms or boundaries of group membership—deliver the message.
Hypotheses
Motivated by these theories of social identity and self-categorization, we first test whether highlighting superordinate social identities can reduce anti-outgroup prejudicial behavior—in this case producing sectarian messages online. Our hypotheses are as follows:
H1a Common Arab Identity (Twitter): Receiving a response to a hateful sectarian message that primes common Arab identity will make individuals less likely to tweet hateful sectarian messages in the future—relative receiving no reply or a message that does not contain a prime.
While we expect priming common Arab identity to reduce users’ likelihood of spreading sectarian messages, we posit that priming a common religious identity may have a more powerful effect. While appeals to a common religion have been used rarely in the research on social categorization,Footnote 18 we expect that highlighting a common religious identity may be particularly compelling given the strong religious component of sectarian identities. Furthermore, appeals to common religion invoke moral obligations (Colby and Damon Reference Colby and Damon2010; Hardy and Carlo Reference Hardy and Carlo2005), making them especially effective. Additionally, major world religions often dictate that any divisions within a community of believers are sinful regardless of whether those divisions are racial, tribal, national, or otherwise (Lazarev and Sharma Reference Lazarev and Sharma2017). Finally, in the Arab context where religious identities are salient, priming a common religious identity certainly meets the “meaningful, relevant, and strong” criteria for successful priming (Chong and Druckman Reference Chong and Druckman2007). We therefore expect that priming a superordinate religious belief—a common Muslim identity or a common belief in God—will be more effective than priming a common national identity. This motivates our next hypothesis:
H1b Common Religious Identity (Twitter): Receiving a response to a hateful sectarian message that primes a common Muslim religious identity will make individuals less likely to tweet hateful sectarian messages in the future—relative to receiving a common national identity prime, no reply, or a message that does not contain a prime.
The analog of these hypotheses for our survey experiment, in which we test the effect of these primes on the attitudes and behaviors of our nationally representative sample of Lebanese citizens—individuals who might be incidentally exposed to online hate speech—is as follows:
H1c Common National Identity (Survey): Receiving a message priming common Lebanese national identity will cause respondents to rate sectarian (counter-sectarian) tweets less (more) favorably and will make respondents less (more) likely to share these messages with their friends—relative to receiving no prime.
H1d Common Religious Identity (Survey): Receiving a message priming a common religious identity (a common belief in God) will cause respondents to rate sectarian (counter-sectarian) tweets less (more) favorably and will make respondents less (more) likely to share these messages with their friends—relative to receiving a common national identity prime or no prime.
Following the literature on the important role that social referents can play in alerting people to norms delineating ingroup and outgroup identities, as well as socially acceptable behavior more broadly, we expect that messages will be more effective if they come from co-sectarian political elites or religious leaders. We therefore hypothesize that messages priming the support of political and religious elites will be more effective at reducing sectarian behavior than non-elite-endorsed messages.
H2a Elite Common Arab Identity (Twitter): Receiving a response to a hateful sectarian message that primes common Arab national identity and highlights support from political elites will make individuals less likely to tweet hateful sectarian messages in the future—relative to receiving a reply priming Arab identity without elite support, a sanctioning message with no prime, or no reply.
H2b Elite Common Religious Identity (Twitter): Receiving a response to a hateful sectarian message that primes a common Muslim religious identity and highlights support from religious leaders will make individuals less likely to tweet hateful sectarian messages in the future—relative to receiving all other primes, a sanctioning message with no prime, or no reply.
The analog of these hypotheses for the survey experiment are as follows:
H2c Elite Common National Identity (Survey): Exposure to a common-national-identity prime that highlights support from political leaders will cause respondents to rate sectarian (counter-sectarian) tweets less (more) favorably and will make respondents less (more) likely to share these messages with their friends—relative to receiving a non-elite national identity prime or no prime.
H2d Elite Common Religious Identity (Survey): Exposure to a common-religious-identity (common belief in God) prime that highlights support from religious leaders will cause respondents to rate sectarian (counter-sectarian) tweets less (more) favorably and will make respondents less (more) likely to share these messages with their friends—relative to receiving any other prime or no prime.
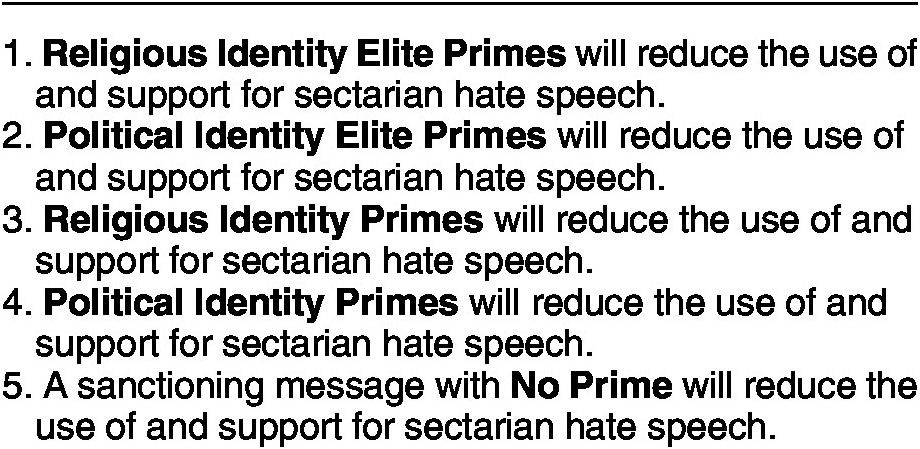
Together, we expect that priming superordinate social identities and sanctioning anti-outgroup behavior will decrease support for and the spread of anti-outgroup content. We expect that common-religious-identity primes will be more effective than common-national-identity primes, and elite-support primes will be more effective than those that do not include elite support. All of these hypotheses (ranked by expected effect size in Table 1) were registered with Evidence in Governance and Politics (EGAP) before collecting data or conducting our analyses.
Hypotheses Ranked by Expected Effect Size (Largest to Smallest)

Twitter Experiment
Experimental Design
We first conducted an experiment in which we replied to Arab Twitter users who had regularly tweeted hostile sectarian language with a randomly assigned counter-speech message and measured the post-treatment change in their behavior over time.Footnote 20 We identified subjects who had regularly tweeted sectarian slurs over a six-month period between July 2017 and January 2018 and had recently posted a tweet containing a sectarian slur at the time of our experiment. We then randomly assigned each subject to a control group or one of five treatment conditions described in detail below. Using a Twitter account that we created and controlled—a “sock puppet”—we tweeted at the subjects in the treatment groups to tell them that their behavior was causing fitna, the commonly used Arabic word for sectarian discord or strife. We varied whether the sock puppet’s message primed common Muslim identity or common Arab identity as well as whether or not it primed religious or political elite support of these messages, or contained no prime at all. We then monitored the subjects’ tweets for one month after treatment to evaluate the persistence of our treatment effects. We also collected data on users’ numbers of followers, location, and the degree to which other individuals in their networks had tweeted hostile sectarian content.
Regarding the ethics of our study, this experiment deceived participants who were unaware that our sock puppet account was in fact a researcher. However, because Twitter is a public forum on which people frequently engage with strangers who may or may not be misrepresenting their identities, the interactions our subjects experienced during our experiment were not outside of the realm of ordinary experiences on Twitter. Having a public Twitter account entails interacting with others online, and the treatment in our study simply involved receiving one tweet from a stranger. Furthermore, because the individuals in our study are engaging in hostile sectarian discourse on a public forum, their behavior is particularly likely to attract interactions from a diverse array of accounts. For this reason, our study received Internal Review Board approvalFootnote 21 and we do not believe it harmed our subjects or other Twitter users.
The first step in performing this experiment was to find Twitter users who had regularly tweeted sectarian hate speech. We began with a dataset of tweets containing Arabic sectarian slurs to identify all Twitter users who had tweeted messages containing anti-Shia slurs at least five times over a six-month period between July 2017 and January 2018. These tweets were identified using a dictionary-based hate-speech detection approach. Given that scholars of sectarianism have identified a series of key terms used in the online sphere to dehumanize and degrade Shia populations (Abdo Reference Abdo2015; Zelin and Smyth Reference Zelin and Smyth2014), tweets containing these slurs represent a reliable measure of the public expression of anti-Shia hostility (Owen-Jones Reference Owen-Jones2018; Siegel et al. Reference Siegel, Tucker, Nagler and Bonneau2017). A list and explanation of these terms can be found in Online Appendix A.
Beginning on January 31, 2018, the first day of our experiment, we used Twitter’s advanced search function to find users who had sent a tweet containing an anti-Shia slur in the past six hours. To be included in our experiment, a user had to also appear in our dataset of tweets containing anti-Shia slurs at least five times, indicating that they had regularly tweeted sectarian hate speech within the past six months. We excluded any users who did not fit these criteria. We also excluded users whose profiles were less than two months old, as very new accounts are often banned for violating Twitter’s terms of service. Because we were interested in targeting non-elite users, rather than sectarian media accounts or well-known individuals with large followings, we excluded all accounts with more than 10,000 followers. While it can be difficult to determine age on Twitter, we additionally excluded any accounts of users who provided profile information suggesting that they might be minors. We also manually inspected each account and excluded any users that appeared to be bots, based on criteria identified by Stukal et al. (Reference Stukal, Sanovich, Bonneau and Tucker2017).
After determining that each user met these inclusion criteria, they were randomly assigned to one of five treatment arms or a control group. Because this manual processFootnote 22 was quite time consuming and a limited number of subjects met this criteria each day, we treated 50 subjects every day for 20 days between January 31, 2018, and February 19, 2018, for a total of 9,957 subjects.Footnote 23
Because anti-Shia slurs are quite common among pro-ISIS and other extremist Twitter users, some of our subjects’ profiles were suspended over the course of our experiment. A total of 4% of the accounts were suspended by two weeks post-treatment and 16% of the accounts were suspended by one month post-treatment. We were left with a total of 795 subjects whose profiles had not been banned one month after treatment. It is possible that the users that we were unable to include in our study because their accounts were deleted or removed might have been less receptive to the treatment if they were indeed more extremist or pro-ISIS accounts.
To help address this concern, we included users whose accounts were eventually banned or deleted in our analysis up until they dropped out of the sample. In the main analysis, data for these individuals was treated as missing after their accounts were deleted or suspended.Footnote 24 This means our results include tweets from 96% of users up to two weeks post-treatment and 84% of users up to a month post-treatment. Our results are substantively similar whether we include the deleted or suspended users up until they drop out of the sample or exclude them from the analysis, helping to alleviate the concern that our results would change if we were able to include suspended and deleted users throughout the study. Additionally, there were no statistically significant differences between attrition rates in any of the treatment or control groups. That being said, the results one month post-treatment, where 16% accounts had been deleted or suspended by the time of data collection, are most likely to be inflated if these accounts would indeed have been less susceptible to treatment.
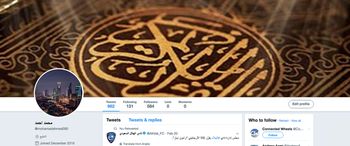
We attempted to convince our subjects that they were receiving a message from a real person, and tried to make our sock puppet look as convincing as possible. Because past research demonstrates that the vast majority of Twitter users tweeting anti-Shia sectarian content are Sunni Muslims from Saudi Arabia and other Gulf Cooperation Council (GCC) countries (Owen-Jones Reference Owen-Jones2018; Siegel et al. Reference Siegel, Tucker, Nagler and Bonneau2017), we designed our sock puppet to appear to be an average Sunni male Twitter user from Gulf, named Mohammed Ahmed. Mohmmed Ahmed’s user profile picture and background picture were copied from actual Gulf Twitter users, and the description of his location, the Arabic word for “Gulf,” is quite common among Twitter users from GCC countries. We created Mohammed Ahmed’s account over a year before running the experiment so that he did not appear to be a bot. We also purchased Mohammed Ahmed 500 Arab Twitter followers, which have Arabic language names and Twitter biographies. In between applying treatments, Mohammed Ahmed frequently tweeted news about soccer and Quranic verses—both of which are very popular in the Gulf Twittersphere (Noman, Faris, and Kelly Reference Noman, Robert and John2015). Mohammad Ahmed actually gained many followers, likes, and retweets naturally over the course of the experiment—primarily from tweeting soccer-related content—highlighting the realistic nature of the account.Footnote 25
Gulf Twitter Sock Puppet for all Treatments

Each time Mohammed Ahmed tweeted at a subject, they received a notification from Twitter. Because non-elite users typically receive only a few notifications per day (Munger Reference Munger2017b), our subjects were likely to see the messages we sent them. Subjects received a reply to their tweet within about six hours of tweeting, making treatments more realistic interactions. The primary outcome of interest was to see how subjects’ behavior changed after receiving a message from Mohammed Ahmed. The randomly assigned Arabic messages that each group of users received from Mohammed Ahmed translate to English as follows:
• Control: No Message
• No Prime: “That language sows (sectarian) discord/strife.”
• Common National Identity: “That language sows (sectarian) discord/strife. We are all Arab.”
• Common Religious Identity: “That language sows (sectarian) discord/strife. We are all Muslim.”
• Elite Common National Identity: “Many political leaders say that language sows (sectarian) discord/strife. We are all Arab.”
• Elite Common Religious Identity: “Many religious leaders say that language sows (sectarian) discord/strife. We are all Muslim.”
Results
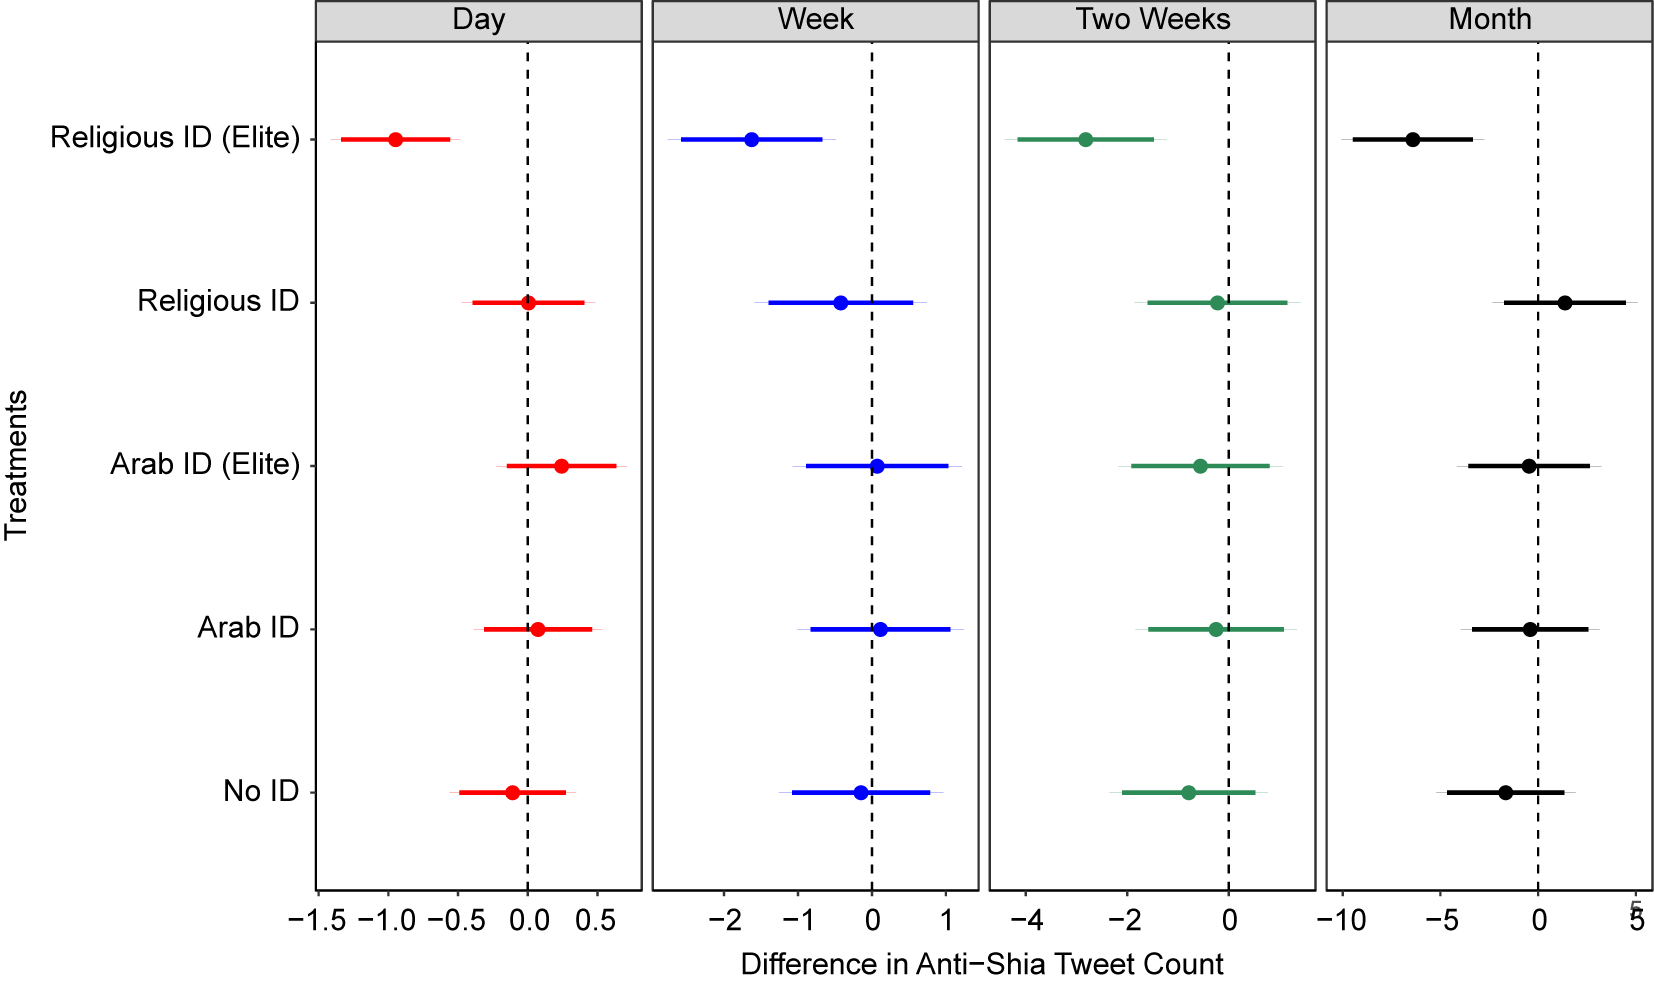
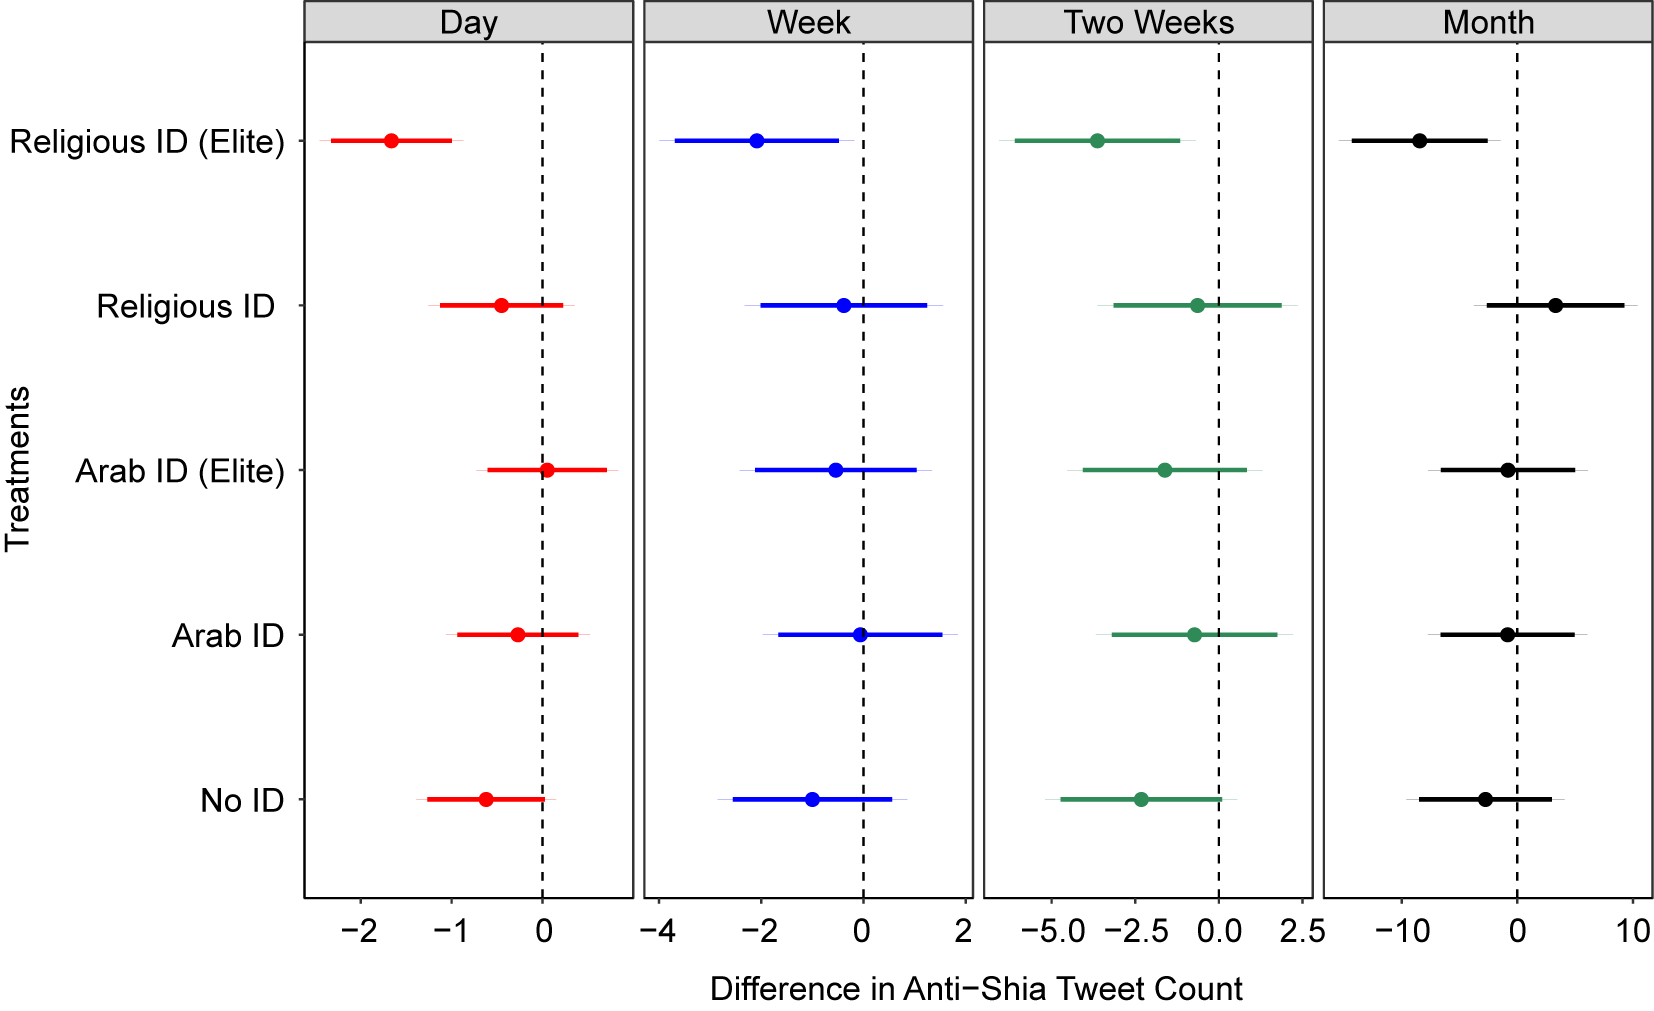
The coefficient plot in Figure 2 shows the effect of each treatment on the change in users’ anti-Shia tweet count one day, one week, two weeks, and one month after treatment for all subjects in our experiment, relative to the control group.Footnote 26 In addition to the difference in means results displayed below, as robustness checks we also replicated our analysis using negative binomial models, models measuring the difference in the proportion (rather than count) of anti-Shia tweets, models excluding users whose accounts were ultimately suspended or deleted, and models controlling for the treatment date.Footnote 27 All of these specifications, reported in Tables A7, A8, and A16–21, produced substantively similar results.
As Figure 2 demonstrates, the only treatment for which we observed a statistically significant effect is that delivering the message that primed a common religious identity with elite support. This treatment significantly reduced anti-Shia hate speech in each of the nonoverlapping periods—one day post-treatment (day 1) compared with one day pre-treatment, one week post-treatment (days 2–7) compared with one week pre-treatment, two weeks post-treatment (days 8–14) compared with two weeks pre-treatment, and one month post-treatment (days 15–30) compared with one month pre-treatment. On average, receiving the treatment message that primed common religious identity and elite support resulted in a decrease of 0.95 (almost one tweet) one day after treatment compared with one day before, a decrease of 1.6 tweets one week after treatment compared with one week before, a decrease of 2.8 tweets two weeks after treatment compared with two weeks before, and a decrease of 6.4 tweets one month after treatment compared with the month before. This means that one month post-treatment, there was an average decrease of 11.8 tweets compared with the month before, aggregating across the nonoverlapping time intervals. For the 138 individuals who received this prime, whose accounts were still active one month post-treatment, our intervention resulted in a decrease of 1,621 sectarian tweets over the course of the experiment.
Effect of Treatment on Volume of Anti-Shia Tweets

On the one hand, this finding is in line with our hypotheses, that a sanctioning message containing a common religious identity prime with elite support would be the most effective treatment for reducing sectarian hate speech. On the other hand, we did not find support for any of our other hypothesized treatment effects, including those that use identity recategorization primes alone. While this highlights the difficulty of using counter-speech to decrease hostile sectarian discourse, it also suggests that messages containing support from religious elites may be particularly effective.
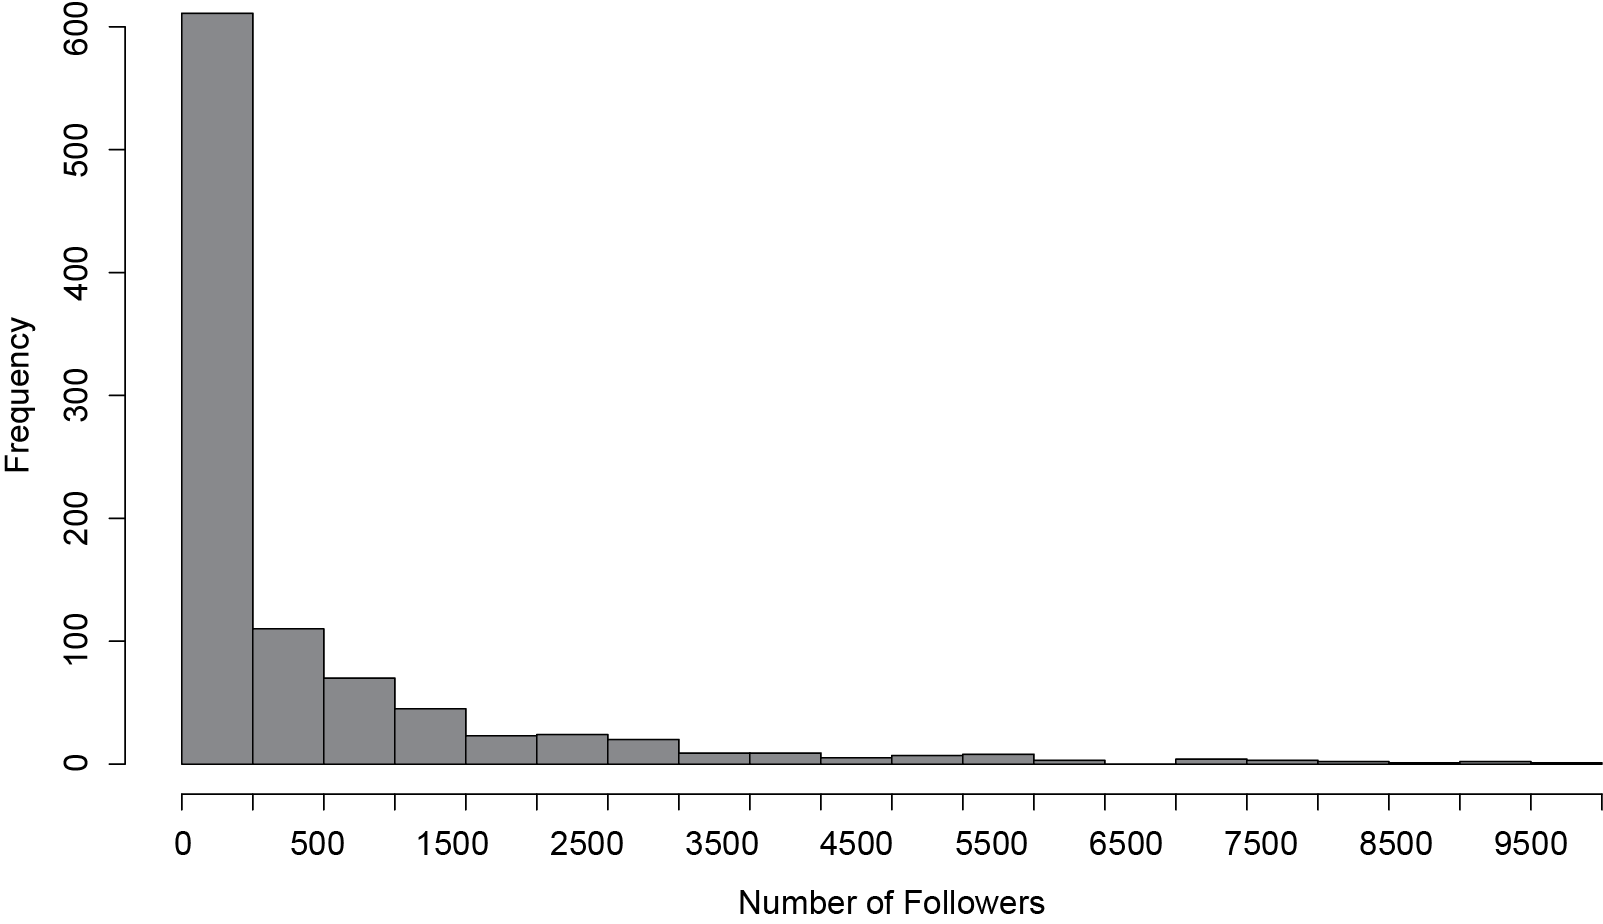
One concern with our experimental design is that some users in our sample had too many followers, so they were not effectively exposed to our treatments. This might be one explanation for why we largely observed null effects. Users with several thousand followers might receive hundreds of notifications a day, and they may not have seen our treatment message from Mohammed Ahmed. Looking at the distribution of followers among our subjects in Figure 3, while the majority of our subjects have at most a few hundred followers, those subjects with higher follower counts may not have all been properly exposed to our treatment. It is also possible that the treatment is more effective for users with fewer followers not only because they were more likely to see the treatment message but also because our sock puppet—particularly with elite messages—might be perceived as a higher-status user.Footnote 28
Distribution of Follower Counts

To test this possibility, we restricted our analysis to users who have the median number of followers (250) or fewer.Footnote 29 We believe this represents a better test of our hypotheses because subjects were more likely to have observed our interventions. As Figure 4 demonstrates, we observed larger treatment effects for the common religious identity prime with elite support when we restricted our analysis to individuals with fewer followers, but we still observed null results for the other treatments. We also replicated this analysis with different thresholds ranging from 200–400 followers to ensure that our results were not driven by the selection of the median, a relatively arbitrary threshold.Footnote 30 The coefficient plot in Figure 4 shows the effect of each treatment on the change in users’ anti-Shia tweet count one day, one week, two weeks, and one month after treatment for users with 250 or fewer followers. The treatment message that primed common religious identity and elite support again significantly reduced anti-Shia hate speech in each of the nonoverlapping periods. On average, receiving this treatment resulted in a decrease of 1.6 tweets one day after treatment compared with one day before, a decrease of 2.1 tweets one week after treatment compared with one week before, a decrease of 3.6 tweets two weeks after treatment compared with two weeks before, and a decrease of 8.4 tweets one month after treatment compared with one month before. This means that one month post-treatment, there was an average decrease of 15.7 tweets, aggregating across the nonoverlapping time intervals. This effect is about 33% larger than the effect we observed for the full sample.
Effect of Treatment on Volume of Anti-Shia Tweets ( Median Followers)

Testing the Social Norms Mechanism
We might expect that our interventions would be more effective in networks where anti-Shia tweets were relatively uncommon—where receiving a sanctioning message highlighting norms of acceptable behavior might be most believable. To test this social norms mechanism, we examined how the composition of individuals’ networks might change their receptiveness to our counter-speech interventions.Footnote 31 While all of our subjects tweet hostile anti-Shia content, some of them may be embedded in networks where this behavior is quite common, whereas others may be some of the only people in their networks who tweet such language.
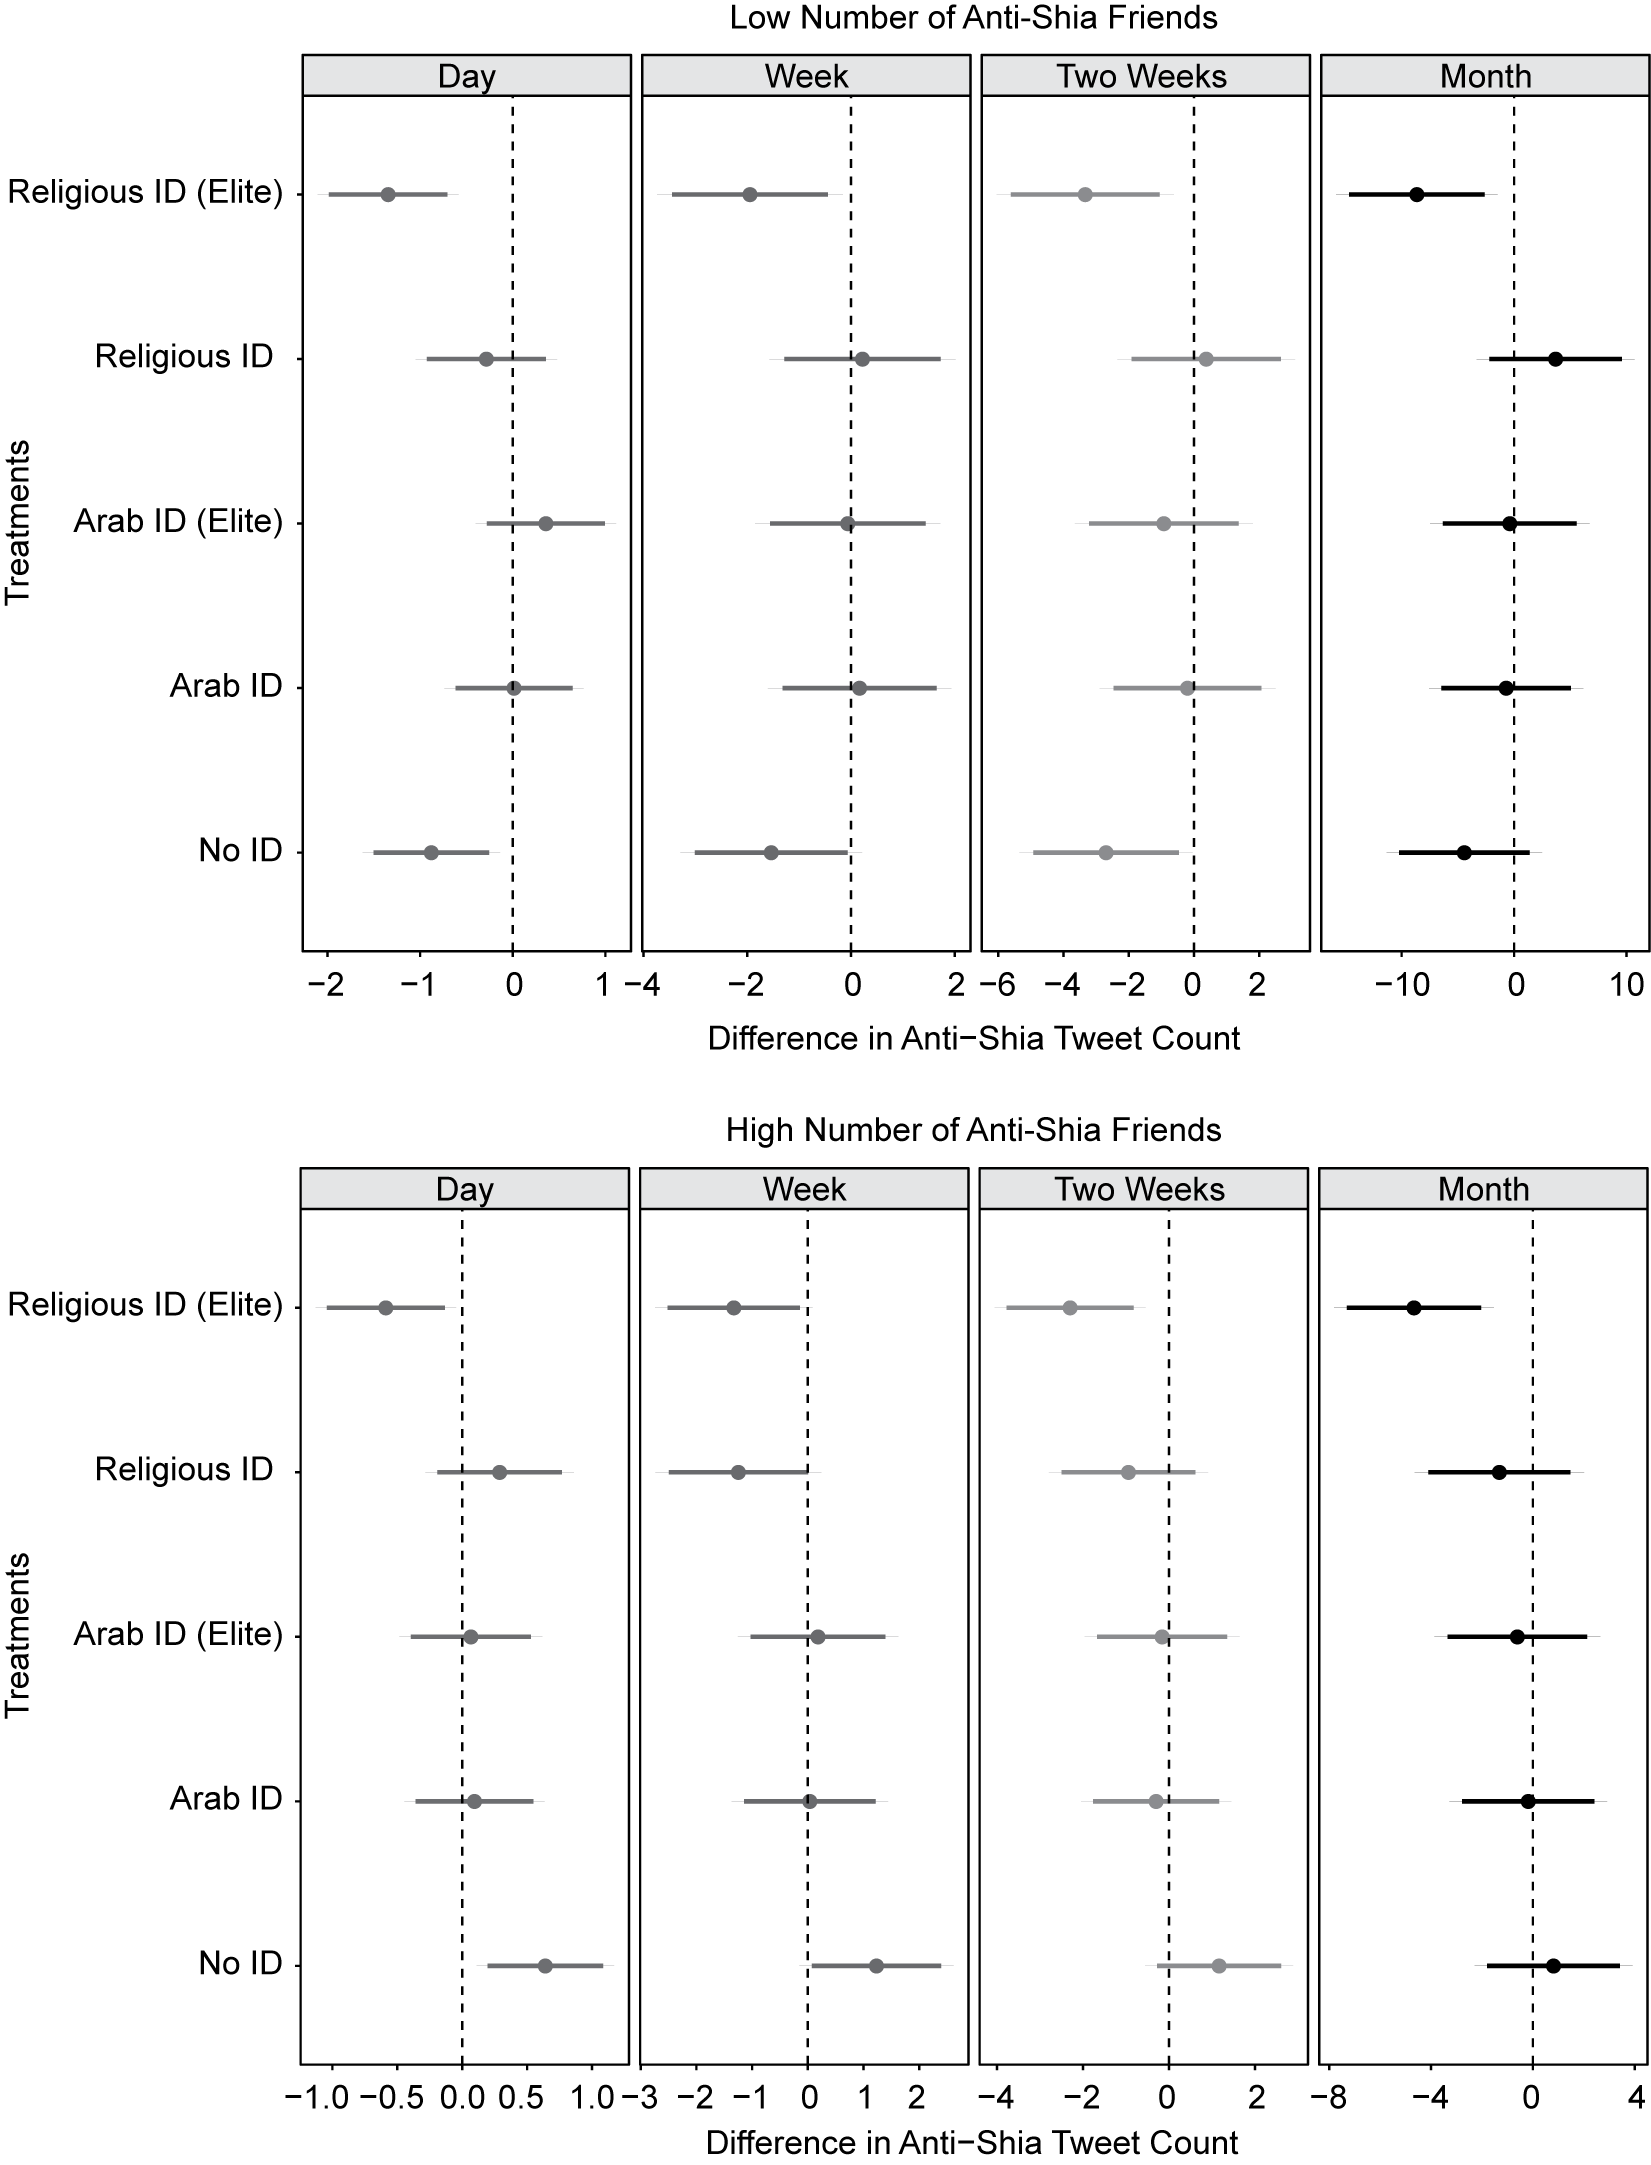
To assess treatment affects by network type, we gathered network data for each subject—a list of all user-ids in each subject’s friend network. We cross-referenced these user-ids with our dataset of all tweets containing anti-Shia slurs in the pre-treatment period. For each subject, we calculated how many friends in their network had tweeted anti-Shia slurs in the pre-treatment period. We then assessed the effects of our treatments on users with high (above the median) and low (below the median) numbers of friends who produce anti-Shia hate speech. The results, displayed in Figure 5 below, show that while the elite-endorsed, religious-identity prime was still the most consistently effective, these effects were larger for subjects with lower levels of anti-Shia hostility in their networks.
Where the results differed most dramatically was among subjects who simply received a sanctioning message without a prime. Users in networks where hostile anti-Shia language is common were not deterred by receiving a sanctioning message alone and may even express backlash, whereas those in networks where anti-Shia hostility is rare were significantly deterred up to two weeks post-treatment. This provides suggestive evidence that the public sanctioning component of our primes—while effective for those users in less hostile networks—did not affect those who are regularly exposed to hostile language and perhaps view it to be more socially acceptable. It also indicates that a stronger treatment—such as a treatment containing a cue from a trusted religious elite—might be necessary to deter users for whom exposure to hate speech is more commonplace.
Effect of Treatment on Volume of Anti-Shia Tweets (Low vs. High Anti-Shia Friends)

Taken together, these results indicate that the message that primed common religious identity and elite support was the only counter-speech intervention that reduced anti-Shia hate speech. Our exploratory analysisFootnote 32 suggests that these effects were stronger for users with fewer followers, where we expect that our treatment was delivered most effectively. Given that this is a bundled treatment, combining an elite cue with a common-religious-identity prime, our design does not allow us to disentangle whether this particular combination would be more effective than just receiving a sanctioning message with a religious elite cue—but without a common-religious-identity prime. Because we do not see an effect of the common-religious-identity prime alone, we interpret our results as providing suggestive evidence that counter-speech emphasizing religious elite support may be particularly effective in reducing hostile sectarian discourse.
The importance of social norms is especially evident in our exploratory subgroup analysis by network type, which highlights that individuals in networks where hate speech is common—where norms of anti-outgroup behavior are well established—were somewhat less affected by our elite common-religious-identity counter-speech treatment. Moreover, for individuals who were not regularly exposed to sectarian hate speech in their networks, simply receiving a message criticizing one’s behavior—or alerting the individual to a social norm surrounding the anti-outgroup behavior—may be sufficient to reduce the use of sectarian hate speech.
Survey Experiment
While the results of our Twitter experiment provide compelling evidence that common religious identity primes emphasizing elite support can effectively reduce anti-Shia hate speech among regular producers of this language in the Arab Twittersphere, they tell us very little about how counter-speech strategies might affect the behavior of the millions of citizens that may be incidentally exposed to this type of hate speech online. Seeking to understand the effects of our interventions beyond the particular Twitter users that frequently produce this content, we also conducted a survey experiment on a nationally representative sample of 500 Lebanese adults.
Lebanon is an amalgam of religious confessional groups, boasting 17 different sectarian groups that share social and political power. The main sectarian groups are Shia Muslim (27 ), Sunni Muslim (27
 ), Maronite Christian (21
 ), Druze (5.6
 ), and Orthodox Christian (6
 ) sects. The remaining groups include various sects within Islam and Christianity (Lebanese Information Center 2013). The country has a long history of sectarian violence dating back at least two centuries, with each subsequent war or conflict disrupting the political status quo and then reshaping it into a new sectarian system with the support of regional and international actors (Ziadeh Reference Ziadeh2006). Lebanon’s prolonged civil war from 1975–1990 ended with the Taif agreement, which reinforced the distribution of government positions along sectarian lines. Under this consociational system, the president is a Maronite Christian, the prime minister is a Sunni Muslim, the speaker of parliament is Shia Muslim, and members of parliament are half Christian and half Muslim (Traboulsi Reference Traboulsi2007).
In this context, sectarian identities are salient in politics, business transactions, socioeconomic status distinction, and territorial dominance (Traboulsi Reference Traboulsi2007; Ziadeh Reference Ziadeh2006). Survey research suggests that Lebanese citizens express high levels of sectarian ingroup bias regardless of sect, region of origin, or gender (Harb Reference Harb2010). For example, in daily conversation, it is common to find one person probing the other for sign of their sectarian belonging (Ziadeh Reference Ziadeh2006). At the time of our experiment, sectarian tensions in Lebanon were heightened partly as a consequence of the ongoing regional proxy war between Iran and Saudi Arabia and the influx of Syrian refugees. Our survey was carried out from November 9, 2017, to November 23, 2017, during a time of particularly high tension, just days after Lebanon’s Prime Minister Saad Hariri announced his resignation in a televised address from Riyadh in which he accused Iran of sowing “discord, devastation and destruction” in the Arab World (Daher Reference Daher2018). We were therefore able to test whether counter-speech messages could reduce support for hateful messages and willingness to spread hate speech among potential incidental consumers of online hate speech even under conditions of heightened intergroup tensions.
Experimental Design
Our subjects, a nationally representative sample of 500 adult Lebanese citizens, were asked to participate in a survey about social and political attitudes and beliefs in Lebanon. Participants were selected by Information International (II), a Beirut-based survey firm, using multistage probability sampling. Neighborhoods in each city were selected that represent the confessional diversity of the area. Then households were selected based on systematic random sampling according to the estimated number of buildings in the neighborhood. Primary respondents over the age of 18 from each household were sampled based on their most recent birthdays.Footnote 33 Subjects first completed a series of questions about their political and sectarian attitudes. They then completed a battery of questions about their media consumption habits and social media use.
After answering these questions, subjects were randomly assigned to receive one of four counter-speech primes (embedded in the instructions for the next section) or were assigned to a control group that did not receive a prime. After reading the prime or control message, all subjects were then asked to rate several tweets containing sectarian (anti-outgroup) and counter-sectarian (promoting positive intergroup relations) rhetoric. Examples of sectarian and counter-sectarian tweets are displayed below. Sectarian tweets targeted either Sunnis, Shia, Christians, or Druze.
Sectarian Tweet Example (Translated Text):
• #HezbollahDestroysLebanon. Most people are fully aware that Hezb al-Lat [derogatory sectarian term for Hezbollah] and its rawafidh [anti-Shia slur] followers are a brutal subversive arm of Iran.
Counter-Sectarian Tweet Example (Translated Text):
• There is no hope in Lebanon as long as politicians speak as Shia, Sunni, Druze, or Christian. #Sectarianism is cancer.
Subjects assessed each tweet according to how favorably they felt towards each message and its author and how likely they would be to share the message with others. These rating scores were our primary outcome variable of interest. The primes, adapted from messages used in previous laboratory experiments on identity recategorization in the Lebanese context (Sagherian and Harb Reference Harb2010), were embedded in the tweet-rating instructions, and they contained similar messages to the primes used in the Twitter experiment. They are translated from Arabic below, and the prime-specific text is italicized here for emphasis:
• No Prime: Over the past few years, there has been a rise in sectarian tensions in Lebanon and across the Middle East. Sectarian issues have been widely discussed on Twitter, a popular social networking site on which users can post messages of 140 characters or less and share messages with their friends. You will now be presented with several messages from Twitter users on this topic and will answer a few questions about each message.
• Common-National-Identity Prime: Over the past few years, there has been a rise in sectarian tensions in Lebanon and across the Middle East. But many people agree that their sect does not make them better than anyone else. They agree that we are all Lebanese and we all should be equal. We all live on one land. We share the same history and the same future; we share the same culture, the same food, and language. Most importantly, we share a common Lebanese identity. Such sectarian issues have been widely discussed on Twitter, a popular social networking site on which users can post messages of 140 characters or less and share messages with their friends. You will now be presented with several messages from Twitter users on this topic and will answer a few questions about each message.
• Common-Religious-Identity Prime: Over the past few years, there has been a rise in sectarian tensions in Lebanon and across the Middle East. But many people agree that their sect does not make them better than anyone else. They agree that we all believe in one GodFootnote 34 and we should all be equal. We all live on one land, we share the same history and the same future; we share the same culture, the same food, and language. Most importantly, we share a common belief in God. Such sectarian issues have been widely discussed on Twitter, a popular social networking site on which users can post messages of 140 characters or less and share messages with their friends. You will now be presented with several messages from Twitter users on this topic and will answer a few questions about each message.
• Elite Common-National-Identity Prime: Over the past few years, there has been a rise in sectarian tensions in Lebanon and across the Middle East. But many prominent politicians including members of the March 8 bloc, the March 14 bloc, and independentsFootnote 35 have called for people to come together. They agree that we are all Lebanese and we all should be equal. We all live on one land. We share the same history and the same future; we share the same culture, the same food, and language. Most importantly, we share a common Lebanese identity. Such sectarian issues have been widely discussed on Twitter, a popular social networking site on which users can post messages of 140 characters or less and share messages with their friends. You will now be presented with several messages from Twitter users on this topic and will answer a few questions about each message.
• Elite Common-Religious-Identity Prime: Over the past few years, there has been a rise in sectarian tensions in Lebanon and across the Middle East. But many prominent Christian, Sunni, and Shia religious leaders have issued religious decrees calling for people to come together and stop inciting sectarian hatreds. They agree that we all believe in one God and we all should be equal. We all live on one land. We share the same history and the same future; we share the same culture, the same food, and language. Most importantly, we share a common belief in God.Such sectarian issues have been widely discussed on Twitter, a popular social networking site on which users can post messages of 140 characters or less and share messages with their friends. You will now be presented with several messages from Twitter users on this topic and will answer a few questions about each message.
After receiving these instructions, subjects rated a series of eight randomly ordered images of actual Arabic language tweets on an iPad, rated the users who sent the tweets, and rated their likelihood of sharing such messages themselves on social media. We then assessed the effects of being assigned to one of these treatments (relative to the control group) on the favorability and sharing likelihood ratings of all eight tweets. We conducted this analysis with and without controls for demographic characteristics and a range of sectarian attitudes, described in detail in the Online Appendix.
Results
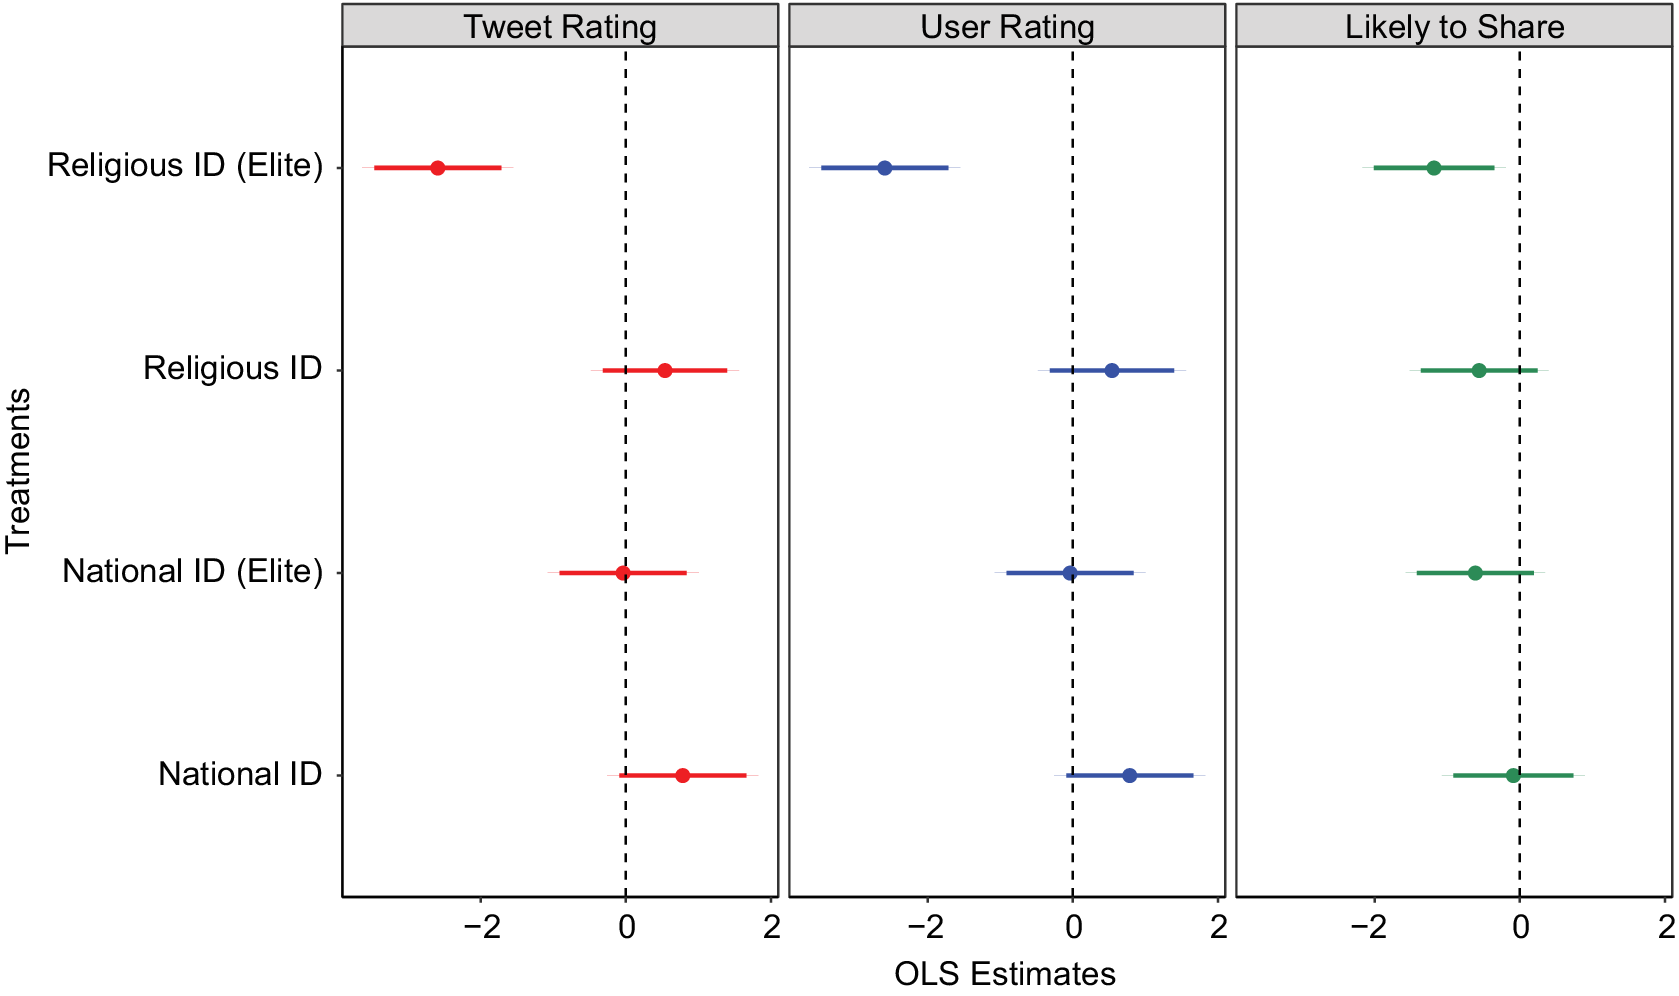
The coefficient plot in Figure 6 shows the effect of each of our treatments on subjects’ combined ratings of four sectarian (anti-outgroup) and four counter-sectarian (promoting positive intergroup relations) tweets. The first column displays the effect of treatment on ratings of the tweets themselves, the second displays the effect on ratings of the users who produced the tweets, and the third column displays the effect on respondents’ likelihood of sharing the tweets. These results suggest that receiving the elite common-religious-identity prime caused respondents to rate sectarian tweets more negatively and counter-sectarian tweets more positively in aggregate.Footnote 36 As Figure 6 demonstrates, corresponding with what we observed in the Twitter experiment, the common-religious-identity prime with elite support was the most effective treatment and the rest of our treatments resulted in null effects.
Effect of Primes on all Tweet Ratings

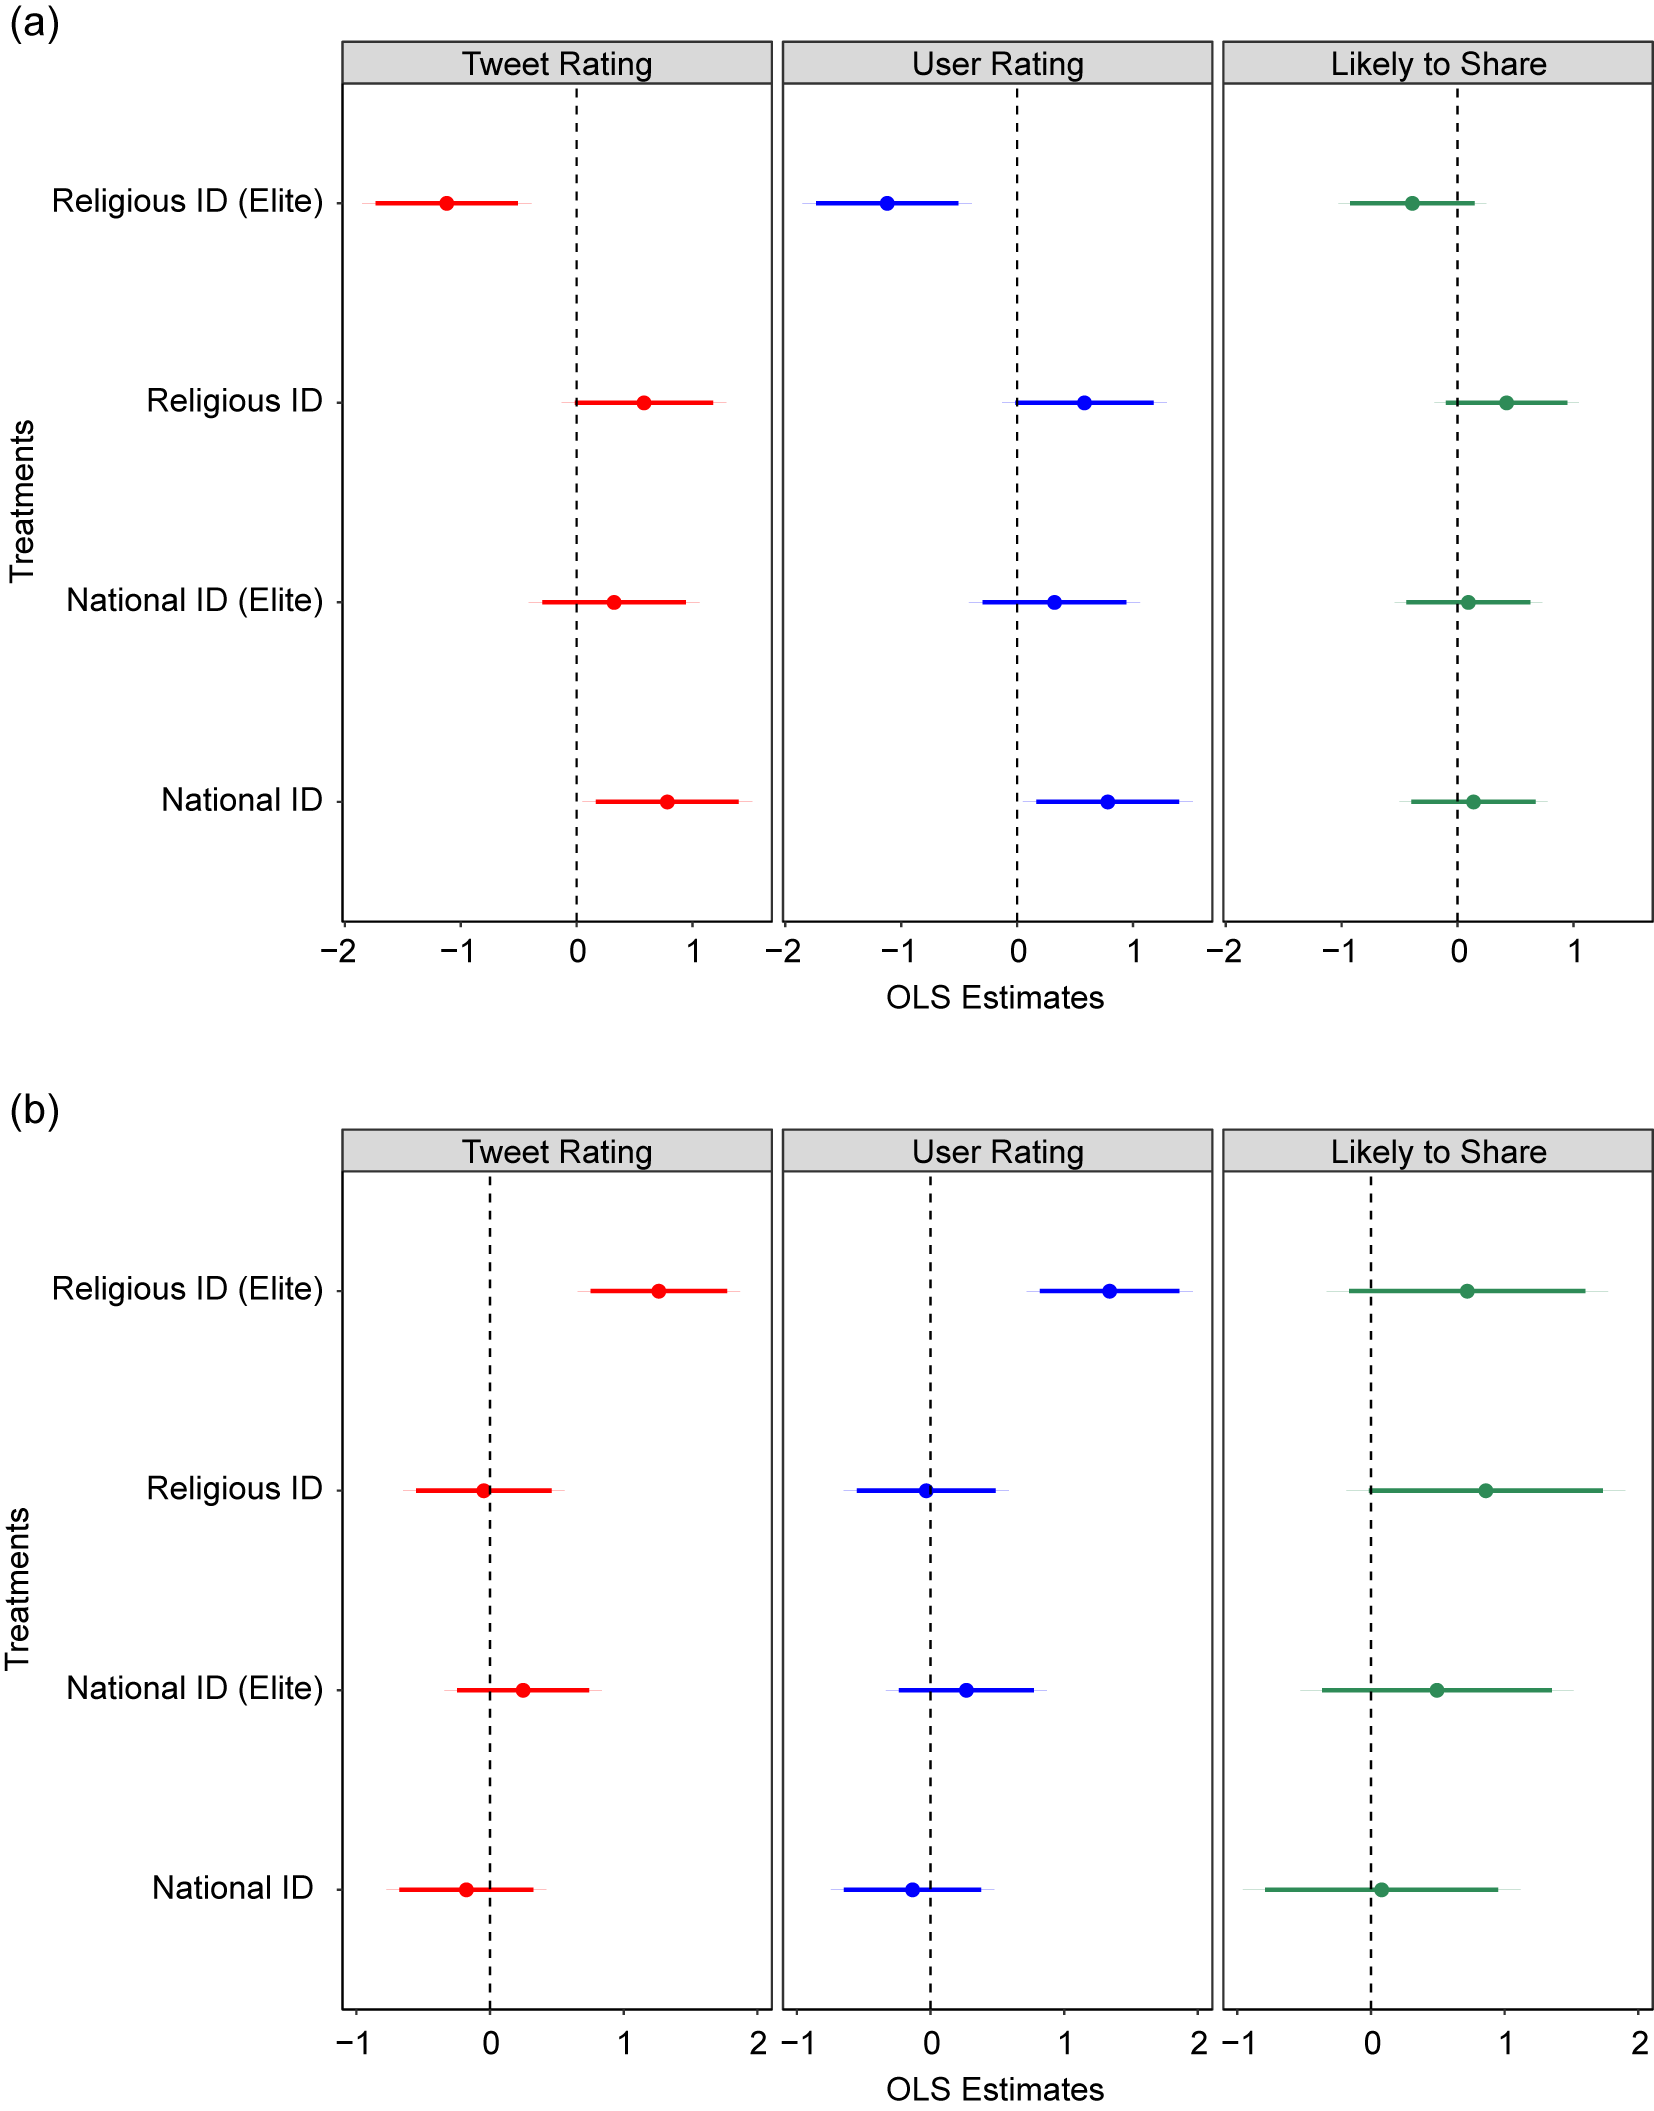
Examining the results of the survey experiment by tweet type, the coefficient plots in Figure 7 show that the common-religious-identity prime with elite support has a negative effect on subjects’ favorability ratings of sectarian tweets, favorability ratings of the users who sent the tweets, and likelihood of sharing the tweets. This prime also had a positive statistically significant effect on users’ favorability ratings of counter-sectarian tweets and the users who sent them. Thus, the combined result displayed in Figure 6 is driven by a change in the ratings of both sectarian and counter-sectarian tweets. Neither of the common-national-identity primes (with or without elite support) had a significant effect on tweet ratings in aggregate. However, the common-national-identity treatment (without elite support) actually had a backlash effect on sectarian tweet ratings, increasing favorability ratings of both the tweets themselves and the users who sent them.
Effect of Primes on (a) Sectarian and (b) Counter-Sectarian Tweet Ratings

Testing the Social-Norms Mechanism
One of the strongest predictors of unfavorable ratings for sectarian tweets and favorable ratings for counter-sectarian tweets in our survey experiment was users’ level of motivation to control prejudice (MCP)—or their concern with acting prejudiced or being perceived as prejudiced (Dunton and Fazio Reference Dunton and Fazio1997).Footnote 37 The social psychology literature suggests that people with high levels of motivation to control prejudice tend to exhibit higher levels of conformity to social norms (Forscher et al. Reference Forscher, Cox, Graetz and Devine2015; Walker, Sinclair, and MacArthur Reference Walker, Sinclair and MacArthur2015).
This finding, that Lebanese citizens who are exposed to hate speech are especially unlikely to express support for hostile messages and more likely to express support for counter-sectarian messages if they are concerned with being perceived as prejudiced, also goes hand in hand with our finding in the Twitter experiment that effects are stronger for individuals who do not regularly see sectarian hate speech in their networks. In both cases, when people are concerned with and/or alerted to social norms, they may avoid engaging in behavior that could be seen as deviant or outside of what is publicly acceptable.
Discussion and Conclusion
The results of both our experiment in the Arab Twittersphere and our nationally representative survey experiment in Lebanon indicate that priming common religious identity in a manner that emphasizes elite support most effectively deters regular producers of online hate speech from disseminating hostile content and also makes everyday citizens who may be incidentally exposed to online hate speech more supportive of tweets advocating positive intergroup relations and less supportive of tweets containing hate speech. Observing consistent results across these two experiments helps alleviate the concern that we conducted a single-message study (Jackson and Jacobs Reference Jackson and Jacobs1983)—that our Twitter experiment is just one sockpuppet that tweeted one message, which might not be effective if the message had been phrased differently or if the experiment had been carried out on different respondents. However, the fact that we conducted two experiments on two very different samples and each experiment used differently worded messages adapted to each particular context increases our confidence in this finding.
Our exploratory analysis also provides suggestive evidence of the mechanisms by which our interventions might be successful, highlighting the factors that might prompt individuals to share—or not share—hateful content online. In our Twitter experiment, simply receiving a message criticizing the use of anti-Shia slurs reduced users’ future likelihood of tweeting such content among users in networks where hate speech was less common—where norms against hate speech may have been more compelling. While individuals of course were not randomly assigned into hostile or non-hostile networks and we cannot test the effects of network composition causally with our current research design, our subgroup analysis nonetheless offers insight into where counter-speech interventions may be more or less effective. Additionally, in our survey experiment, one of the strongest predictors of unfavorable ratings for sectarian tweets and favorable ratings for counter-sectarian tweets was users’ level of MCP—their concern with acting prejudiced or being perceived as prejudiced. Individuals with high levels of MCP were less likely to give favorable ratings to sectarian content and more likely to give favorable ratings to counter-sectarian tweets. This offers additional suggestive evidence that our treatments may operate by alerting individuals to norms delineating the bounds of acceptable behavior.
An important limitation of our study is that we cannot disentangle the effect of receiving an elite cue from the effect of receiving an elite cue that also primes common Muslim or common Arab identity due to the bundled nature of our treatment. We theorized that priming a common superordinate identity alerts the individuals to norms surrounding the boundaries of their ingroup identity, providing a rationale for sanctioning anti-outgroup behavior. However, our results suggest that identity recategorization interventions alone were not effective. Only when messages priming a common religious identity contained elite endorsements did we observe an effect. We believe this offers preliminary evidence that counter-speech interventions priming support from trusted elite members of an ingroup may be especially effective. While this is in line with our hypothesis that the common religious identity with elite support treatment should have the largest effect, our research design does not enable us to evaluate whether this particular bundled treatment or religious elite cues alone reduced the use of anti-Shia rhetoric and support for such hostile discourse.
Another caveat is that because 4% of the accounts were suspended or deleted by two weeks post-treatment and 16% of the accounts were suspended by one month post-treatment, it is possible that these accounts might have been more extreme and less receptive to counter-speech interventions. If this was the case, our average treatment effects would have appeared larger than they would have been if these accounts were not removed. While our analysis including and excluding these accounts up until they dropped out of the sample produced similar results, suggesting that suspended or deleted accounts were also receptive to treatment at least up to two weeks post-treatment, we cannot rule out the possibility that the effect sizes in the 15–30 day period, where a larger number of accounts had been deleted or suspended, were higher than they would have been if these accounts had not been removed.
An additional consideration is whether counter-speech interventions priming common superordinate identities might inadvertently displace the targets of hate rather than reducing hostile language overall. In certain contexts, emphasizing a common national or common religious identity might redirect prejudice onto a new outgroup and mobilize a new destructive form of nationalism or religious discourse that could also ignite intergroup conflict. For example, we might be concerned that subjects in the Twitter experiment might produce less anti-Shia discourse but instead produce more anti-Christian or anti-Semitic language after receiving a message priming a common religious identity. We did not observe evidence of this in our respondents’ tweets, and very few individuals replied to the sock-puppet with negative messages. However, this potential for backlash targeting of a newly defined outgroup should be considered and evaluated in future work using identity recategorization interventions.
While we study these dynamics in the Arab World, we might expect to see similar outcomes in other contexts of contemporary sectarian conflict such as Northern Ireland between Catholics and Protestants (Cairns et al. Reference Cairns, Kenworthy, Campbell and Hewstone2006); the Balkans between Catholics, Eastern Orthodox Christians, and Muslims (Jenne Reference Jenne2010); the Central African Republic between Christians and Muslims (Amnesty International 2014); Pakistan between Sunnis and Shia (Nasr Reference Nasr2000); and India between Hindus and Muslims (Varshney Reference Varshney2003) to name a few. We hope that future research will explore counter-speech interventions in more diverse contexts to help us gain a better understanding of where they might be most effective.
Together, our findings offer preliminary insights into avenues for decreasing online hate speech. While past experimental work has also highlighted the potential of counter-speech in mitigating harmful speech online (Mathew et al. Reference Mathew, Kumar, Goyal and Mukherjee2018; Munger Reference Munger2017b), our study builds on this work in three key ways. First, our results highlight the role that trusted elites might play in reducing anti-outgroup prejudicial behavior. Indeed they suggest that merely referencing hypothetical elites may be sufficient to change behavior online. Second, our findings indicate that counter-speech interventions may be effective on both direct producers of anti-outgroup hate speech and individuals who may be incidentally exposed to hate speech. Finally, our results suggest that counter-speech messages with religious elite endorsements may be effective even in a context of an ongoing violent regional intergroup conflict. In general, more research is needed to determine how cues from religious elites and other trusted leaders might be used to curb harmful online speech. We hope future counter-speech research will build on this work to further explore how elite messaging might be harnessed to mitigate the spread of hostile sectarian discourse and hate speech more broadly.
Supplementary Materials
To view supplementary material for this article, please visit http://dx.doi.org/10.1017/S0003055420000283.
Replication materials can be found on Dataverse at: https://doi.org/10.7910/DVN/KQJKY0.




Comments
No Comments have been published for this article.