Introduction
Kaolinite (Kln) is an extremely important 1:1 type layered aluminosilicate mineral, with each structural unit layer composed of a silicon-oxygen tetrahedral (T) sheet and an aluminum-oxygen octahedral (O) sheet interconnected through shared oxygen atoms (Brindley and Robinson, Reference Brindley and Robinson1945). Natural kaolin usually exhibits considerable visible-light photochemical activity, mainly due to the various iron impurity species it contains. These iron impurity species mainly include: (1) crystalline iron oxide minerals (such as hematite, goethite, etc.) that co-exist with Kln; (2) free Fe ions and their hydroxides adsorbed on the surface of Kln; and (3) structural Fe embedded in the Kln aluminosilicate lattice in the form of isomorphous substitution (Schofield, Reference Schofield1950; Rengasamy et al., Reference Rengasamy, Krishna Murti and Sarma1975). Therefore, due to these iron species, Kln has received extensive attention in the fields of photocatalyst and photo-Fenton-like catalysts in recent years (Menager and Sarakha, Reference Menager and Sarakha2013; Ding et al., Reference Ding, Wang, Yu, Zhang, Li and Wu2015; Li et al., Reference Li, Huang, Dong, Sun, Duan, Ren, Zheng and Dionysiou2019; Zhou et al., Reference Zhou, Jiang, Jing, Yin and Li2024). These iron oxide species that endow Kln with photochemical activity exhibit inherently low photocatalytic activity themselves, mainly due to their extremely short photogenerated hole diffusion lengths and poor conductivity (Mishra and Chun, Reference Mishra and Chun2015; Gao et al., Reference Gao, Zhang, Nakajima, He, Liu, Zhang, Wang and Wu2023). Compared with typical pure semiconductor photocatalysts (such as TiO₂, g-C₃N₄), the photocatalytic performance of natural Kln is markedly lower, which significantly constrains its application as a photocatalyst. In view of this, enhancing its photocatalytic performance through structural regulation and interface engineering has become a key path in terms of promoting its practical application.
In the traditional field of solid-acid catalysis, acid treatment represents a widely adopted strategy for modulating precisely the surface structure of catalysts. Acid treatment can enhance the catalytic activity of Kln effectively due to increased specific surface area (SSA), porosity, and the number of acidic sites (Lenarda et al., Reference Lenarda, Storaro, Talon, Moretti and Riello2007; Panda et al., Reference Panda, Mishra, Mishra and Singh2010). Similarly, an increase in SSA and porosity can significantly enhance the opportunities for Kln to interact with organic contaminants, thereby improving its photocatalytic performance (Szabó et al., Reference Szabó, Zsirka, Fertig, Horváth, Csizmadia and Kristóf2017; Jiang et al., Reference Jiang, Wang, Gao, Fu and Yang2021). However, owing to the substantial disparities in the composition of natural Kln, there are remarkable variations in the occurrence forms and relative amounts of iron species. These variations result in evident differences in the photochemical activity of natural Kln from different sources. This inherent variability also means that the impact of acid treatment on the photocatalytic performance of natural Kln in degrading different pollutants is more complex. Therefore, clarifying systematically the intrinsic mechanism of acid treatment in regulating the structure-activity relationship of Kln remains an important scientific challenge.
Among the iron impurities in Kln, iron oxide minerals and free Fe ions along with their corresponding hydroxide oxides exist mainly in the form of associated phases or surface adsorption states, while structural Fe is embedded in the Kln aluminosilicate lattice through isomorphic substitution. Therefore, without destroying the aluminosilicate framework of Kln, iron oxide minerals are readily separated magnetically, and free iron and its hydroxide oxides can be removed by mild acid rinsing. In contrast, structural Fe shows significant stability against conventional magnetic separation and mild acid rinsing, and can only be partially dissolved under harsh conditions such as strong acid leaching. Thus, by adjusting the intensity of acid treatment, the sequential removal of extraneous iron phases and structural Fe can be achieved, which is conducive to systematic study of the influence mechanism of acid treatment on the intrinsic photocatalytic performance of Kln.
To ensure effective acid treatment, natural Kln is typically calcined prior to the acid-treatment process. This is because when the calcination temperature exceeds 600°C, the layered crystal structure of natural Kln is destroyed, resulting in the formation of amorphous metakaolin (MK) (White et al., Reference White, Provis, Proffen, Riley and van Deventer2010; Zhang et al., Reference Zhang, Yan, Ouyang, Zhang, Yang and Chen2018). The O sheet of MK is dissolved more readily by acid treatment (Saito et al., Reference Saito, Hayashi, Yasumori and Okada1996; Belver et al., Reference Belver, Bañares Muñoz and Vicente2002; Komadel, Reference Komadel2016). Generally, acid treatment not only increased the SSA of MK and reduced its structural Fe content (Jiang et al., Reference Jiang, Wang, Gao, Fu and Yang2021), but also may alter its surface properties such as the formation of Al defect sites (Győrfi et al., Reference Győrfi, Vágvölgyi, Zsirka, Horváth, Szilágyi, Baán, Balogh and Kristóf2020) and an increase in acid sites (Panda et al., Reference Panda, Mishra, Mishra and Singh2010). Consequently, the acid-treatment process exerts a more complex influence on the photocatalytic performance of MK. However, at present, there are few studies that have systematically investigated the influence of the acid treatment on the photocatalytic performance of MK.
In the present study, the MK, obtained through calcination of high-purity Kln at 600°C, was selected as the research subject. The photocatalytic degradation of RhB was employed as a model reaction to investigate systematically the changes in the photocatalytic performance of MK during acid treatment. By analyzing the alterations in the surface structure, light absorption, and photoelectric properties of acid-treated MK, the influence of the surface properties and structural characteristics of MK during the acid treatment on its photocatalytic performance was explored. Based on the experimental results and analysis, a possible photocatalytic enhancement mechanism was proposed.
Materials and methods
Materials
Raw Kln was obtained from Guzhang County Shanlin Shiyu Mineral Products Co., Ltd (Hunan, China). The chemical composition (wt.%) was analyzed by X-ray fluorescence spectrometry (XRF) and was as follows: SiO2 (53.62%), Al2O3 (44.06%), Fe2O3 (0.73%), K2O (0.61%), TiO2 (0.41%), SO3 (0.17%), P2O5 (0.14%), Na2O (0.13%), and MgO (0.06%). Note that the elemental mass fractions obtained by XRF are conventionally reported as their stoichiometrically equivalent oxide forms (e.g. Fe as Fe2O3, Al as Al2O3), in accordance with standard practice for inorganic non-metallic materials. Based on the XRF and X-ray diffraction (XRD) data, the Kln content is estimated at 95.8 wt.%, while the quartz content is 3.2 wt.%. All other reagents were of analytical grade and used as received without further purification. They were purchased from the China Sinopharm Chemical Reagent Co., Ltd.
Preparation of the acid-treated MK samples
A raw Kln sample was calcined at 600°C for 2 h and designated MK. The acid-treatment procedure was conducted as follows (Jiang et al., Reference Jiang, Wang, Gao, Fu and Yang2021): 4.0 g of MK sample was dispersed in 200 mL of 2.0 M HCl solution at 85°C. Samples were collected at intervals of 1, 5, 15, 45 min, and 24 h during the reaction. The acid-treated MK (AMK) samples were separated by centrifugation and then washed twice with deionized water and once with ethanol, and subsequently dried in an oven at 60°C for 12 h. The samples were labeled as AMK-T, where T represents 1, 5, 15, 45 min, and 24 h, respectively. To investigate the amount of free Fe ions, raw Kln (4 g) was dispersed in 200 mL of 0.5 M HCl solution at room temperature. After a 30 min reaction period, the mixture was centrifuged, and the supernatant was collected as the acid-wash solution.
Characterization
Transmission electron microscopy images of the samples were acquired using a JEM-F200 (JEOL Ltd, Tokyo, Japan) microscope operating at 200 kV. The XRD patterns of the products were recorded on a Bruker D8 Advance diffractometer with Ni-filtered Cu-Kα radiation (λ = 1.5406 Å) at 40 kV, 40 mA, over a range of 10–80°2θ (step: 0.01°2θ; velocity employed: 5°2θ min–1).
The optical absorption properties were characterized using a Shimadzu UV-3600 UV-vis spectrophotometer (Japan) equipped with a diffuse reflectance accessory (DRS). The sample was ground and mixed with spectroscopy-grade BaSO4, and then flattened in the mold. Measurements spanned ~200–800 nm (1 nm resolution) with BaSO4 as the reference. A deuterium lamp (~200–350 nm) and tungsten-halogen lamp (~350–800 nm) were used with automatic switching at 350 nm; detection employed a photomultiplier tube (UV) and an InGaAs detector (Vis). Reflectance spectra were converted to absorption via the Kubelka-Munk function: F(R) = (1−R)2/2R.
Fourier transform infrared (FTIR) spectra were collected using a Thermo Fisher Scientific Nicolet iS20 instrument (DTGS detector, spectral range: 4000 to 400 cm–1, spectral resolution: 4 cm–1, number of scans: 32). A mixture was prepared by grinding together thoroughly 2 mg of the MK powder with 200 mg of spectroscopy-grade KBr. The mixture was dried subsequently under an infrared lamp and compressed into a semi-transparent KBr pellet for FTIR analysis.
The SSA was determined using the Brunauer-Emmett-Teller (BET) method with a Micromeritics ASAP 2460 instrument under liquid nitrogen at 77 K.
X-ray photoelectron spectroscopy (XPS) analysis was conducted using a Thermo Scientific K-Alpha spectrometer equipped with an Al Kα monochromated X-ray source at 12 kV, 6 mA. All binding energies were calibrated relative to the C 1s peak at 284.8 eV.
The zeta potential values of samples (0.5 g L−1, 25°C) were measured using the BeNano 90Zeta (Bettersize). The concentrations of Al and Fe ions in the acid rinsing and acid-treatment solutions were quantified by inductively coupled plasma optical emission spectrometry (ICP-OES) using an Agilent 5110 instrument. The analytical wavelengths used for Fe and Al quantification were 238.204 nm and 396.152 nm, respectively. The carrier gas flow rate was set at 0.7 L min⁻¹, and a quartz torch with a 1.0 mm inner diameter injector was employed. Additional detailed parameters including RF power (1.25 kW), plasma gas flow rate (15.0 L min⁻¹), auxiliary gas flow rate (1 L min⁻¹), and radial observation mode were also added to characterize the instrumental conditions fully.
The distribution of Fe and Al species were calculated according to the method used previously (e.g. Jiang et al., Reference Jiang, Wang, Gao, Fu and Yang2021). The total concentrations of Fe and Al ions were determined from the chemical compositions (wt.%) of Kln measured by XRF and designated as FeT and AlT, respectively. The acid-rinsed solution contained all Al (free Al ions and soluble Al oxides) and Fe species (iron oxides as impurity minerals, free Fe ions and iron hydroxides adsorbed onto the surface of Kln), labeled as AlW and FeW, respectively. The acid-treatment solution contained both free Fe species and structural Fe and Al ions released from the O sheet etched by acid treatment, with Fe and Al ion contents in this solution designated as FeA and AlA, respectively. The extremely low concentration of Al ions in the acid-rinsed solution indicated that the O sheet of MK was scarcely affected under acid-washing conditions (Table 1). Therefore, the percentage of free Fe species was calculated as FeW/FeT. The proportion of structural Fe ions in the O sheet was estimated using (FeT − FeW)/FeT. The extent of O-sheet dissolution during acid treatment was estimated based on the leaching proportion of structural Al ions, calculated using the formula: (AlA − Alw)/AlT.
Metal ion concentrations of acid-treated and acid-rinsed solutions and specific surface areas of the AMK-T samples

Table 1. Long description
The table consists of eight columns: Metal ion, Total, Acid-rinsed solution, A M K-1min, A M K-5min, A M K-15min, A M K-45min, and A M K-24h.
* Row 1: F e (mg L super -1). Total: 102.20. Acid-rinsed: 15.537. A M K-1min: 8.929. A M K-5min: 11.990. A M K-15min: 19.261. A M K-45min: 48.171. A M K-24h: 94.079.
* Row 2: A l (mg L super -1). Total: 4665.18. Acid-rinsed: 12.858. A M K-1min: 157.65. A M K-5min: 237.88. A M K-15min: 340.3. A M K-45min: 1678.3. A M K-24h: 4363.9.
* Row 3: A l ion leaching ratio (percent). Acid-rinsed: 0.280. A M K-1min: 3.104. A M K-5min: 4.823. A M K-15min: 7.020. A M K-45min: 35.700. A M K-24h: 93.270.
* Row 4: S S A (m super 2 g super -1). A M K-1min: 19.8. A M K-15min: 51.3. A M K-24h: 406.9. Values for Acid-rinsed, 5min, and 45min are not provided.
Photocatalytic performance tests and active species-capture experiments
In a typical test of photocatalytic performance, the sample (40 mg) was added to 50 mL of a 0.06 mM RhB dye aqueous solution and dispersed ultrasonically. The resulting suspension was then stirred in the dark for 30 min to achieve adsorption/desorption equilibrium. Subsequently, the suspension was irradiated with a 300 W xenon lamp (CEL-HXF300, λ ≥ 400 nm, light intensity of 190 mW cm–2). Aliquots of 2 mL were collected at regular intervals, centrifuged, and the supernatant was separated. A 0.5 mL aliquot of the supernatant was diluted to 3 mL, and its absorption spectrum was measured using a UV-Vis spectrophotometer (Beijing Rayleigh, UV-1801). The evolution of the UV-Vis absorption spectra of RhB was checked to assess photocatalytic performance. During the photocatalytic degradation of RhB, N-de-ethylation leads to a hypsochromic shift in the maximum absorption peak of the reaction solution (Wu et al., Reference Wu, Liu, Zhao, Hidaka and Serpone1998; Saison et al., Reference Saison, Chemin, Chanéac, Durupthy, Ruaux, Mariey, Maugé, Beaunier and Jolivet2011). The absorbance at the characteristic absorption peak was extracted from time-resolved UV-Vis absorption spectra of the RhB solution under photocatalytic reaction conditions.
To investigate the reactive oxygen species (ROS) involved in the photocatalytic degradation process, 0.54 mg of benzoquinone (BQ), 1.6 g of methanol (MeOH), 8.5 mg of silver nitrate (AgNO3), and 3 g of isopropanol (IPA) were added to the photocatalytic performance experiments as scavengers for superoxide radicals (·O2–), photogenerated holes, photogenerated electrons, and hydroxyl radicals (·OH), respectively.
Photoelectrochemical measurements
The photocurrent measurements were conducted using a standard three-electrode system on a CHI760E electrochemical workstation. The reference electrode was Ag/AgCl, the counter electrode was Pt foil, and the working electrode was indium tin oxide (ITO) conductive glass coated with the sample. A 0.1 M Na2SO4 solution served as the electrolyte, and the photocurrent was measured at a bias of 0.1 V. The working electrode preparation involved ultrasonically dispersing 10 mg of Kln sample in 1 mL of ethanol, followed by adding 50 μL of Nafion solution to form a homogeneous suspension. Subsequently, 100 μL of this suspension was drop-cast onto the ITO glass and dried at room temperature. All experiments were performed using a 300 W Xe lamp (CEL-HXF300, λ ≥ 400 nm) as the light source.
Results and Discussion
Influence of acid treatment on the surface structure and properties of MK
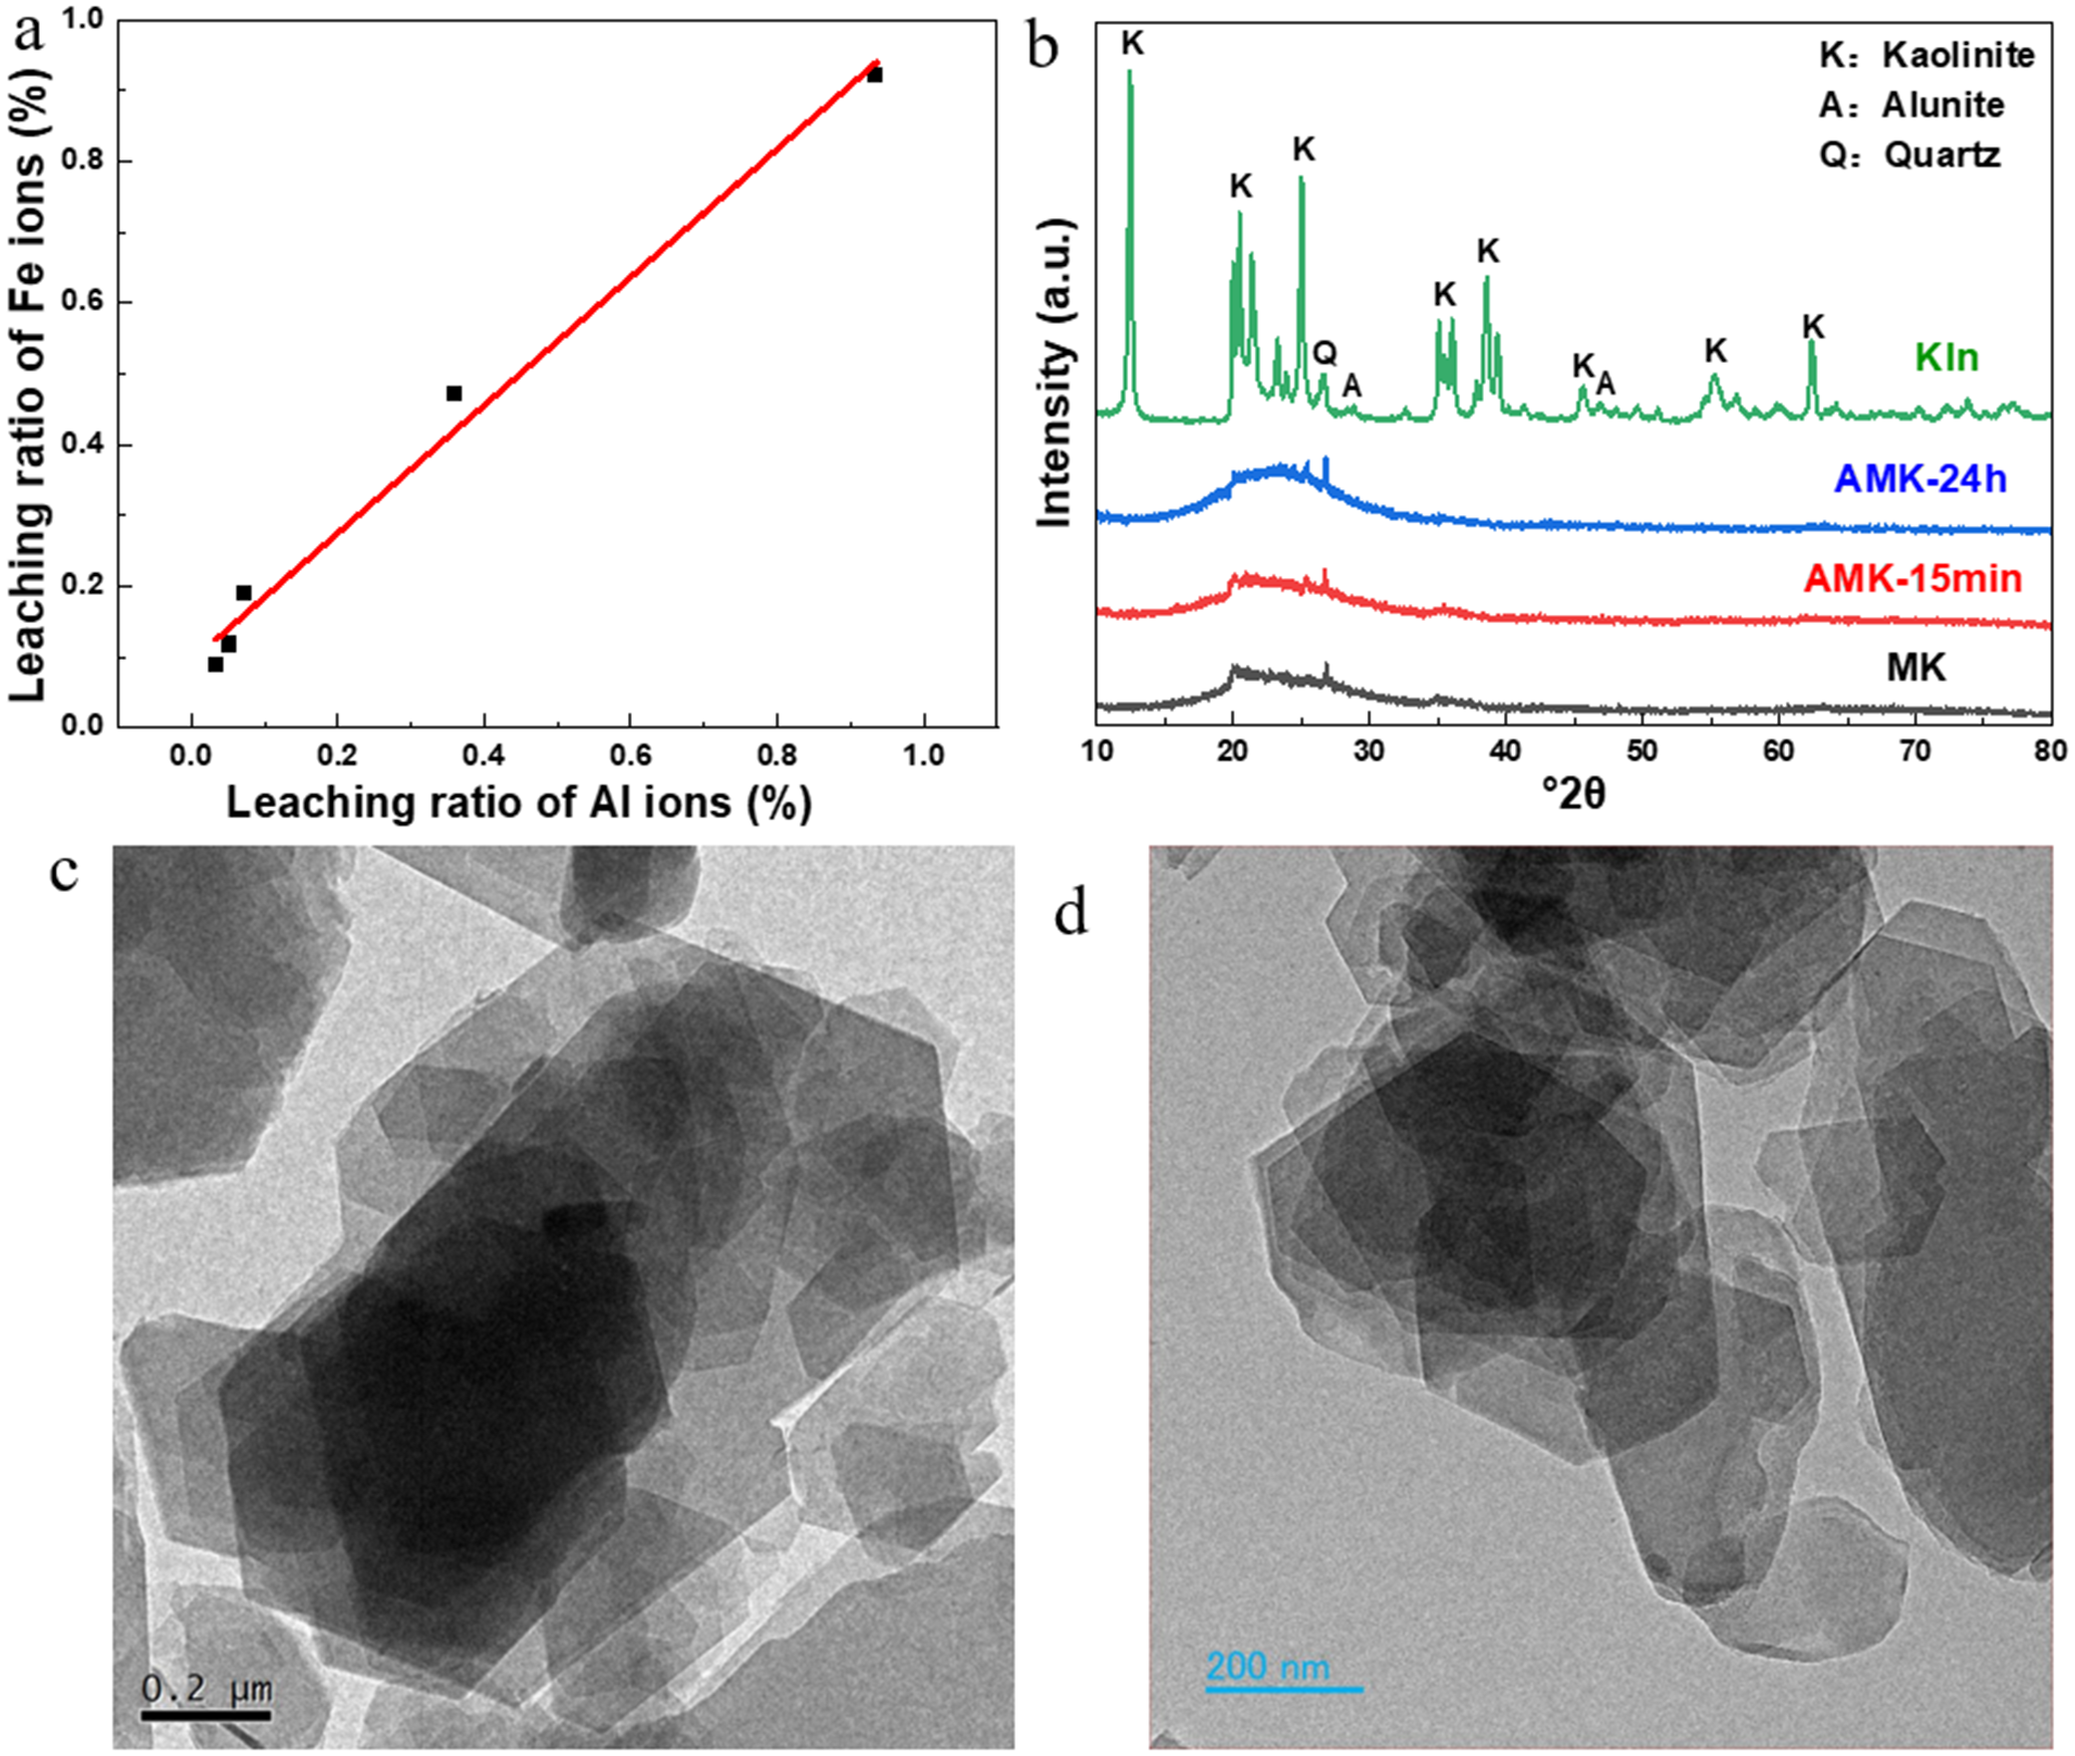
The visible-light photocatalytic performance of Kln is influenced significantly by the presence of iron-species impurities present in Kln. These iron species consist primarily of iron oxides as impurity minerals, free Fe ions and iron hydroxides adsorbed onto the surface of Kln, and structural Fe incorporated within the aluminosilicate lattice (Zhou et al., Reference Zhou, Jiang, Jing, Yin and Li2024). Theoretically, impurity minerals of iron oxide, free Fe ions, and iron hydroxides can all be removed via simple acid rinsing. The Fe species that can be eliminated through acid rinsing are referred to as ‘free Fe species’, whereas the Fe doped into the lattice is termed ‘structural Fe species’. The distribution of Fe species was estimated through the analysis of the concentrations of Fe and Al ions in the acid-treated and acid-rinsed solutions (Table 1). The structural Fe species accounted for ~85% of the MK sample used in this study, indicating a dominant role of structural Fe among the Fe species in the MK sample. This finding aligned well with our previous research (Jiang et al., Reference Jiang, Wang, Gao, Fu and Yang2021). According to the leaching proportion of structural Al ions, the proportion of acid-etched O sheet was estimated (Jiang et al., Reference Jiang, Wang, Gao, Fu and Yang2021). Within 5 min of acid treatment, <5% of the O sheet was etched. For the samples acid-treated for 45 min and 24 h, the proportions of the etched O sheet were ~36% and 93%, respectively. As shown in Fig. 1a, the upward deviation of the first three data points (acid-treatment time ≤15 min) from the linear fit indicated the presence of trace soluble iron oxide impurities in the sample (Bahranowski et al., Reference Bahranowski, Serwlcka, Stoch and Strycharski1993). The linear relationship between Al and Fe ions in the acid-treated solution indicated that Fe ions were leached in proportion with structural Al. This finding not only confirmed the presence of structural Fe in the sample but also demonstrated that structural Fe was the predominant iron species among all Fe species.
(a) The relationship between the leaching ratio of Al and Fe ions in acid leaching solution (percentage of total Al or Fe in the original sample); (b) XRD patterns of various samples; (c–d) TEM images of (c) the MK; and (d) AMK-24h samples.

Figure 1. Long description
Panel a is a line graph with the x-axis labeled Leaching ratio of A l ions percentage and the y-axis labeled Leaching ratio of F e ions percentage. A red line shows a strong positive linear correlation through black data points ranging from 0.0 to 1.0 on both axes.
Panel b is an X R D plot showing Intensity in arbitrary units versus 2 theta from 10 to 80 degrees. Four stacked patterns are shown from top to bottom. The top green curve labeled K l n shows sharp peaks labeled K for Kaolinite, A for Alunite, and Q for Quartz. The lower three curves labeled A M K-24h in blue, A M K-15min in red, and M K in black show broad amorphous humps between 20 and 30 degrees with significantly reduced peak intensities.
Panel c is a T E M micrograph of M K showing large, overlapping hexagonal plate-like structures with a scale bar of 0.2 micrometers.
Panel d is a T E M micrograph of A M K-24h showing similar hexagonal plates that appear slightly more disordered or fragmented compared to panel c, with a scale bar of 200 nanometers.
As can be seen from the XRD patterns of the samples (Fig. 1b), the XRD pattern of the raw Kln indicated that it included just a minor amount of quartz and alunite, and no other iron oxide was detected. This result was in accordance with the XRF data. Note that all unmarked peaks in the XRD pattern of raw Kln correspond exclusively to kaolinite reflections. For improved clarity and visual readability, only the strongest and most diagnostic kaolinite peaks have been labeled. In comparison with the raw Kln sample, the XRD pattern of the MK sample did not display characteristic diffraction peaks of Kln but merely exhibited a broad diffraction peak within the range 20–30°2θ. This is due to the fact that the crystal structure of raw Kln was disrupted during the calcination process at 600°C, resulting in transformation into amorphous MK (Zhang et al., Reference Zhang, Yan, Ouyang, Zhang, Yang and Chen2018). The XRD pattern of the MK acid-treated for 15 min (AMK-15min) was nearly identical to that of the MK, indicating that the O sheet of the AMK-15min sample was not damaged significantly. This finding was consistent with the data of the acid-treatment experiments (Table 1). The full width at half-maximum (FWHM) of the broad diffraction peak of the AMK-24h sample was 8.6°2θ, which was slightly larger than that of the AMK-15min sample (8.0°2θ). The broad diffraction peak in the XRD pattern of AMK-24h exhibited more distinct amorphous characteristics, which can be ascribed to the substantial removal of the O sheet during the acid-treatment process. As the acid treatment time increased, the SSA of the AMK samples also increased gradually (Table 1). Compared with the MK (15.9 m2 g–1) sample, the SSA of the AMK-1min sample increased slightly (19.8 m2 g–1), while that of AMK-15min was 3.2 times greater. After 24 h of acid treatment, the SSA of AMK-24h reached 25.6 times that of the MK sample.
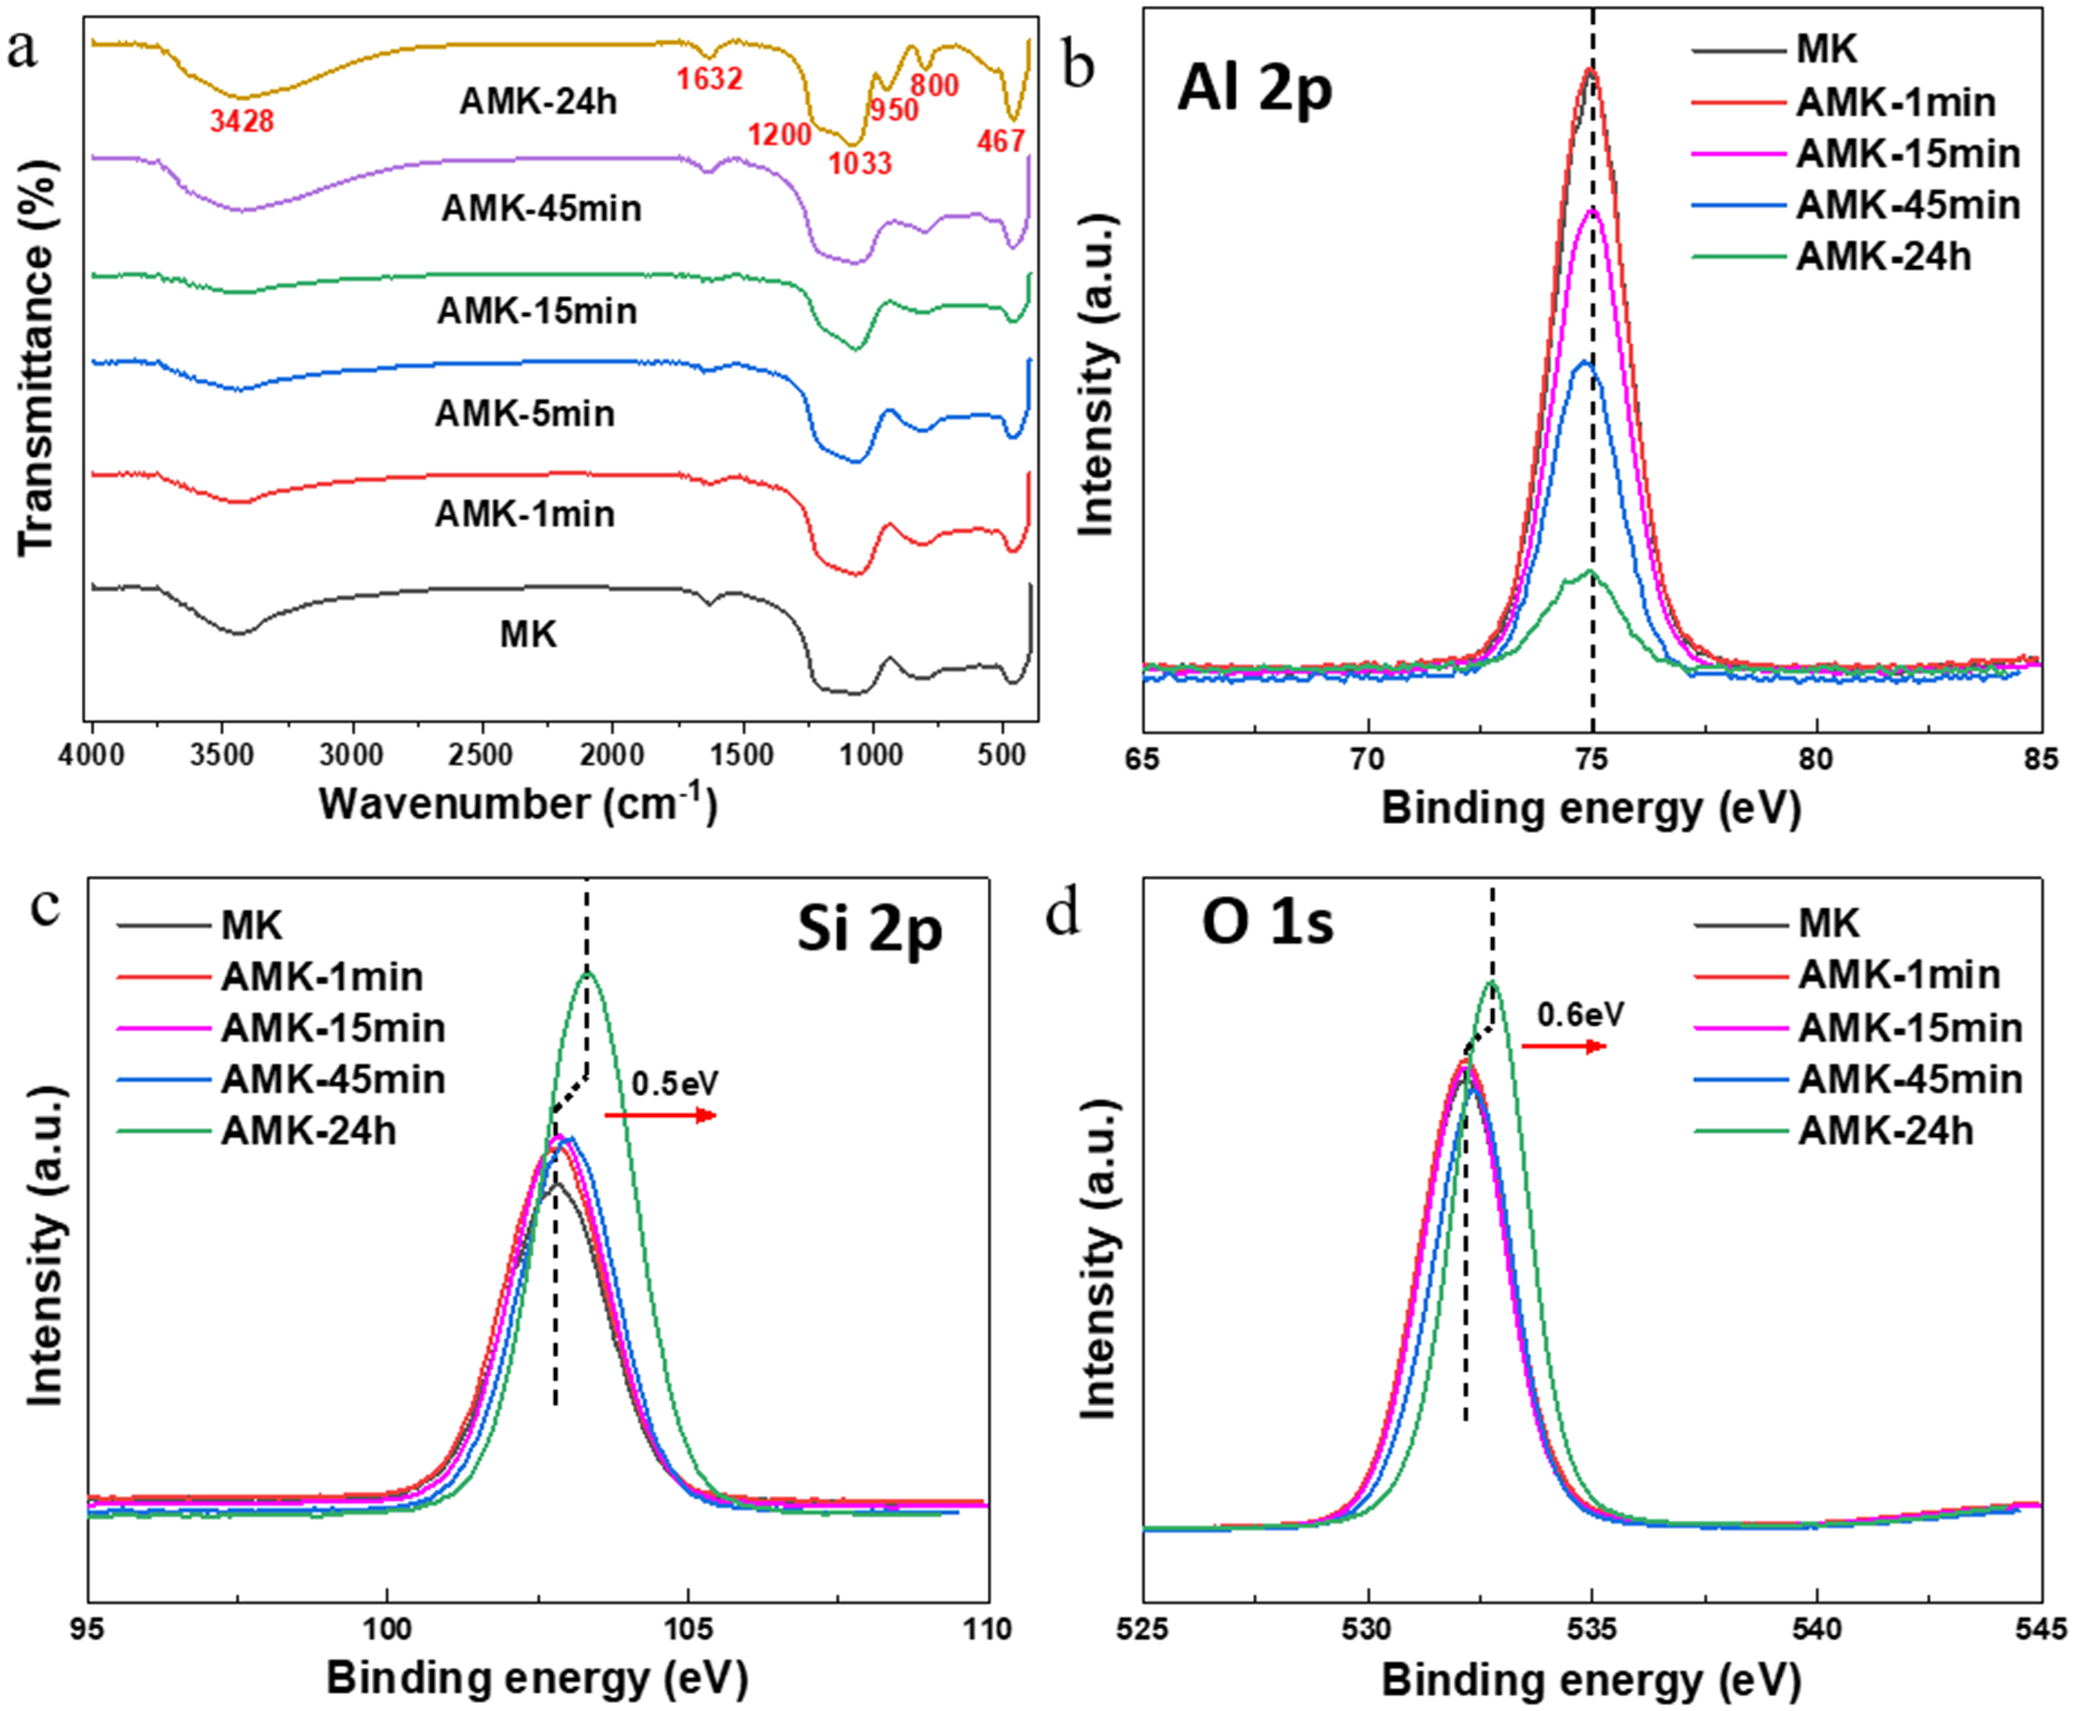
Fourier transform infrared spectroscopy was employed to investigate the changes in functional groups of the acid-treated MK samples (Fig. 2a). The absorption peaks at 3428 and 1632 cm–1 are probably attributable to the adsorbed water (Frost et al., Reference Frost, Makó, Kristóf, Horváth and Kloprogge2001), which may have formed due to rapid water adsorption from the air during sample storage or KBr pellet preparation (e.g. moisture uptake during grinding or pressing). The broadened absorption peak between 1200 and 1033 cm–1 corresponded to the stretching vibration of Si–O bonds (Volzone and Ortiga, Reference Volzone and Ortiga2011), while the peak at 800 cm–1 was associated with the vibration of Si–O–Si and Si–O–Al bonds. In addition, the absorption peak at 467 cm–1 was due to the bending vibration of Si–O bonds. For the AMK-24h sample, the enhanced intensities of the absorption peaks at 800 and 467 cm–1, along with the appearance of a new band at 950 cm–1 might all be attributed to the enrichment of silicon-oxygen on the Kln surface resulting from de-alumination during acid treatment (Temuujin et al., Reference Temuujin, Burmaa, Amgalan, Okada, Jadambaa and MacKenzie2001; Zhang et al., Reference Zhang, Yan, Ouyang, Zhang, Yang and Chen2018; Chari et al., Reference Chari, Heimann, Rosenzweig, Bennett and Faber2023). This result also suggested the preservation of the T sheet integrity after complete etching of the O sheet for the AMK-24h sample (Li et al., Reference Li, Zhaoping and Li2017). Furthermore, the pseudo-hexagonal flake morphology of the sample after 24 h acid treatment remained well preserved (Fig. 1c,d), further indicating that the T sheet of the AMK-24h sample remained intact. This result was consistent with previous reports (Yan et al., Reference Yan, Fu, Zuo and Yang2018; Zhang et al., Reference Zhang, Yan, Ouyang, Zhang, Yang and Chen2018).
(a) FTIR and (b–d) XPS spectra of (b) Al 2p, (c) Si 2p and (d) O 1s of the AMK-T samples.

Figure 2. Long description
The figure consists of four panels labeled a through d.
* Panel a: A line graph of F T I R spectra. The y-axis is Transmittance in percent and the x-axis is Wavenumber in inverse centimeters from 4000 to 400. Six curves are stacked vertically, labeled from top to bottom as A M K-24 h, A M K-45 min, A M K-15 min, A M K-5 min, A M K-1 min, and M K. The top curve A M K-24 h has red numerical labels at specific troughs: 3428, 1632, 1200, 1033, 950, 800, and 467.
* Panel b: X P S spectrum for Al 2 p. The y-axis is Intensity in arbitrary units and the x-axis is Binding energy in e V from 65 to 85. A vertical dashed line is at 75 e V. Five curves for M K and A M K samples show a single peak centered at 75 e V, with the intensity decreasing as the reaction time increases from 1 minute to 24 hours.
* Panel c: X P S spectrum for Si 2 p. The y-axis is Intensity and the x-axis is Binding energy from 95 to 110 e V. A vertical dashed line marks the peak for M K. A red arrow points right, indicating a shift of 0.5 e V toward higher binding energy for the A M K-24 h sample.
* Panel d: X P S spectrum for O 1 s. The y-axis is Intensity and the x-axis is Binding energy from 525 to 545 e V. A vertical dashed line marks the peak for M K. A red arrow points right, indicating a shift of 0.6 e V toward higher binding energy for the A M K-24 h sample.
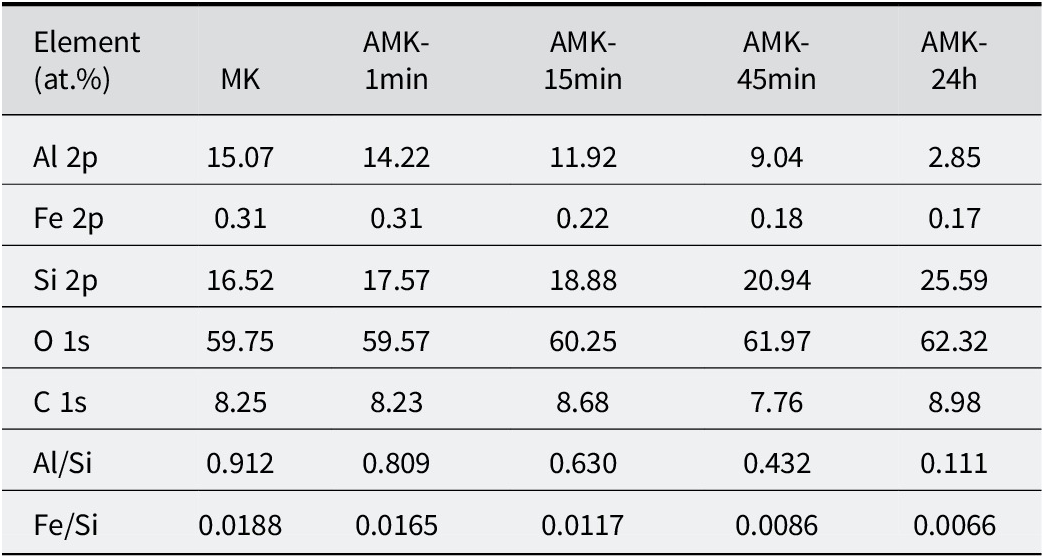
To further investigate the influence of acid treatment on the surface structure of Kln samples, the chemical states of surface elements in the AMK-T samples were examined using XPS (Fig. 2). The binding energies of Al 2p, Si 2p, and O 1s in the XPS spectrum of the MK samples were located at 75.0, 102.8, and 532.2 eV, respectively. Compared with MK, the binding energies of Al 2p, Si 2p, and O 1s in the AMK-1min sample did not exhibit significant shifts, indicating that short-term acid treatment had minimal impact on the surface properties of MK. For the Al 2p peak of samples acid treated for >45 min (Fig. 2a), although the peak displacement was not obvious, the relative peak intensity decreased significantly, suggesting substantial erosion of the O sheets. For the Si 2p and O 1s peaks of AMK samples acid-treated for >45 min, the binding energies shifted significantly toward greater values. Specifically, the Si 2p and O 1s binding energies of the AMK-24h sample shifted toward larger binding energies by 0.5 and 0.6 eV, respectively. This shift may be attributed to a significant decrease in electron density on the T sheets following the removal of the O sheets (Jiang et al., Reference Jiang, Liu, Fu and Yang2020). Based on the XPS data obtained from AMK-T samples, the relative atomic concentrations of Al, Si, and Fe elements were compared (Table 2). The relative concentrations of Al and Fe elements can be characterized effectively by the Al/Si and Fe/Si atomic ratios. With increasing acid treatment time, the Al/Si ratio of AMK-T samples exhibited a gradual decline, suggesting progressive dissolution of the O sheet by HCl. Furthermore, the Fe/Si ratio and Al/Si ratio exhibited a nearly proportional decline. These findings are consistent with the results derived from the measurement of Al and Fe ion concentrations in the acid treatment solution (Fig. 1a). High-resolution Fe 2p XPS spectra of the MK and AMK-T samples showed Fe 2p3/2 and Fe 2p1/2 peaks at 712.2–712.7 eV and 724.7–726.3 eV, respectively (Fig. S2 and Table S1, Supplementary material). These binding energies were significantly greater than those of common iron oxides (Yamashita and Hayes et al., Reference Yamashita and Hayes2008). This upshift arises from the stronger electrostatic interaction between Fe and the surrounding oxygen framework in the kaolinite lattice (compared with iron oxides). This result also suggested that the Fe species in the sample were mainly structural Fe rather than iron-oxide impurities.
The relative atomic proportions of various elements in the XPS data of the AMK-T samples

Table 2. Long description
The table consists of 6 columns and 8 rows. The columns are labeled: Element (at.%), M K, A M K-1min, A M K-15min, A M K-45min, and A M K-24h.
* Al 2p: Values decrease from 15.07 in M K to 2.85 in A M K-24h.
* Fe 2p: Values decrease from 0.31 in M K to 0.17 in A M K-24h.
* Si 2p: Values increase from 16.52 in M K to 25.59 in A M K-24h.
* O 1s: Values increase from 59.75 in M K to 62.32 in A M K-24h.
* C 1s: Values fluctuate between 7.76 and 8.98 across all samples.
* Al/Si ratio: Shows a significant linear decrease from 0.912 in M K to 0.111 in A M K-24h.
* Fe/Si ratio: Shows a linear decrease from 0.0188 in M K to 0.0066 in A M K-24h.
The light-absorption and photoelectric properties of acid-treated MK
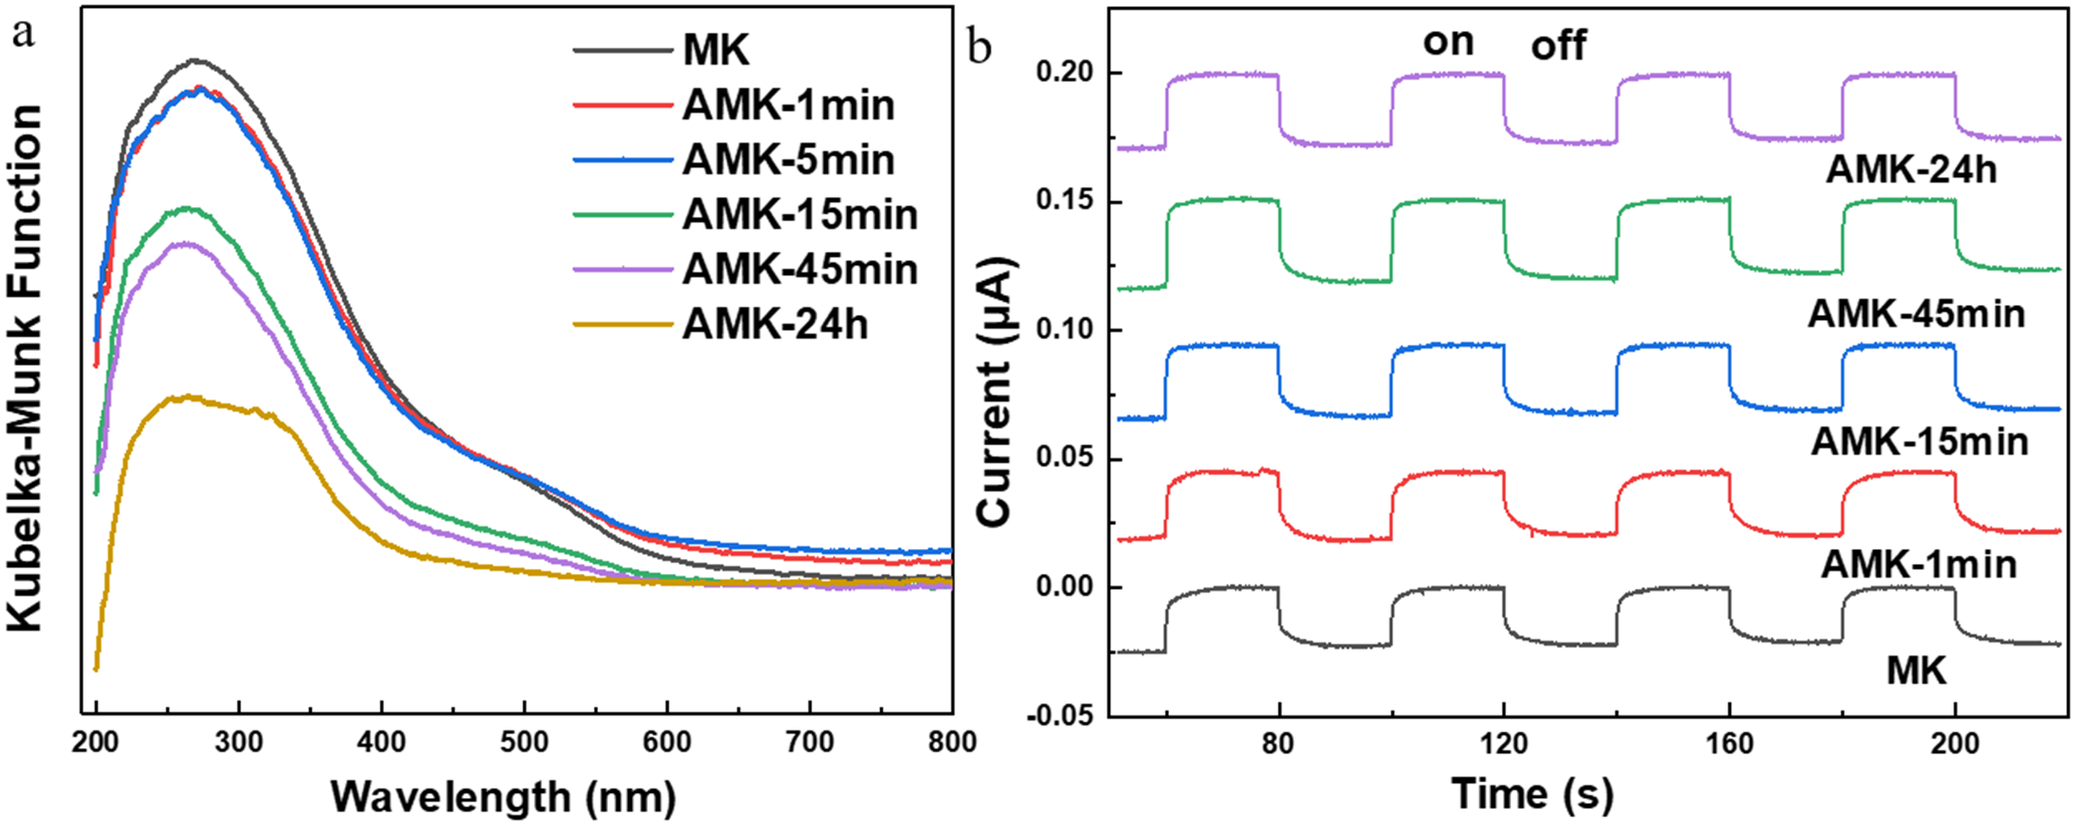
The light-absorption properties of the AMK samples were investigated using UV-Vis absorption spectroscopy (Fig. 3a). Both the MK and AMK-T samples exhibited significant light absorption in both the UV and visible regions. Specifically, the UV absorption peaks at ~210 nm and 250 nm were attributed primarily to interband transitions, which were responsible for the intrinsic light absorption of the aluminosilicate. The absorption band in the region of ~300–400 nm corresponded to charge transfer from coordinated oxygen to metal (Fu et al., Reference Fu, Yang, Hu, Wu and Navrotsky2017), characteristic of the aluminosilicate structure of Kln. In the visible region, the absorption peak between ~500 and 550 nm can be attributed to intraband d–d transitions (Fu et al., Reference Fu, Yang, Hu, Wu and Navrotsky2017), associated with structural Fe in Kln and iron oxide impurities. Compared with the MK sample, the absorption spectra of the AMK-1min and AMK-5min samples showed minimal changes, indicating that their light-absorption properties remained largely unchanged. However, for the AMK samples acid-treated for >15 min, the peak intensities of the absorption bands in both the UV and visible regions decreased markedly. This result confirmed the dominant role of the O sheet in the light absorption performance of MK.
(a) UV-vis diffuse reflectance spectrum and (b) transient photocurrent responses of the AMK-T samples.

Figure 3. Long description
Panel a is a line graph showing Kubelka-Munk Function on the y-axis versus Wavelength in nanometers on the x-axis from 200 to 800. Six curves are plotted for samples M K, A M K-1min, A M K-5min, A M K-15min, A M K-45min, and A M K-24h. All curves show a broad peak between 200 and 400 nanometers. The intensity of the Kubelka-Munk Function generally decreases as the treatment time increases, with M K having the highest peak and A M K-24h having the lowest.
Panel b is a transient photocurrent response graph showing Current in micro-Amperes on the y-axis versus Time in seconds on the x-axis from 60 to 220. The graph features five vertically stacked square-wave plots corresponding to light ‘on’ and ‘off’ cycles. From bottom to top, the plots are labeled M K, A M K-1min, A M K-15min, A M K-45min, and A M K-24h. Each plot shows a sharp increase in current when the light is turned on and a sharp decrease when turned off. The baseline and peak current levels shift upward as the sample treatment time increases, indicating higher photocurrent responses for longer-treated A M K samples.
To investigate the photoelectrochemical performance of the samples, transient photocurrent measurements were conducted under visible light illumination (Fig. 3b). The photocurrent of the MK sample was ~30 nA. The photocurrents for the AMK samples acid-treated for 1, 15, 45 min, and 24 h were ~33, 35, 39, and 35 nA, respectively. Generally, the photoelectric response of the photocatalyst is closely related to the generation and transport capacity of the photogenerated charge. The photogenerated charge-generation capacity of Kln was related directly to the amount of structural Fe species, and the photogenerated charge-transport capacity is mainly related to the SSA of Kln (Jiang et al., Reference Jiang, Wang, Gao, Fu and Yang2021). As acid treatment progresses, the SSA of the AMK samples increased substantially, enhancing the transfer of photogenerated charge and leading to improved photocurrent. However, when the acid-treatment time reached 45 min, the significant reduction in structural Fe content led to a marked decrease in photogenerated charge generation, resulting in a decline in photocurrent.
Photocatalytic performances of acid-treated MK
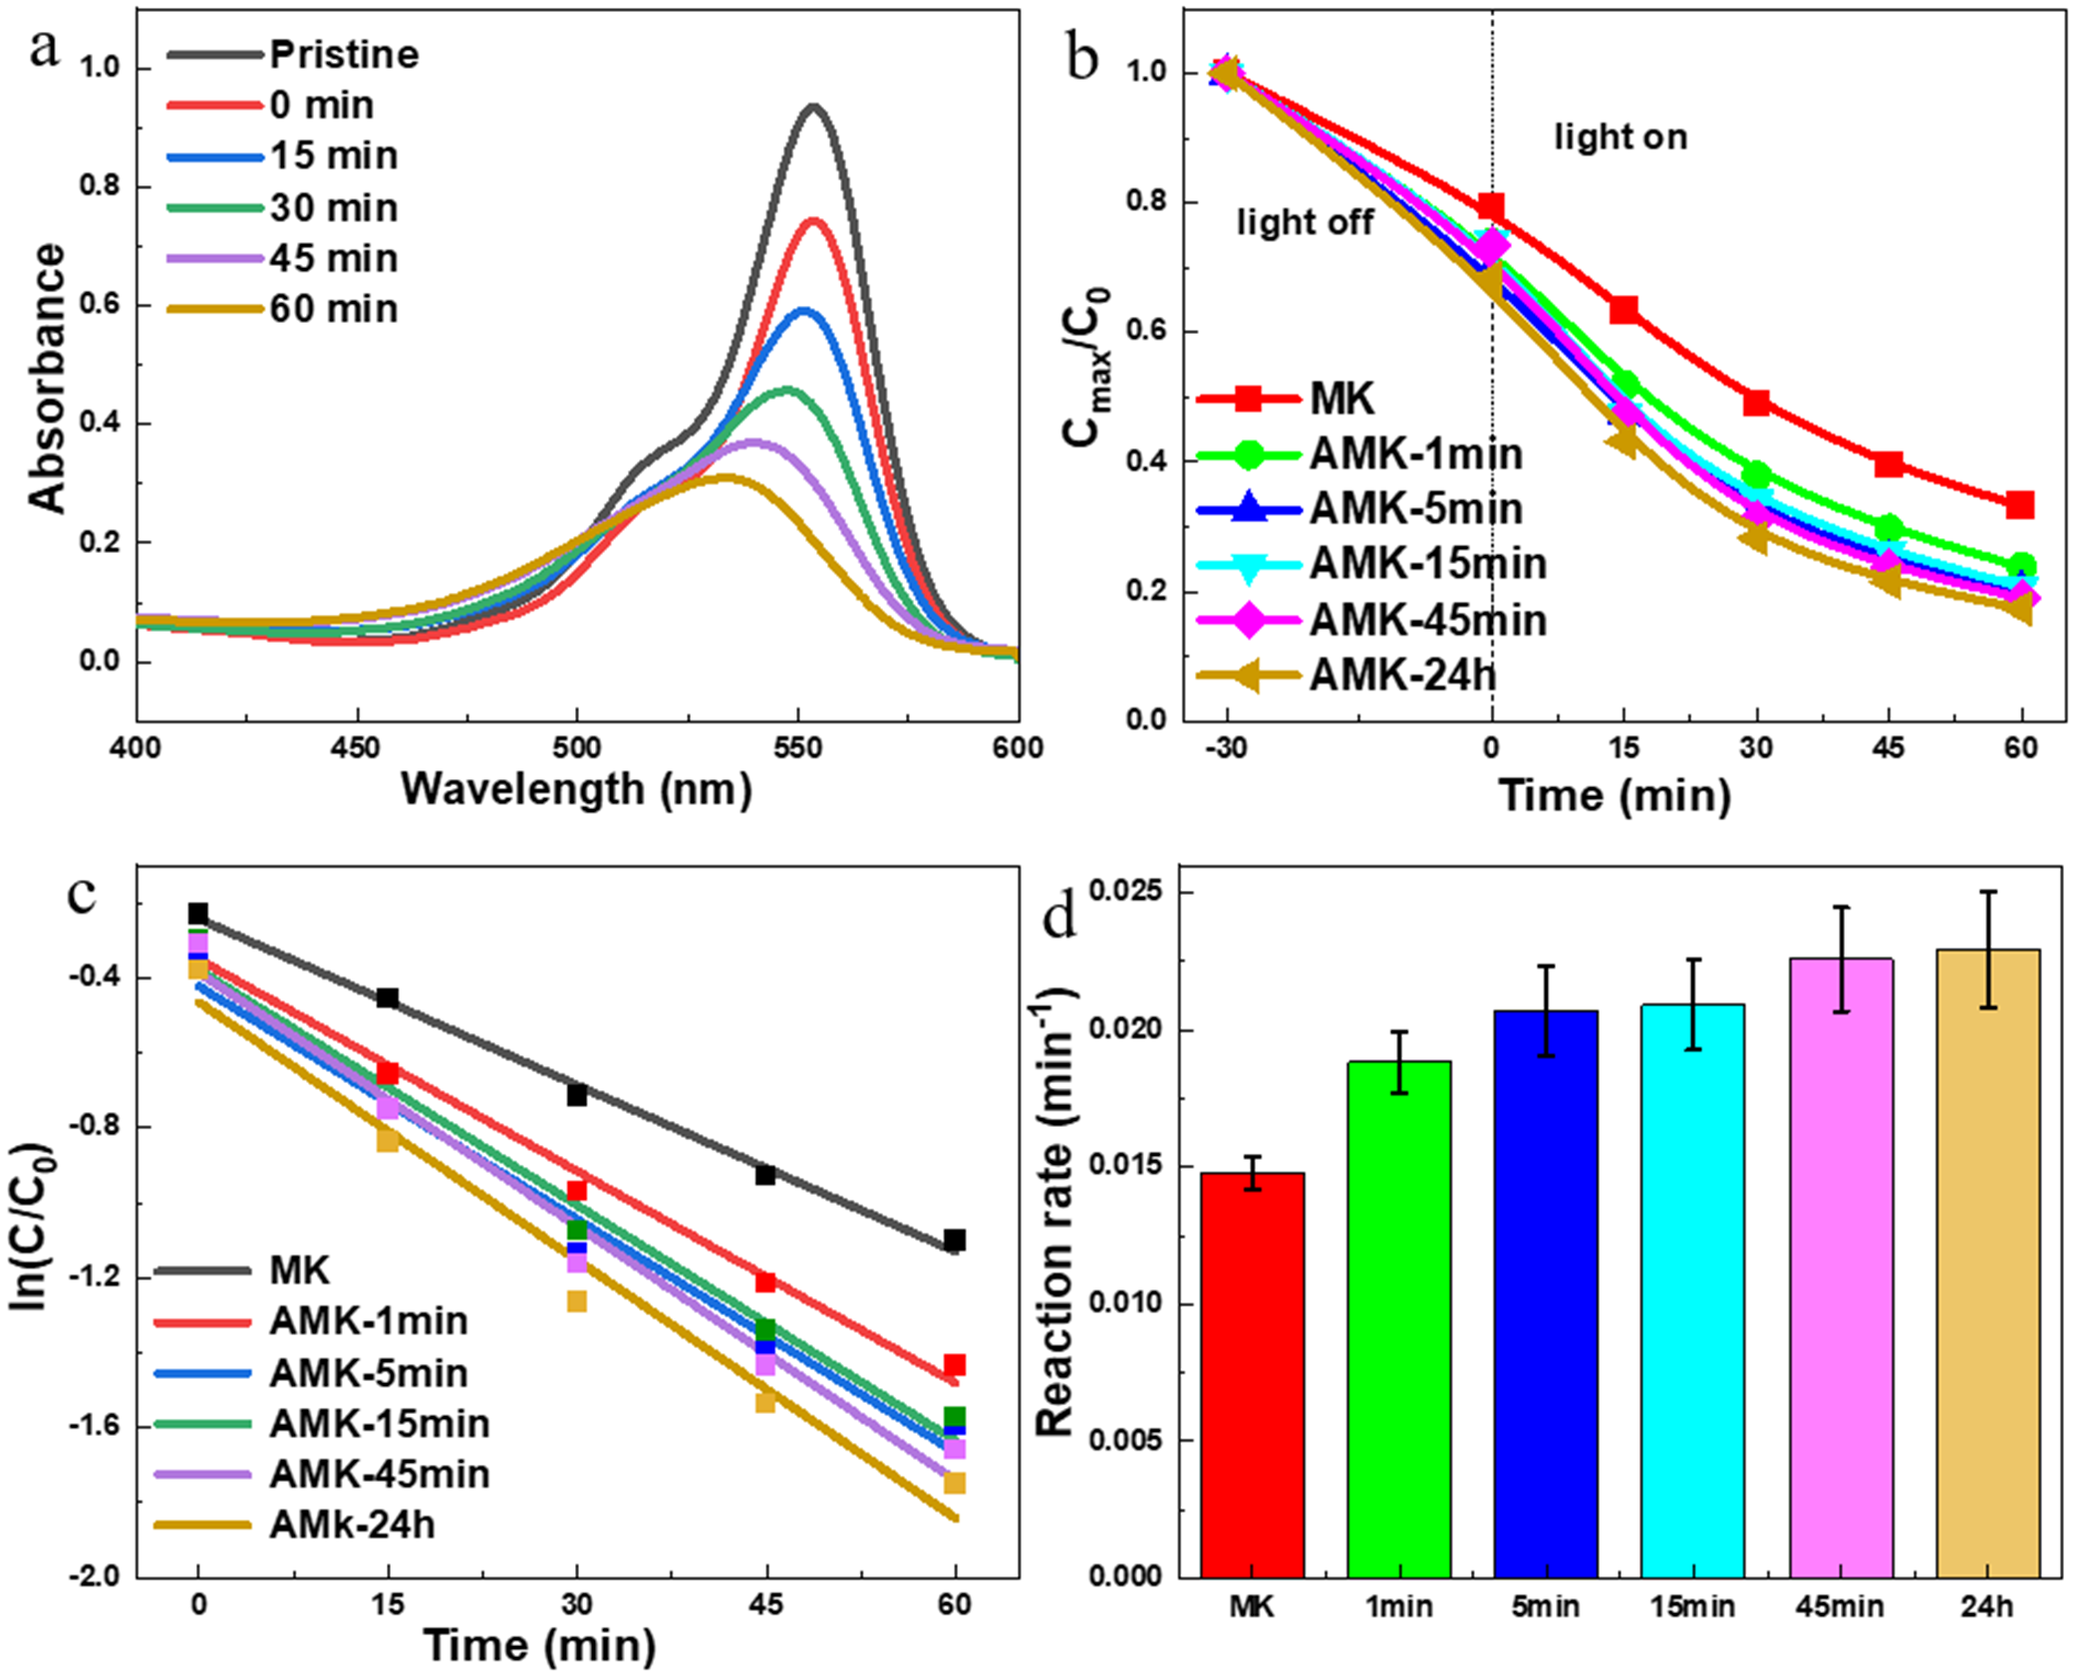
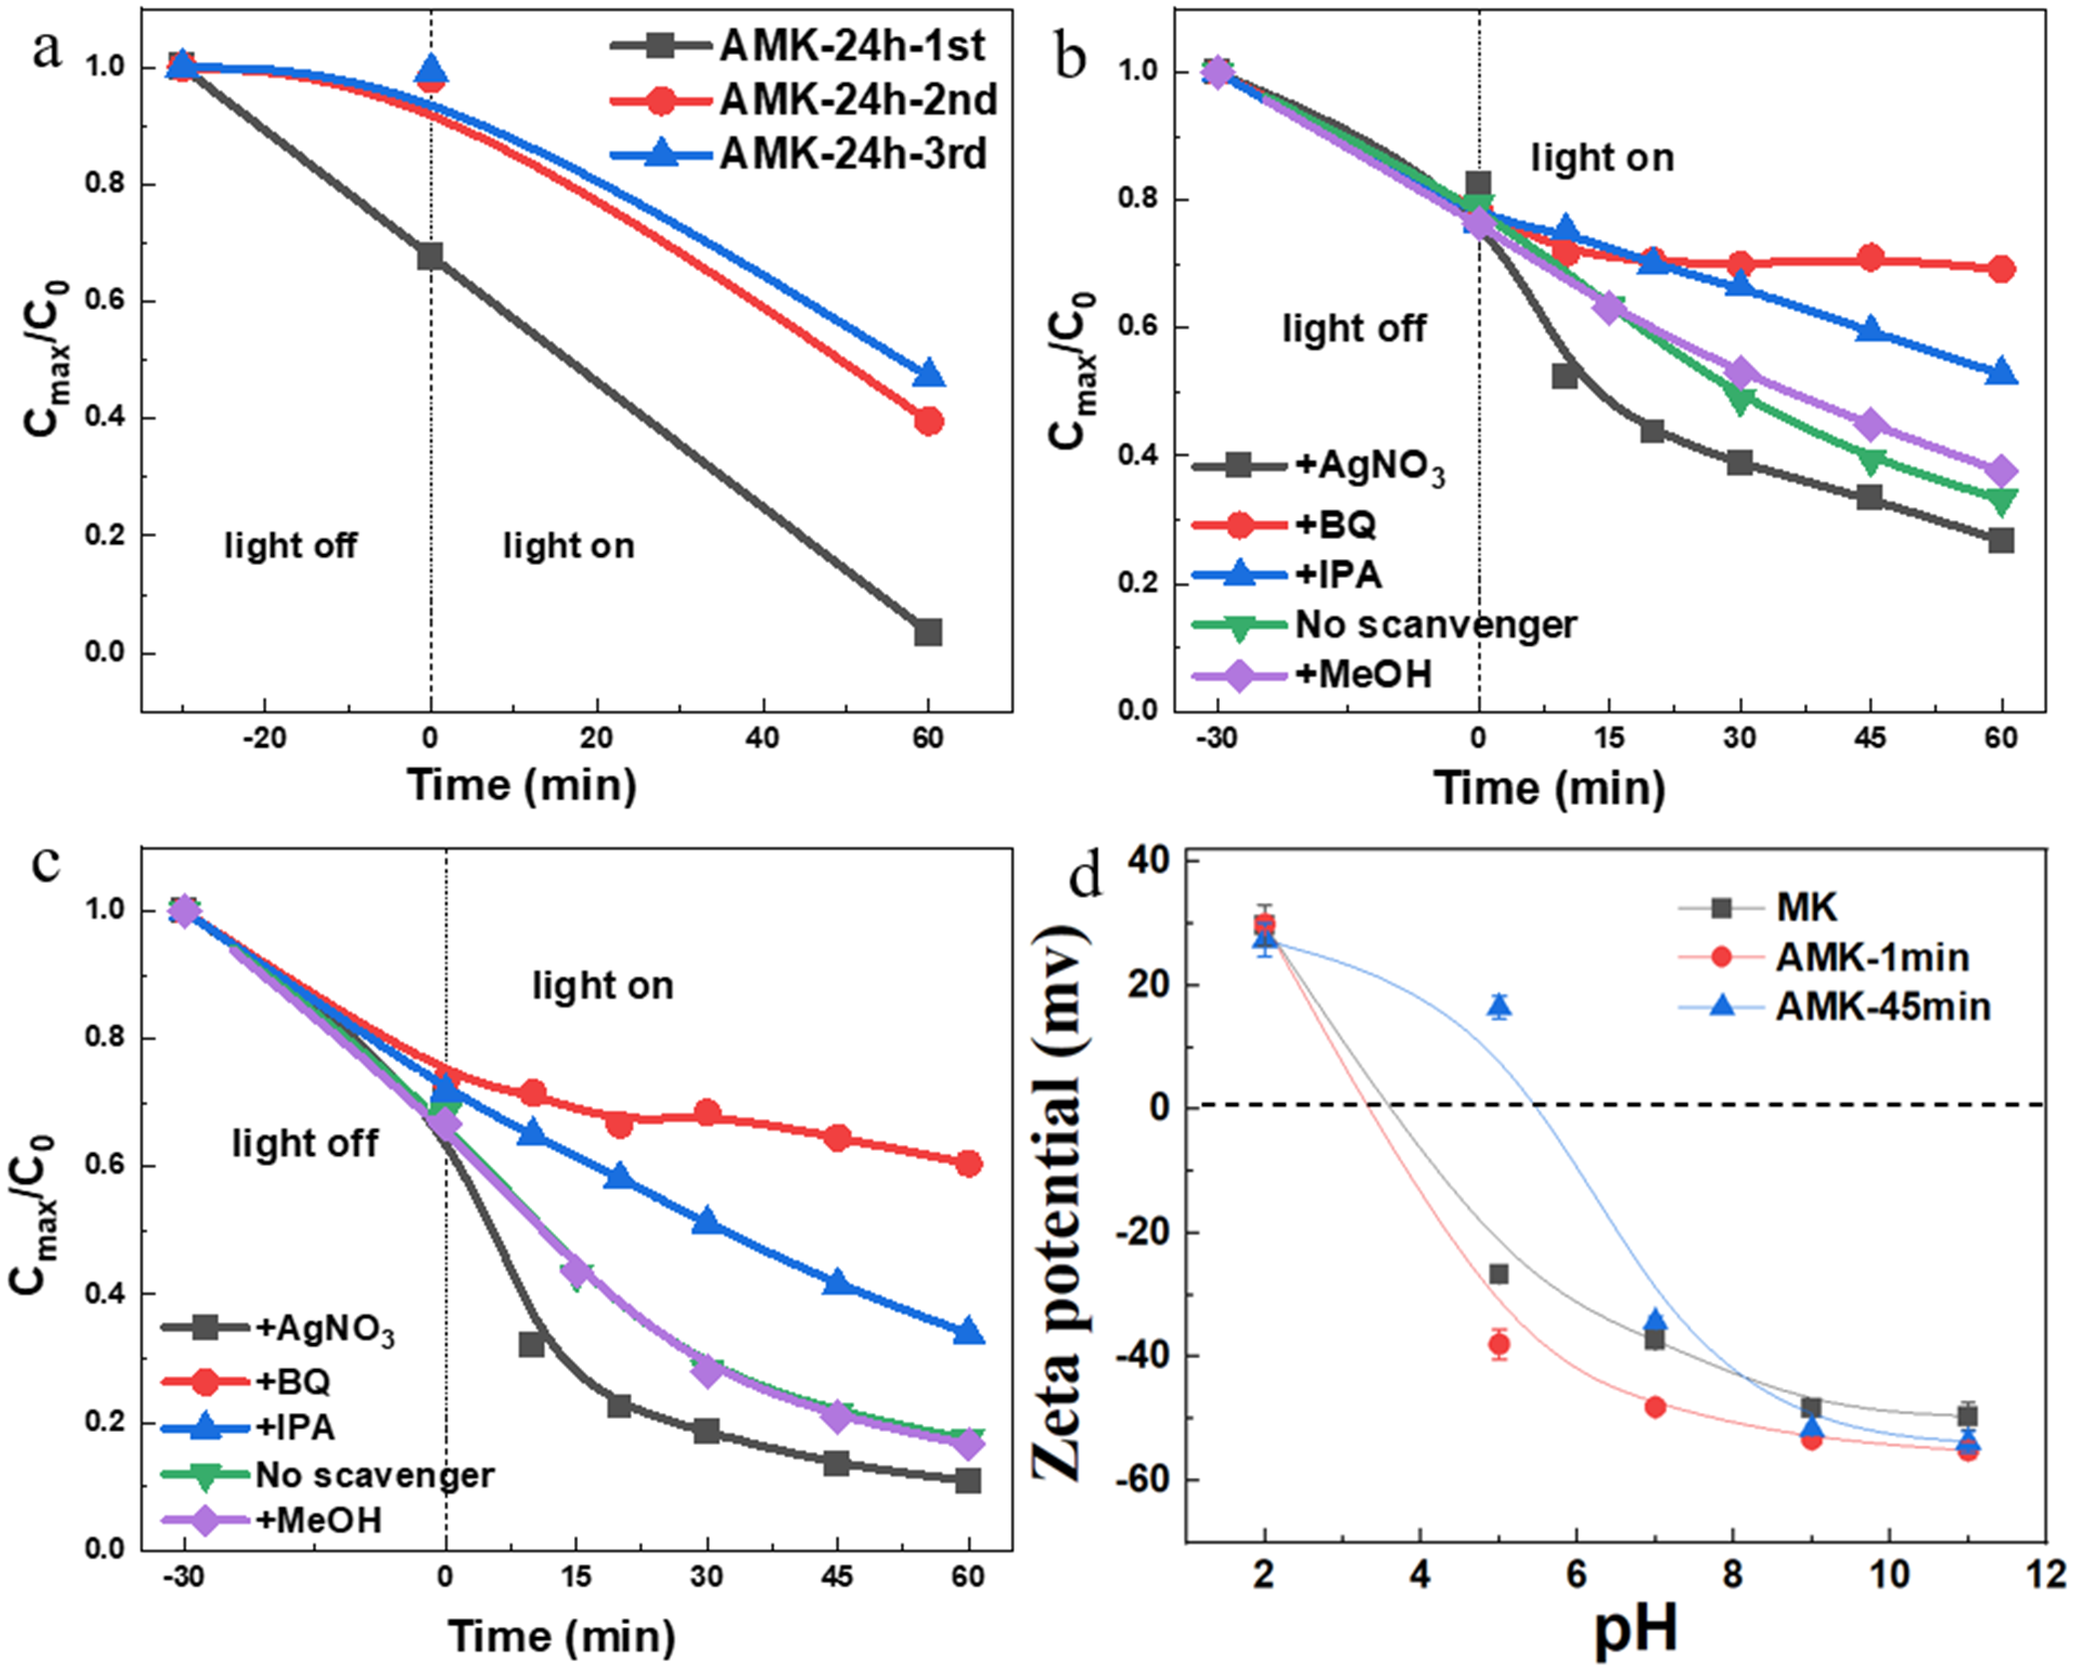
The photodecomposition of RhB dye was utilized to investigate the photocatalytic performance of the acid-treated Kln samples under visible-light irradiation. The MK sample photodegraded by ~46% of RhB within 60 min (Fig. 4a,b). The photocatalytic degradation performances of RhB in the presence of AMK-T samples were enhanced significantly (Fig. 4c,d). Specifically, compared with the MK sample, the photocatalytic degradation rates of RhB for the AMK-1, -5, -15, -45min, and -24h samples increased by 27%, 40%, 42%, 53%, and 55%, respectively. To eliminate the influence of adsorption on the photocatalytic process after 30 min of dark adsorption, an extended dark adsorption experiment (up to 90 min) was performed on the AMK-24h sample. As shown in Fig. S2 (Supplementary material), no statistically significant difference was observed between the adsorption uptake at 30 min and that at 90 min, confirming that adsorption equilibrium was fully established within 30 min. Furthermore, the cyclic photodegradation experiment results demonstrated that the AMK-24h sample retained >80% of its initial photocatalytic degradation efficiency after three cycles (Fig. 5a), indicating its excellent photocatalytic stability. Note that the photocatalytic degradation kinetics were not discernible in the first cycle, owing to the limited sampling (only two data points after dark adsorption and after 60 min of irradiation) and the strong adsorption of RhB by fresh samples under dark conditions. According to the data from the photodegradation experiments of AMK-T samples, two key conclusions can be drawn. First, short-term acid treatment markedly enhanced the photocatalytic performance of the MK sample. Second, while the photocatalytic performance improved with increasing acid treatment time, no significant enhancement was observed after 45 min of treatment.
(a) Time-dependent absorption spectra of RhB in the presence of MK samples; (b) photodegradation curves of RhB in the presence of the AMK-T samples; (c) intrinsic photodegradation rates for RhB degradation; (d) comparison with photodegradation rates of the AMK-T samples.

Figure 4. Long description
Panel a is a line graph of Absorbance versus Wavelength in n m from 400 to 600. A major peak at 554 n m decreases in intensity over time from Pristine to 60 minutes. The curves shift downward as time increases.
Panel b is a line graph of C max over C sub 0 versus Time in minutes from negative 30 to 60. A vertical dashed line at time 0 separates light off and light on phases. All samples show a decrease in concentration, with A M K 24 h showing the steepest decline and M K showing the slowest. Samples include M K, A M K 1 min, A M K 5 min, A M K 15 min, A M K 45 min, and A M K 24 h.
Panel c is a linear kinetic plot of natural log of C over C sub 0 versus Time in minutes. Six linear regression lines with negative slopes represent the degradation rates. The slopes become steeper from M K to A M K 24 h.
Panel d is a bar chart of Reaction rate in min super minus 1. Six colored bars represent the samples. The rates increase progressively from M K at approximately 0.015 to A M K 24 h at approximately 0.023. Error bars are present on each bar.
(a) Cyclic photodegradation curves of RhB in the presence of the AMK-24h sample, active species trapping experiments of (b) the MK; (c) AMK-24h samples; (d) zeta potential of the different samples at various pH values.

Figure 5. Long description
Panel a is a line graph of C max all over C sub 0 versus Time in minutes. It shows cyclic photodegradation for A M K-24h over three cycles. The first cycle shows a linear decrease from 1.0 to near 0.0, while the second and third cycles show a slower, curved degradation reaching approximately 0.4 after 60 minutes of light.
Panel b and c are active species trapping line graphs for M K and A M K-24h respectively. Both plot C max all over C sub 0 versus Time. A vertical dashed line at time 0 separates light off and light on phases. In both panels, the addition of B Q significantly inhibits degradation, maintaining the highest concentration. The addition of A g N O sub 3 shows the fastest degradation. I P A and M e O H show intermediate inhibitory effects compared to the no scavenger control.
Panel d is a line graph of Zeta potential in m v versus p H. The x-axis ranges from 2 to 12. All samples (M K, A M K-1min, and A M K-45min) start with positive zeta potentials around 30 m v at p H 2 and decrease to negative values as p H increases. A M K-45min maintains a positive potential longer, crossing the zero line at approximately p H 5.5, while M K and A M K-1min cross zero near p H 3.5. All samples converge toward negative 50 to 60 m v at p H 11.
To investigate potential reactive oxygen species (ROS) generated during the photodegradation process, IPA, MeOH, BQ, and AgNO3 were introduced into the photodegradation of RhB as scavengers (Yang et al., Reference Yang, Zhu, Peng, Li, Chen, Yang and Zhang2020; Ma et al., Reference Ma, Tang, He, Xue, Pan, Liu and Zhao2024; Puga et al., Reference Puga, Navío and Hidalgo2024). Under the photocatalyst-free control experiments, no significant RhB degradation was observed within the irradiation period (Fig. S3, Supplementary material), confirming that the scavengers themselves do not induce photolytic decomposition of the RhB dye. The active-species-capture experiments revealed that the ‧O2– and ‧OH were the primary reactive species during the photocatalytic degradation of RhB for both the MK and AMK-24h samples (Fig. 5b,c). These findings indicated that the AMK-24h sample did not significantly alter the photocatalytic degradation mechanism of RhB. In addition, photogenerated holes were observed to participate in the reaction for the MK sample, probably due to the excellent conductivity of the O sheet, which facilitates the transfer of photogenerated holes in the photocatalytic process.
Possible enhancement mechanism of acid treatment on the photocatalytic performance of MK
The performance of a photocatalyst is related to its photocatalytic activity, SSA, and the interaction between the surface of the photocatalyst and the reactant. The visible-light photocatalytic activity of MK was determined primarily by the Fe species. In the present study, considering the dominant role of the structural Fe species and the substantial enhancement of the photocatalytic performance of AMK-1min sample, it can be inferred that the structural Fe species is the crucial factor determining the visible-light photocatalytic activity of MK. This finding was also consistent with previous research (Jiang et al., Reference Jiang, Wang, Gao, Fu and Yang2021).
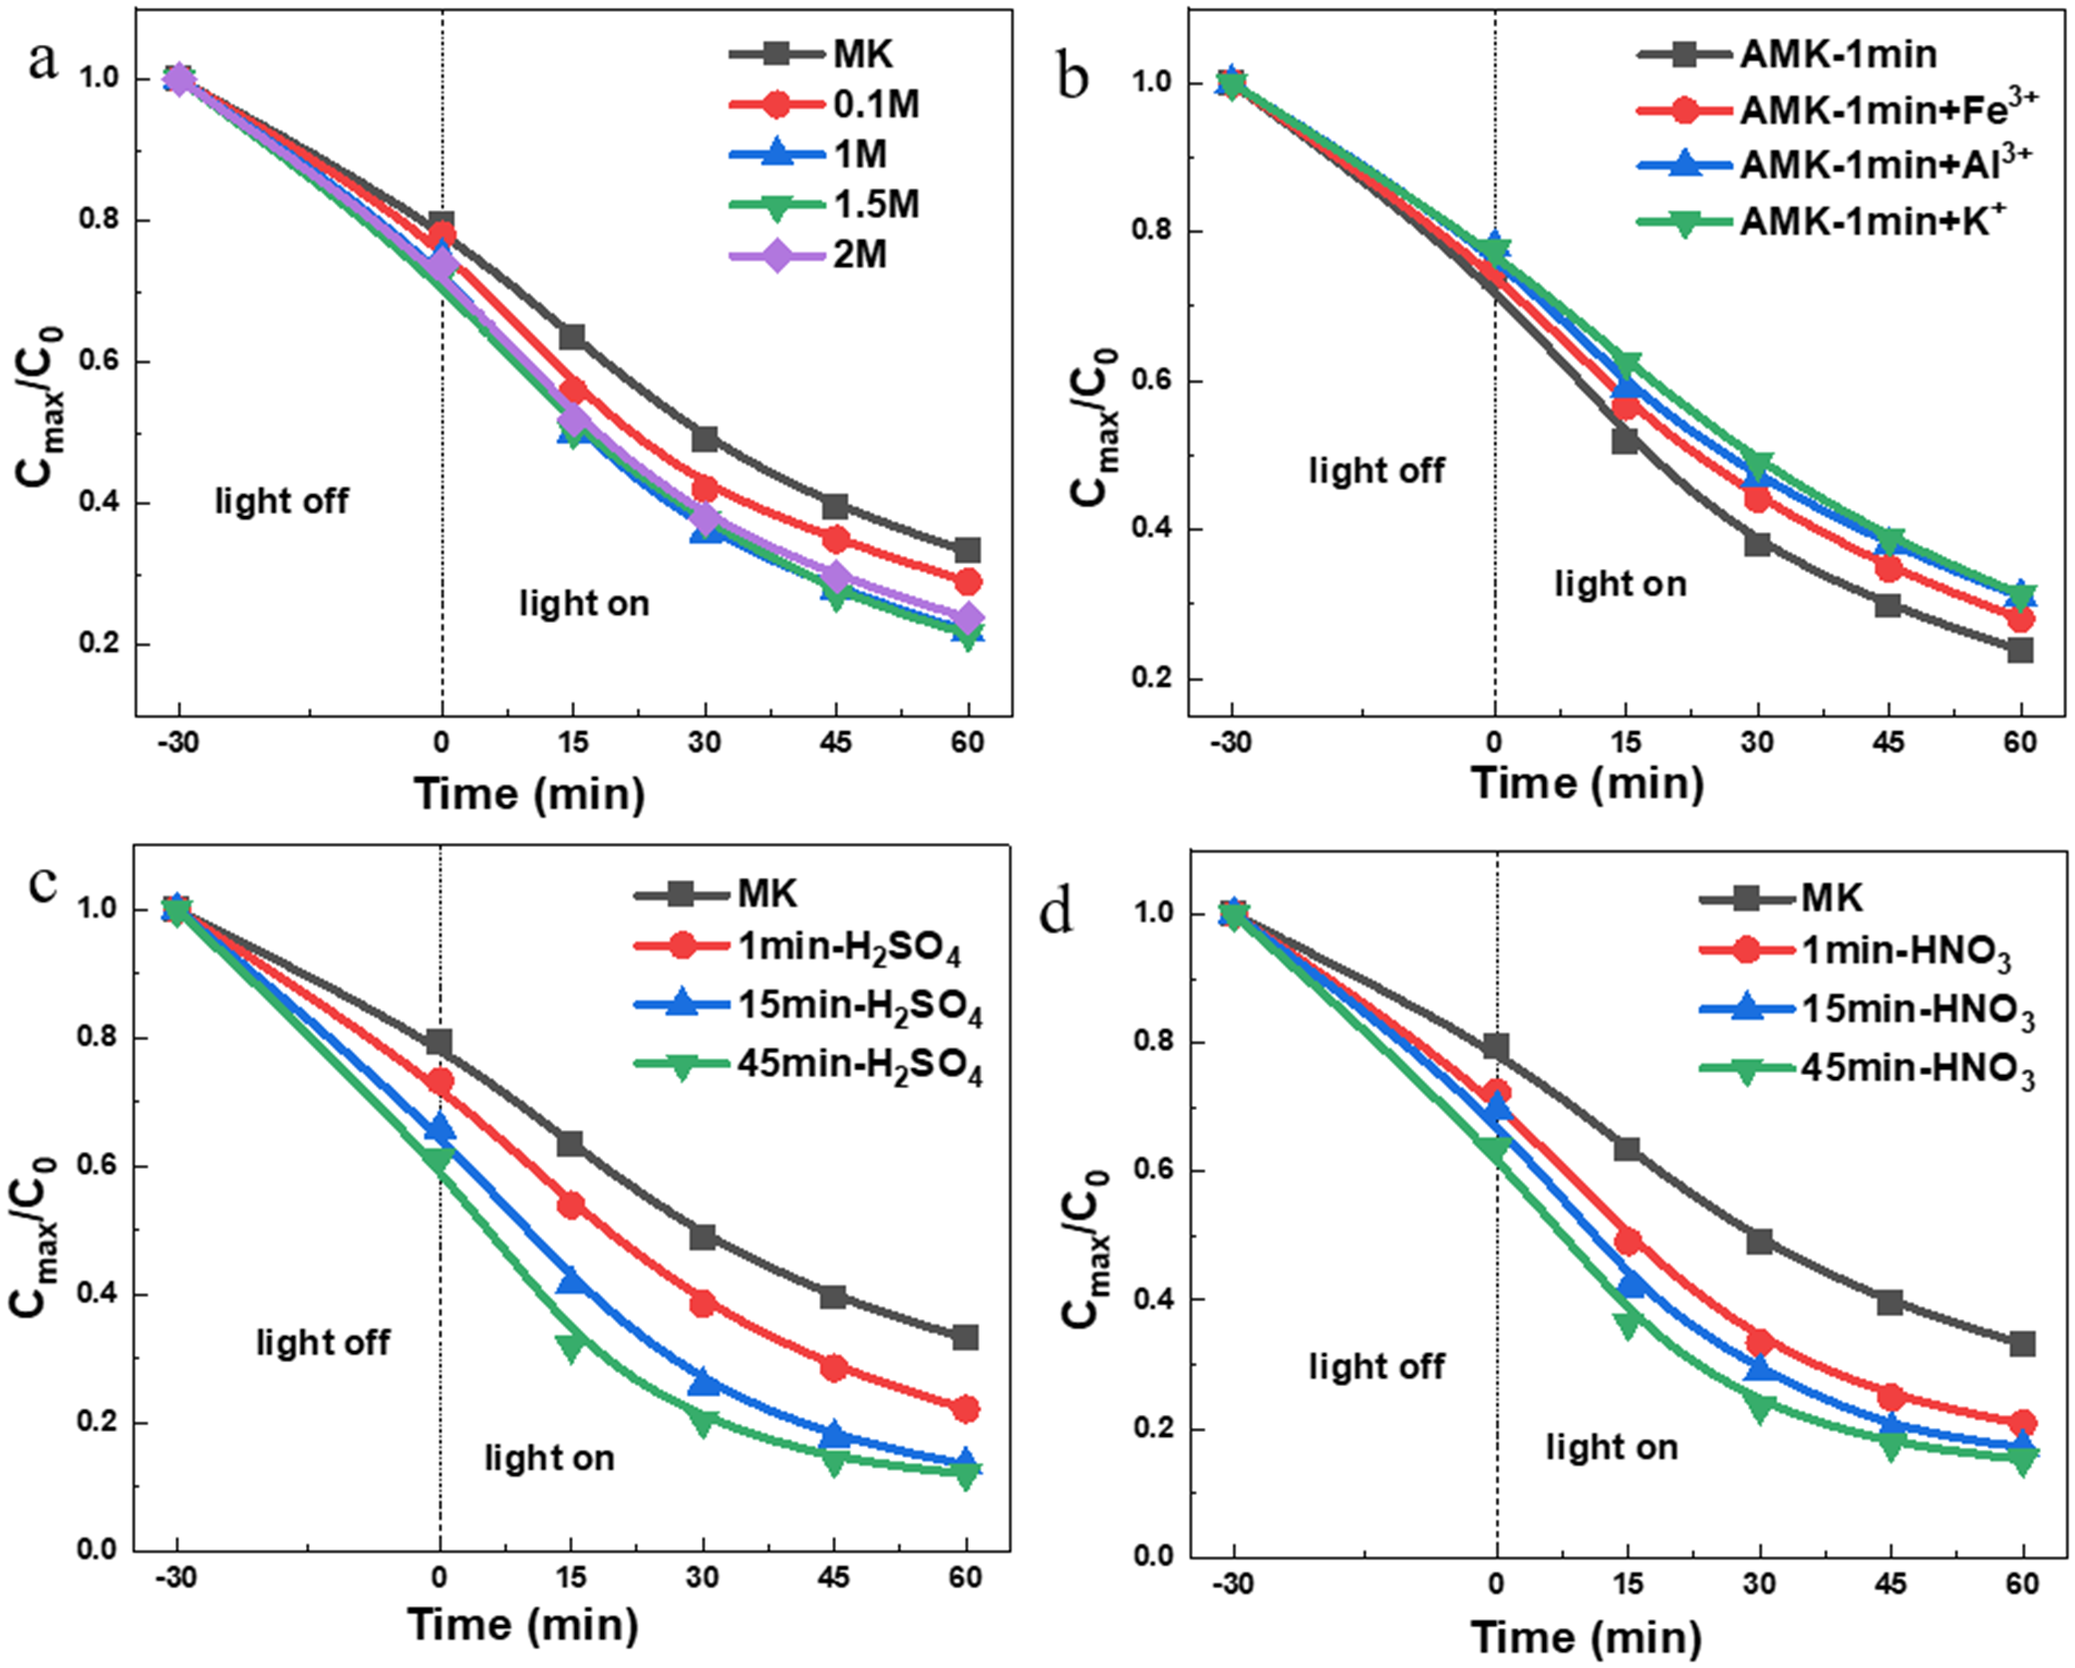
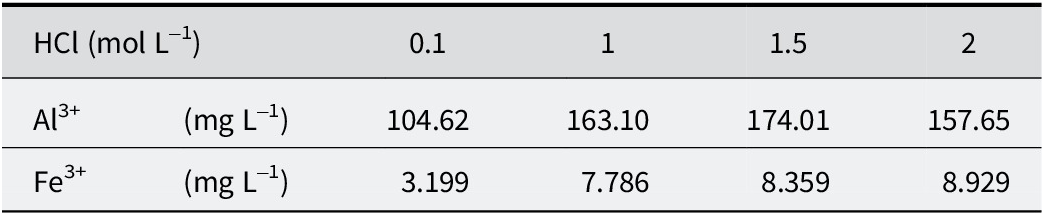
A notable phenomenon is that, despite minimal changes in the structural Fe content, SSA, surface crystal structure, and the light-absorption properties of the AMK-1min sample, its photocatalytic performance increased by 27% compared with the MK sample. Therefore, it can be inferred that the enhanced photocatalytic performance of AMK-1min was not attributable to changes in structural Fe content and SSA but rather results from changes in the interaction between the AMK-1min sample surface and reactants. The positively charged RhB molecules were adsorbed onto the negatively charged MK surface via electrostatic interactions (Fig. 5d), with the photodegradation process occurring primarily on the MK surface (Jiang et al., Reference Jiang, Wang, Gao, Fu and Yang2021). Moreover, MK surfaces inevitably contain oxides, hydroxides, and free metal ions, which may impede the photodegradation and adsorption of RhB molecules on the MK surface. Consequently, mild acid treatment may effectively remove these surface impurities and free metal ions from the MK sample, exposing more active sites, thereby enhancing the photocatalytic performance of MK for RhB degradation. To verify this hypothesis, the photocatalytic performances of MK samples treated with various concentrations of HCl for 1 min were investigated (Fig. 6a). The MK samples treated with HCl at concentrations exceeding 1 M exhibited a significant enhancement in photocatalytic performance, and the photocatalytic performance among different samples was similar. In contrast, MK samples treated with low-concentration (0.1 M) HCl showed relatively small improvement in photocatalytic performance. The concentrations of Fe and Al ions in the acid-treatment solutions obtained from various HCl concentrations were investigated (Table 3). When the concentration of HCl exceeded 1 M, the concentrations of Fe and Al ions in the acid-treatment solution were similar and much greater than those in the 0.1 M HCl acid-treatment solution. This difference may be attributed to the fact that 0.1 M HCl is capable of removing only free metal ions, whereas higher-concentration HCl can effectively dissolve and remove surface oxide impurities. These results suggested that the oxide impurities and free metal ions on the surface of MK had an important influence on the RhB photodegradation process.
(a) Photocatalytic performances of MK samples treated with various concentrations of HCl solution for 1 min; (b) effects of various metal ions on the photocatalytic performance of the AMK-1min samples (in the experiment, 0.030 mg of Fe(NO3)3·9H2O, 0.555 mg Al(NO3)3·9H2O, and 0.386 mg KCl were added, respectively); photocatalytic degradation curves of RhB in the presence of MK samples treated with (c) H2SO4 and (d) HNO3.

Figure 6. Long description
The multi-panel figure contains four line graphs labeled a through d. All graphs share the same axes: the x-axis is Time in minutes ranging from minus 30 to 60, and the y-axis is C max all over C sub 0 ranging from 0.0 to 1.0. A vertical dashed line at time 0 separates the light off phase (negative 30 to 0) from the light on phase (0 to 60).
* Panel a: Shows M K samples treated with H Cl at concentrations of 0.1 M, 1 M, 1.5 M, and 2 M. All curves show a gradual decrease in concentration. The 1.5 M and 2 M samples show the highest degradation, reaching approximately 0.2 on the y-axis at 60 minutes, while the untreated M K remains highest at approximately 0.35.
* Panel b: Shows the effect of metal ions on A M K-1min samples. Curves for A M K-1min, plus F e super 3 plus, plus A l super 3 plus, and plus K super plus are shown. The untreated A M K-1min sample shows the most significant degradation, reaching the lowest point near 0.25 at 60 minutes.
* Panel c: Shows M K samples treated with H sub 2 S O sub 4 for 1, 15, and 45 minutes. Degradation efficiency increases with treatment time. The 45min-H sub 2 S O sub 4 sample shows the steepest decline, reaching approximately 0.12 at 60 minutes.
* Panel d: Shows M K samples treated with H N O sub 3 for 1, 15, and 45 minutes. Similar to panel c, the 45min-H N O sub 3 sample exhibits the highest photocatalytic performance, ending at the lowest concentration value near 0.15.
Fe and Al ion concentrations of acid-treatment solutions of the MK sample treated with various concentrations of HCl for 1 min

Table 3. Long description
The table consists of six columns and three rows.
Row 1 (Header): The first two cells define the units for H C l as mol L super minus 1. The subsequent four columns list the H C l concentrations as 0.1, 1, 1.5, and 2.
Row 2: Data for Al super 3 plus ions in mg L super minus 1. The concentrations are 104.62 at 0.1 mol L super minus 1, 163.10 at 1 mol L super minus 1, 174.01 at 1.5 mol L super minus 1, and 157.65 at 2 mol L super minus 1.
Row 3: Data for Fe super 3 plus ions in mg L super minus 1. The concentrations are 3.199 at 0.1 mol L super minus 1, 7.786 at 1 mol L super minus 1, 8.359 at 1.5 mol L super minus 1, and 8.929 at 2 mol L super minus 1.
To further confirm the impact of the free metal ions on the photocatalytic performance of MK, specific amounts of Fe3+, Al3+, and K+ ions were introduced into the photocatalytic experiment using the AMK-1min sample as the photocatalyst (Fig. 6b). The presence of Fe3+ ions resulted in a 13% reduction in the photocatalytic degradation rate, while the addition of Al3+ and K+ ions led to respective decreases of 20%. These findings provided further evidence of the inhibitory effect of free metal ions on RhB photodegradation by the MK samples. This phenomenon may be attributed to the stronger electrostatic interactions and smaller ionic radii of these metal ions, which facilitate their preferential adsorption onto the negatively charged surface of MK compared with RhB molecules (Sen Gupta and Bhattacharyya, Reference Sen Gupta and Bhattacharyya2012), thereby hindering the photocatalytic degradation process of RhB. Furthermore, the zeta potential of MK and AMK-1min samples was investigated (Fig. 5d). Zeta potential measurements revealed a consistent decrease in zeta potential with increasing pH for all samples. Compared with MK, the AMK-45min sample exhibited a less negative surface charge, probably due to prolonged acid exposure causing significant dissolution of the O sheet, thereby reducing the overall surface negative charge. In contrast, the AMK-1min sample displayed a more negative zeta potential, which can be attributed to the removal of positively charged free metal ions from the MK surface. The enhanced negative charge density of the AMK-1min sample facilitated the adsorption of RhB onto its surface, thereby improving the photocatalytic performance of this sample. Based on the above experimental results, it is reasonable to conclude that the presence of free metal ions on the MK surface impedes the adsorption of RhB molecules, thereby diminishing the photocatalytic efficiency of MK in degrading RhB.
To exclude the influence of HCl on the photocatalytic degradation process, the photocatalytic performances of MK samples treated with H2SO4 and HNO3 (2 M) were compared (Fig. 6c,d). The photocatalytic performances of MK samples were enhanced significantly after treatment with H2SO4 and HNO3, showing a trend similar to that observed after HCl treatment. Specifically, the photocatalytic performance improved significantly after 1 min of acid treatment and continued to increase with increased acid-treatment time. The pH values of the degradation solutions for the various samples also remained consistent near ~6.8. These findings suggested that neither HCl nor pH had a substantial impact on the photodegradation process of RhB. Based on these experimental results and analyses, it can be inferred that the enhanced photocatalytic performance of MK samples after short-term acid treatment is attributed primarily to the removal of surface impurities and metal ions from MK samples.
Based on the experimental results and analysis above, a possible mechanism for the enhanced photocatalytic performance of MK caused by acid treatment is proposed. In the initial stage of acid treatment (1 min), surface oxide impurities and free metal ions are initially removed from the MK surface. The efficient removal of surface impurity oxides and free metal ions exposes more active sites of the MK surface, thereby promoting the adsorption of positively charged RhB molecules onto the MK surface via electrostatic interaction and significantly enhancing its photocatalytic degradation rate. As acid treatment time increased (when acid treatment exceeds 1 min), structural Fe in the O sheets was leached out progressively due to erosion of the O sheets, resulting in a rapid increase in SSA. The reduction of structural Fe species in the MK samples led to diminished intrinsic photocatalytic activity. In contrast, the concurrent increase in SSA provided more surface-active sites, thereby enhancing photocatalytic performance. Consequently, the overall photocatalytic performance of AMK was governed by the interplay between SSA and residual structural Fe content. Within the 5–45 min treatment window, the continuous SSA increase dominated this balance, driving a pronounced improvement in photocatalytic performance. However, beyond 45 min, excessive erosion of the O sheets caused a sharp decline in structural Fe content, which was comparable to the beneficial effect of further SSA growth. As a result, the intrinsic photocatalytic activity deteriorated significantly, and the net enhancement in photocatalytic performance attenuated markedly. This dual-factor mechanism explained effectively the observed phenomenon in photocatalytic experiments, where the photocatalytic performance of AMK-T samples initially increased with acid treatment time but became less significant after 45 min. Despite near-complete removal of the O sheet, the photocatalytic activity of the AMK-24h sample originated predominantly from structural Fe species incorporated within the T sheet. This conclusion was established comprehensively in a previous study by the present authors (Jiang et al., Reference Jiang, Wang, Gao, Fu and Yang2021).
Conclusions
The visible light photocatalytic performance of RhB degradation by the metakaolin was enhanced significantly through simple acid treatment. In the initial stage of acid treatment (1 min), the efficient removal of surface impurity oxides and free metal ions on metakaolin promoted the adsorption of positively charged RhB molecules onto the metakaolin surface via electrostatic interaction, thus enhancing its photocatalytic degradation rate. As the acid treatment time increased, the increase in SSA and the decrease in the structural Fe content, together, regulated the generation and transport capabilities of photogenerated charges in MK. As a result, the photocatalytic degradation rate of RhB for the AMK-1min sample increased significantly by 27% compared with the original MK sample. When the acid treatment time was increased to 45 min, the photocatalytic degradation rate rose to 53%. Superoxide radicals and hydroxyl radicals were the primary reactive oxygen species involved in the degradation process. According to the findings in the present study, 45 min of acid treatment could achieve the optimal photocatalytic performance of metakaolin without completely leaching the octahedral sheet. This research contributed to our understanding of the structural characteristics of kaolinite, particularly its photocatalytic properties. Building upon the insights into kaolinite’s photocatalytic activity gained in this study, kaolinite offers potential in the degradation of other recalcitrant pollutants, such as antibiotics, via photocatalysis or photo-Fenton catalysis.
Supplementary material
The supplementary material for this article can be found at http://doi.org/10.1017/cmn.2026.10041.
Data availability statement
All data accompanying this publication are available within the publication.
Acknowledgments
None.
Author contribution
Bing Lv: Methodology, Investigation, Experiments, Characterizations and operation, Writing-Reviewing & Editing; Huihua Jing: Conceptualization and Resources; Guangjun Peng: Visualization and verification; Denghui Jiang: Conceptualization, Methodology, Supervision, Resource, Writing Reviewing & Editing; Feng Bin: Investigation and Visualization. Donghang Zhou: Visualization and verification.
Financial support
This work was supported by the Natural Science Foundation of Hunan Province (2022JJ30596 and 2022JJ90004), the National Natural Science Foundation of China (52307157) and Changsha University of Science and Technology Postgraduate Research Innovation Project (CLKYCX24079).
Competing interests
The authors declare no competing interests.