


Fatty liver affects up to 50% of all dairy cows in the first 4 weeks postpartum (Jorritsma et al. Reference Jorritsma, Jorritsma, Schukken, Bartlett, Wensing and Wentink2001) and is associated with annual costs of over US$60 million (Bobe et al. Reference Bobe, Young and Beitz2004). Fatty liver develops when the liver stores excess triacylglycerol (TAG), which interferes with liver functions and negatively impacts health, reproductive and lactational performance (Bobe et al. Reference Bobe, Young and Beitz2004). Currently, fatty liver can be diagnosed reliably only by determining the TAG content by biochemical or histological analysis of a liver puncture biopsy sample (Bobe et al. Reference Bobe, Young and Beitz2004). Biopsies are impracticable for on-farm diagnosis because they cause temporary discomfort to cows, pose risk of infection, and can be lethal if a major blood vessel is punctured (Smith et al. Reference Smith, Hippen, Beitz and Young1997). Therefore, a non-invasive technique would be very useful.
Ultrasound imaging has been used for detection of liver abscesses in cows (Braun et al. Reference Braun, Pusterla and Wild1995; Lechtenberg & Nagajara, Reference Lechtenberg and Nagaraja1991). Detection of fatty liver is more difficult because it results in smaller changes of hepatic echostructure (Nyland et al. Reference Nyland, Mattoon, Herrgesell, Wisner, Nyland and Mattoon2002). Textural characteristics of fatty liver ultrasonograms include fine echogenicity, vascular blurring, acoustic backscatter and hypoechoic areas (Biller et al. Reference Biller, Kantrowitz and Miyabayashi1992; Acorda et al. Reference Acorda, Yamada and Ghamsari1994, Reference Acorda, Yamada and Ghamsari1995; Nyland et al. Reference Nyland, Mattoon, Herrgesell, Wisner, Nyland and Mattoon2002) which can be better detected by complex algorithms (i.e. second-order parameters) such as gradient, gray-level co-occurrence and run-length matrix and two-dimensional Fourier-transformed parameters than by first-order gray level changes (Allison et al. Reference Allison, Barr, Massoth, Berg, Krasner and Garra1994). Our objective was to evaluate whether first- or second-order parameters from digital analysis of B-mode ultrasonograms have potential to non-invasively detect the degree of hepatic TAG infiltration in dairy cows.
Materials and Methods
Sample collection
Forty-nine liver ultrasonograms and biopsies were taken from 29 multiparous Holstein cows (3–11 years old; within 2 weeks post partum) at the dairy teaching farm of Iowa State University over a 4-month period. No more than two comparisons per cow, taken at least 1 week apart, were included in the analysis. To have a wide range of liver samples, cows that had a history of fatty liver-associated diseases, which had occurred at a relatively high frequency on the farm, were preferentially chosen for the study. To minimize potential effects of age and breed on variability of image parameters, only multiparous Holsteins were chosen for sample collection. All cows were visually healthy at sample collection; however, 6 of the 7 cows with severe fatty liver and 3 out of 5 cows with moderate fatty liver developed ketosis in the following weeks and required medical treatment. Of the remaining 27 cows, only one cow with 4·3% liver TAG became ketotic and required treatment. The site for ultrasonograms and liver biopsy was prepared by shaving the region on the right side from 10 to 90 cm below the spinous process and from the 9th to 13th rib. Vegetable oil was applied liberally to improve ultrasound coupling. Liver B-mode ultrasonograms were acquired with a real-time ultrasound system (Aloka 500V) and a 3·5-MHz, 17·2-cm linear-array transducer (Aloka UST-5044-3.5) both distributed by Corometrics Medical Systems, Inc. (Wallingford CT, USA). Ultrasound equipment settings of near gain (−25 dB), far gain (2·1 dB), overall gain (90 dB), focal points (1 and 2) and time-gain-compensation were kept the same for all ultrasound images. The transducer was placed parallel to the ribs and between the dorsal and middle third of the 10th intercostal space. A right lateral transverse digital image of the liver at the 10th intercostal space was saved on a portable computer with a frame-grabber board (Cortex1; Imagenation Corp., Beaverton OR, USA).
After ultrasound scanning, 4–6 g of liver tissue was obtained under local anaesthesia from each cow by two puncture biopsies (Smith et al. Reference Smith, Hippen, Beitz and Young1997). Tissue was moved from the biopsy cannula onto absorbent paper, blotted free of blood, frozen in liquid nitrogen and stored at −80°C. For analysis, liver (0·5–0·7 g) was placed in liquid nitrogen in a stainless steel pestle, allowed to freeze solid and then pulverized with a hammer. Lipids were extracted in duplicate from pulverized liver tissue with a 2:1 (vol/vol) chloroform-methanol mixture (Folch et al. Reference Folch, Lees and Sloane Stanley1957). Lipids were dried under moving air and then redissolved in 5 ml of 3:2 (vol/vol) hexane-isopropanol. Supernatant of the mixture (1 ml) was transferred to a new tube and 0·25 ml of 1 m-KOH solution was added, followed by 0·25 ml of periodate solution (125 mg sodium periodate to 50 ml of 2 m-acetic acid). Liver TAG was determined with a commercial kit (Kit No. 339; Sigma Chemical Co., St. Louis MO, USA). Biopsy samples were classified into either normal liver (<1% TAG of liver wet weight) or mild (1–5% TAG), moderate (5–10% TAG) or severe fatty liver (>10% TAG; Bobe et al. Reference Bobe, Young and Beitz2004).
Digital analysis
Digitized images (512 pixels wide×486 pixels deep with 256 gray scale levels) were transferred to a DEC 5000 computer workstation (Digital Equipment Corp., Maynard MA, USA) and processed with PV-WAVE (Precision Visuals Inc., Boulder CO, USA) and MATLAB (The Mathworks, Inc., Natick MA, USA). Analysed images had consistent texture, were not blurred from respiratory movement or motion of cow or transducer, and were void of large blood vessels and reverberation and acoustic shadows from sharp interfaces, such as subcutaneous tissue layers. To minimize variability of the image parameters caused by factors unrelated to liver TAG content, a region of interest of 128×128 pixels (29×29 mm2) that was of consistent texture and free of major blood vessels, selected at a standardized depth (5–8 cm) was chosen for digital analysis. Increasing the region of interest was not possible because many ultrasonograms had only small areas of consistent texture that were free of major blood vessels. The region of interest was processed by using a texture analysis computer program that calculated first- or second-order 17 image parameters, which had been described previously (Amin et al. Reference Amin, Roberts, Patel, Wilson, Rouse, Zhang, Thompson and Chimenti1995, Reference Amin, Bobe, Young, Ametaj and Beitz2001; Hassen et al. Reference Hassen, Wilson, Amin, Rouse and Hays2001). Briefly, first-order parameters were based on the gray scale level distribution in the region of interest (skewness of histogram [H3], 10th percentile of cumulative histogram [HP1], maximal intensity of histogram [HI1]) whereas the 14 second-order parameters were based on gray level differences of closely located pixels. Gradient magnitude parameters were based on gray level differences between neighbouring pixels (gradient magnitude [GM1], skewness of gradient magnitude [GM3], variance of gradient magnitude intensity [GMI2], mode of gradient magnitude intensity [GMI3]). Gradient direction parameters were based on the direction of gray level difference (variance of gradient phase [GP2], skewness of gradient phase [GP3] and kurtosis of gradient phase [GP4]). Co-occurrence parameters were based on gray level differences of pixels that are separated by a defined distance in a specified direction (difference entropy at the 90 degree angle [C090_10], information measure of correlation-1 at the 135 degree angle [C135_11]). Run-length parameters were based on the number of consecutive pixels with the same gray level in a defined direction (average run length at the 90 degree angle [R090_1] and skewness of run length at the 135 degree angle [R135_3]). Fourier-transformed parameters were based on the gray level differences from one pixel to another as a function of the distance of pixels from each other by transforming the image into a Fourier power spectrum (coefficient of variation of the Fourier power spectrum [FI3], ratios of the sum of Fourier power values within v. outside a specified distance [FRP7S, FRP8S]).
Statistical analysis
Statistical analysis used SAS Version 9.1.3 (SAS, 2002). The PROC DISCRIM function of SAS was used to calculate a group of linear combinations of the 17 image parameters by multivariate, linear regression analysis that together had the maximal likelihood to correctly classify the groups. The Pearson's correlation coefficient in PROC CORR was used to correlate each image parameter to each other and the TAG content of the biopsy sample. Stepwise multivariate, linear regression analysis in PROC REG was used to evaluate whether a single combination of image parameters could estimate TAG content of the biopsy sample. The set of image parameters was chosen that had the smallest Mallows Cp and Schwartz Bayesian criterion value (Ramsey & Schafer, Reference Ramsey and Schafer1997) and could estimate biopsy sample TAG content within 2·5% TAG of liver wet weight.
Results and Discussion
The 49 samples covered a range of TAG concentrations (mean±sd: 6·2±6·8%; range=0·3–25·2% of liver wet weight) and were classified into either normal liver (0·7±0·2% TAG; n=10) or mild (3·1±1·0% TAG; n=22), moderate (7·1±1·2% TAG; n=7) or severe fatty liver (18·1±5·1% TAG; n=10; Bobe et al. Reference Bobe, Young and Beitz2004). With increased liver TAG content, beam attenuation and backscattering, fine echogenicity and vascular blurring increased, of which beam attenuation was the most prominent change at higher TAG infiltration (Fig. 1). Such characteristics are typical for fatty liver in dairy cattle and other species (Biller et al. Reference Biller, Kantrowitz and Miyabayashi1992; Acorda et al. Reference Acorda, Yamada and Ghamsari1994, Reference Acorda, Yamada and Ghamsari1995; Nyland et al. Reference Nyland, Mattoon, Herrgesell, Wisner, Nyland and Mattoon2002). Subtle changes in beam attenuation and echogenicity are difficult to detect visually (Allison et al. Reference Allison, Barr, Massoth, Berg, Krasner and Garra1994; Smith-Levitin et al. Reference Smith-Levitin, Blickstein, Albrecht-Shach, Goldman, Gurewitsch, Streltzoff and Chervenak1997) and are prone to subjective error because of equipment variability, operator experience and intra- and inter-observer variability (Hassen et al. Reference Hassen, Wilson, Amin, Rouse and Hays2001; Nyland et al. Reference Nyland, Mattoon, Herrgesell, Wisner, Nyland and Mattoon2002). Therefore, the percentage of correctly classified samples for liver TAG infiltration improved from 49% for visual inspection of ultrasonograms to 60% when gray level means at different liver depths of digitized images were used in dairy cows (Acorda et al. Reference Acorda, Yamada and Ghamsari1995).
Ultrasonograms (right lateral transverse view at the 10th intercostal space) of six livers of early lactation dairy cows that differ in their concentrations of triacylglycerol (% liver wet weight): (A) 0·3%, (B) 5·1%, (C) 9·1%, (D) 17·7%, (E) 22·1% and (F) 24·7%. The top portion of the ultrasound images represents the transducer-skin contact area. The left portion of the ultrasound images represents the cranial side of the cow. The indents above and left of the ultrasound images mark the length and the depth of the ultrasonograms in cm.

Fatty liver detection and estimation of liver TAG content was done in two stages: (1) detection of degree of fatty liver using discriminant analysis followed by (2) determination of liver TAG content within each class using regression analysis. Our study shows that a group of linear combinations of 17 first- and second-order image parameters can together correctly classify 82% of samples (40 out of 49) into normal liver as well as mild, moderate and severe fatty liver when cut-off values were 1%, 5% and 10% (Table 1) and correctly classified 92% (45 out of 49 samples) when cut-off values were 5% and 10% TAG of wet weight. Similar improvements have been shown in human studies (Haberkorn et al. Reference Haberkorn, Zuna, Lorenz, Zerban and Layer1990).
Agreement between classification of hepatic triacylglycerol (TAG) infiltration in dairy cows by digital analysis of B-mode ultrasonograms and by biochemical analyses following liver biopsyFootnote †
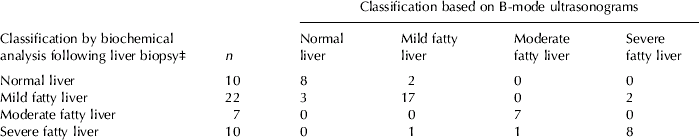
† Concentrations of TAG of 49 liver biopsy samples from 29 early-lactation cows were determined by biochemical analysis; 17 image parameters were determined by digital analysis of B-mode ultrasonograms of the same liver prior to biopsy
‡ Liver samples were classified on the basis of their TAG content into either normal liver (<1% TAG of liver wet weight) or mild (1–5% TAG), moderate (5–10% TAG) or severe fatty liver (>10% TAG; Bobe et al. Reference Bobe, Young and Beitz2004)
No single combination of image parameters accurately estimated liver TAG content over the whole range (results not shown), and only two image parameters (C090_10, GMI3) were or tended to be associated with liver TAG content over the whole range (Table 2). Because image parameters used to estimate hepatic TAG contents varied depending on the degree of TAG infiltration (Table 2), we estimated liver TAG content within fatty liver classes. For liver samples below 5% TAG content, TAG concentrations were correlated strongest with all three Fourier-based parameters (FI3, FRP7S and FRP8S) and two gray level histogram-based parameters (HP1, HI1). A linear combination of two parameters (GM1, C090_10) estimated the TAG contents of the 32 liver samples below 5% within 2·2% TAG content (14 within 0·5%, 20 within 1%, 26 within 1·5%, 28 within 2% and all within 2·2% TAG of liver wet weight; r 2 model=0·36; rse of model=1·14% TAG; P=0·002). For liver samples above 10% TAG content, TAG concentrations were correlated strongest with both co-occurrence matrix-based parameters (C090_10, C135_11) and three gradient magnitude parameters (GM1, GMI2, GMI3). A linear combination of three image parameters (HP1, GM1, GP4) estimated the TAG contents of the 10 liver samples above 10% within 2% TAG content (1 within 0·5%, 3 within 1%, 6 within 1·5% and all within 1·9% TAG of liver wet weight; r 2 model=0·92; rse of model=1·81% TAG; P=0·001). None of the 17 image parameters were correlated significantly with TAG concentrations between 5 and 10% TAG (results not shown). A linear combination of 16 image parameters (all except HP1) was needed to estimate TAG contents of 38 of the 39 liver samples below 10% within 2·5% TAG content (15 within 0·5%, 19 within 1%, 29 within 1·5%; 35 within 2%, 38 within 2·5% and all within 3·3% TAG of liver wet weight; r 2 model=0·68; rse of model=1·68% TAG; P=0·009).
Pearson's correlation coefficients (r) and their probability values (P of r) between concentrations of liver triacylglycerol (TAG) and digital ultrasonogram parameters in dairy cows as affected by degree of hepatic TAG infiltrationFootnote †

† Concentrations of liver lipids of 49 liver biopsy samples of 29 early-lactation cows were determined by biochemical analysis. Image parameters were determined by digital analysis of B-mode ultrasonograms of the same liver prior to biopsy
‡ Abbreviations are explained in Materials and Methods
§ NS=Non-significant, P>0·10
Results for our regression equations indicate the potential for digital analysis of ultrasonograms being used to estimate liver TAG contents in a two-stage process: (1) classification of liver ultrasonograms using discriminant analysis followed by (2) estimation of liver TAG content using regression analysis. To decrease variability, a reference phantom that has echogenic characteristics similar to liver can be used as an external standard (O'Brien et al. Reference O'Brien, Zagzebski, Lu and Steinberg1996). Because the number of cows was limited, our prediction models could not be validated by using a set of independent samples. Larger-scale field studies, based on these preliminary results, are warranted to develop and validate regression models to estimate TAG contents in liver. Such a model could be incorporated into a software package, similar to the USOFT package (Amin et al. Reference Amin, Wilson and Rouse1997) for determination of intramuscular lipid concentrations in beef cattle (Hassen et al. Reference Hassen, Wilson, Amin, Rouse and Hays2001). The package would allow quicker estimation of the degree of hepatic TAG infiltration, which would allow more timely and informed treatment.
In conclusion, the current study indicates that digital analysis of B-mode ultrasonograms has potential to classify the degree of hepatic TAG infiltration and estimate liver TAG content. Upon confirmation by larger field studies, digital analysis of ultrasonograms could provide important technology for rapid non-invasive, on-farm diagnosis and thereby more effective treatment of fatty liver in dairy cows.
The authors thank C L Hays, G H Rouse and D E Wilson for assistance in digital analysis of ultrasound images.
Appendix
(1) Discriminant analysis – maximum likelihood functions for classifying samples based on degree of fatty liver:

(2) Regression analysis equations for estimating liver TAG content within each fatty liver class:










