Prospective research on optimal disaster response has often been characterized as “difficult, if not impossible,” providing challenges to the establishment of evidence-based guidelines for disaster planning.Reference Lerner, Schwartz and Coule1 Further planning limitations include diverse stakeholders, untested assumptions, critical constraints in the US emergency care system, and waning institutional, organizational, and individual knowledge and experience.Reference Dausey, Buehler and Lurie2–6 Computer modeling and simulations offer a valuable adjunctive tool to help medical and public health officials plan for and respond to disasters. By permitting repeated examination of diverse catastrophes under multiple parameter settings, computer simulations can project worst-case scenarios, evaluate the capabilities of the entire response system, and explore suitable mitigation strategies. Despite the elegance of some disaster computer models, several limitations remain: environments without realistic geographical topography, inadequate scalability, deterministic or linear-response assumptions, avoidance of a population-based systemic approach, inattention to human psychosocial characteristics and individual movement, disregard of learning ability or altered responses, or inability to integrate disaster prediction with management.7–Reference Eubank, Guclu and Kumar15
To improve current simulation models and evaluate the varied and complex components of disaster response, a multiagent-based disaster simulation platform, PLAN C (Planning with Large Agent Networks against Catastrophes), was developed through intensive, multidisciplinary collaboration. An agent-based model (ABM) technology approachReference Berry, Kiel and Elliott16 was used. ABMs are able to support the shifting interactions among multiple disaster participants by coding each of them as unique computational entities, and ABMs capture the concepts of adaptation and autonomous decision making. In medicine, ABMs have been creatively applied to evaluate antibiotic resistance in bacteria,Reference Dugatkin, Dugatkin, Atlas and Perlin17 immune response to atherogenesis,Reference Pappalardo, Musumeci and Motta18 and smallpox propagation in an idealized city architecture.Reference Burke, Epstein and Cummings8
PLAN C incorporated a toxicological dose-response concept, hospital data and surge-response characteristics, individual psychosocial traits, and communications infrastructure superimposed on a geographic information system (GIS) architecture. This approach permits event visualization, intrarun parameter alteration, macro- and microlevel analysis, parameter evaluations and sweeps, recovery point identification, factor/sensitivity analysis, and multiobjective optimization. Sarin vapor scenarios were then explored in the model to evaluate their medical and public health consequences. Parameters evaluated included emergency medical services, hospital surge capacity (which included implementation of disaster plans), and behavioral and psychosocial characteristics of the victims.
METHODS
Architecture, Setting, and Social Structure
The Plan C ABM incorporates 5 discrete types of computational entities (“agents”): individuals (people), hospitals, ambulances, onsite responders, and the catastrophic event type. Significant elements of the model are described below; the Appendix (available online only: http://links.lww.com/A1328) provides additional details. Parameter selection aimed to minimize variables with completely unknown actual values.
On the basis of previously validated standardized scoring systems of health status,Reference Rabin and de Charro19, Reference Horsman, Furlong and Feeny20 “health” was modeled as a real number on a scale of 0 to 1, in which death = 0.00 and complete health = 1.00. Because human response to disaster may be affected by psychosocial characteristics, behavioral characteristics were also modeled to include worry, distress, trust (in communicated messages), and compliance.
In this model, individuals are initially en route to work or home until the event onset, at which point they may additionally decide to proceed to a hospital. Current health, personality factors, communication with other people, and medical interventions influence this decision. The concept of perfect “rationality” in decision making is based on making the “correct” choice on the basis of all available information. In reality, limits, or “bounds,” on information and problem solving constrain reasoning and an individual’s perceived benefit. Therefore, person agents are modeled as “boundedly rational,” with stochastic psychosocial characteristics emulating a spectrum of responses, including panic behavior.
Population usage data adjusted to current levels and building data were obtained for major Manhattan transportation centers: Port Authority Bus Terminal (PABT), Grand Central Terminal (GCT), and Pennsylvania Station (PennS).Reference Felson, Belanger and Bichler21, 22 GIS data sets obtained from public sources for the City of New York23 provided topographical and transportation constraints. Multiple scenarios were modeled to include a single-site release modeled with 5000 people at the PABT, and multisite distribution scenarios modeled with 4000 people in PABT, 8000 people in PennS, and 10,000 people in GCT. Although sarin was modeled in this instance, other point source materials and scenarios with other agents can be modeled similarly.
Incorporation of a Dose-response Concept
Physicochemical data for the anticholinesterase sarin were obtained from published material. Reference Kukkonen, Riikonen and Nikmo24–Reference Watson, Opresko and Young26 Indoor release of sarin in a passive (evaporative) manner was modeled using SPILL, a publicly available component of IAQX 1.0 (Environmental Protection Agency Simulation Tool Kit for Indoor Air Quality and Inhalation Exposure).27 Releases of 5, 10, and 15 L were chosen on the basis of the previous achievable releases of approximately 4.75 L of pure sarin (in a larger total volume) in TokyoReference Okumura, Suzuki and Fukuda28, 29 and 12 L in Matsumoto, Japan.Reference Davis and McHenry30 The active distribution scenario envisioned by the US Department of Homeland Security (DHS) was modeled with 5 L.31
A literature review informed the construction of a sarin lethality dose-response curve. A median lethal concentration time (LCt50) value of 35 mg · min/m3 was chosen on the basis of National Research Council recommendations,25, 32 which were later accepted and applied in military publications.33, 34 This LCt50 value for civilian populations is lower than previous values that attempted to predict enemy combatant casualties under offensive use.35 A probit (Bliss) slope value of 5 was selected as suitable for the general population.25,Reference Bide, Armour and Yee36–38 Individual people were randomized to exposure duration according to time estimate distributions within the PABT.Reference Felson, Belanger and Bichler21 For each individual’s exposure duration, the area under the curve produced by the SPILL program was integrated to yield a cumulative dose (Ctx).
Using the lethal dose-response curve for sarin, a computation of a lethality propensity (LCtx, percentage chance of dying in the absence of treatment) for each person’s given dose was superimposed on the health status of each person.38 Because exposure times are relatively short, Haber’s rule (ie, the product of concentration and time predicts a consistent biological effect) was accepted. For each LCtx value obtained (on the basis of experimental sarin exposure time-to-death data), a unique mean time-to-death (MTTDx) was derived that agreed closely with a time-to-death curve derived from a prior model.Reference Sacco, Navin and Fiedler39 Health decays at a rate determined by the MTTDx such that an individual will die with a given propensity of LCtx around the MTTDx. Treatment (eg, contact with a health care provider) affects both disease progression and survival probability. Patients are “moderately” affected at absolute health levels ≤0.8 and “severely” affected at health levels ≤0.3, approximating previous survival cutoffs and classifications in clinical use.Reference Sacco, Navin and Fiedler39, Reference Markel, Krivoy and Rotman40
Both deteriorating health and initial dose affect mobility, as encompassed by travel speed (see online-only Appendix). A variable population subset may be designated as physically “vulnerable,” encompassing extremes of age with decreased mobility and impairment due to either a general medical condition or a specific physical disability. Because ambulance usage may be low during a disaster, a definable percentage of patients may access vehicles of convenience; a default of 10% was selected on the basis of prior experience in a congested Manhattan setting.Reference Auf der Heide5,Reference Okumura, Suzuki and Fukuda41–43 People may also elect to use subways for as long as they remain operational.
The degree of worry represents the innate level of concern in the person; the level of compliance represents the instruction-abiding psychosocial traits. A declining personal health level, baseline worry level, and initial sarin dose (given the independent, psychological distress-inducing nature of chemical weapons)Reference Hildebrand and Bleetman44 are integrated to produce a perceived level of distress. These variables affect decision making of the person agent. These variables were explored in parameter space.
Hospital Setting and Response to Disaster
The hospital is an immobile agent that includes an emergency department (ED), inpatient beds, isolation beds, and critical care capacity in the form of an intensive care unit (ICU) and the number of available ventilators. Manhattan’s emergency-receiving hospital capacity data were obtained by contacting individual hospitals and examining available databases (eg, the National Hospital Available Beds for Emergencies and Disasters [HAvBED] system).Reference Asplin, Flottemesch and Gordon46 In each hospital agent, efficiency in caring for patients is adversely and nonlinearly affected by current capacity and resources (see online-only Appendix).
The ED census demonstrates recognizable daily cyclical variations with additional stochasticity.Reference Asplin, Flottemesch and Gordon46–Reference McCarthy, Zeger and Ding50 Hospitals also exhibit weekly and monthly trends for total occupancyReference Kanter and Moran51, Reference DeLia52 and ICU resources.Reference McManus, Long and Cooper53 The scenario was superimposed on these capacity variations and the predicted occupancy of patients in hospital units. Patients’ leaving before medical evaluation and during treatment was incorporated into the model on the basis of national data that have been used in an evidence-based approach to public health preparedness planning.Reference McCaig and Nawar54, Reference Brown, Young and Engelgau55
Hospital strategies for disaster surge have been elaborated.6,Reference Hick, Hanfling and Burstein56–Reference Rubinson, Hick and Curtis58 We implemented these suggestions in the following order within the hospital agent: phase 1, rapidly discharging nonurgent patients present in the ED and increasing ED size (allowing “hallway beds”); phase 2, discharging floor patients and releasing critical care resources (eg, postanesthesia care unit beds by canceling elective surgeries) to increase critical bed capacity; phase 3, decreasing care time in the ED as a result of mobilized staff resources and rapidly transferring critical patients out of the ED; and phase 4, creating a separate minor treatment area (MTA) to care for minimally affected patients. In initial analyses, activation and implementation of all phases is accomplished within 30 minutes after the arrival of the first patient to a given hospital. In subsequent analyses modeling variances in systemic inefficiencies, the effects of increasing the activation and implementation times to 2 hours also were evaluated.
Emergency Medical Services
After a definable median delay based on local response times, ambulances and onsite responder units (OSRs) arrive at the scene. In this scenario, before ambulance arrival, the capacity to delivery agent-specific medical care (antidotal therapy) is absent. Ambulances transport sick people to hospitals, and ambulance decontamination occurs before returning to the scene, resulting in a delay to redeployment. Treatment is provided by OSRs, including mobile emergency response vehicles, hazardous materials team, and emergency medical services (EMS; see online-only Appendix). If a staging distance from the catastrophic event site is user selected, then ambulances and OSRs will not enter the “hot zone.” Patients requiring inpatient care may be evacuated to hospitals following OSR care.
Statistical Methods
As a result of stochastic rules involved in agents’ behavior, 2 independent simulations of PLAN C may produce different results despite identical parameter initialization. Therefore, a single simulation is insufficient for comprehensive outcome evaluation. Previous theoretical exploration determined that a mean of 10 runs was adequate to provide fatality estimates within 1.14% of the absolute value returned.Reference Narzisi, Mysore and Mishra59 To increase precision for this and other outcomes measures, 100 runs for each given parameter set were used. Where appropriate, values are expressed with associated standard errors of the mean. Sensitivity analyses of the results to LCt50 and probit slope and of population access to alternative means of transportation were performed.
RESULTS
Dose Response of the Chemical Agent to the Population
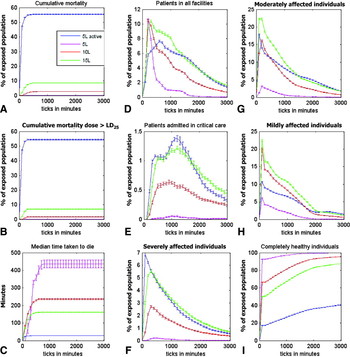
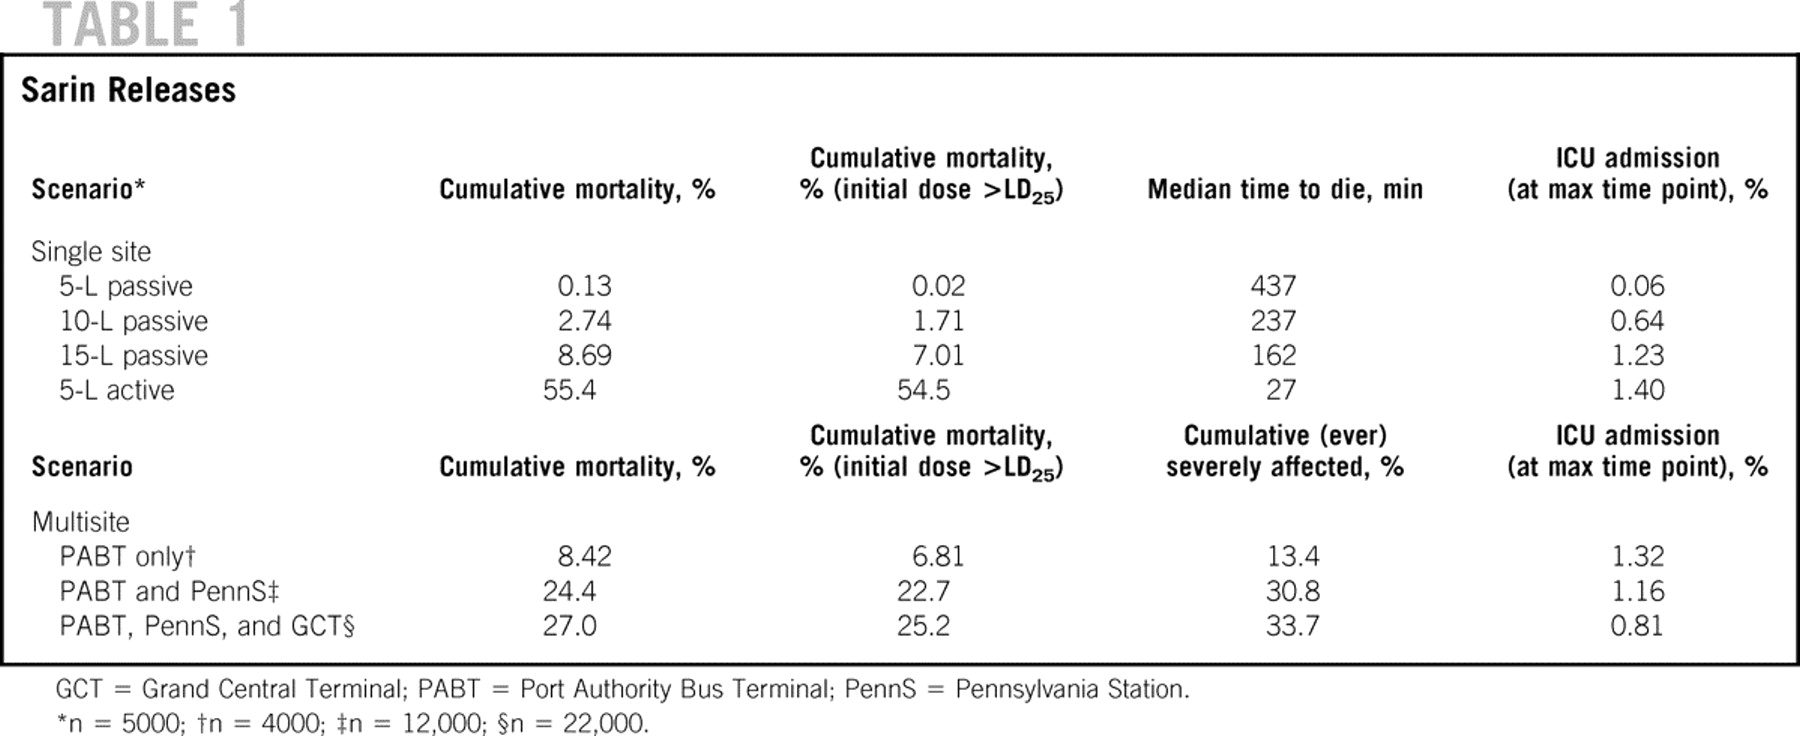
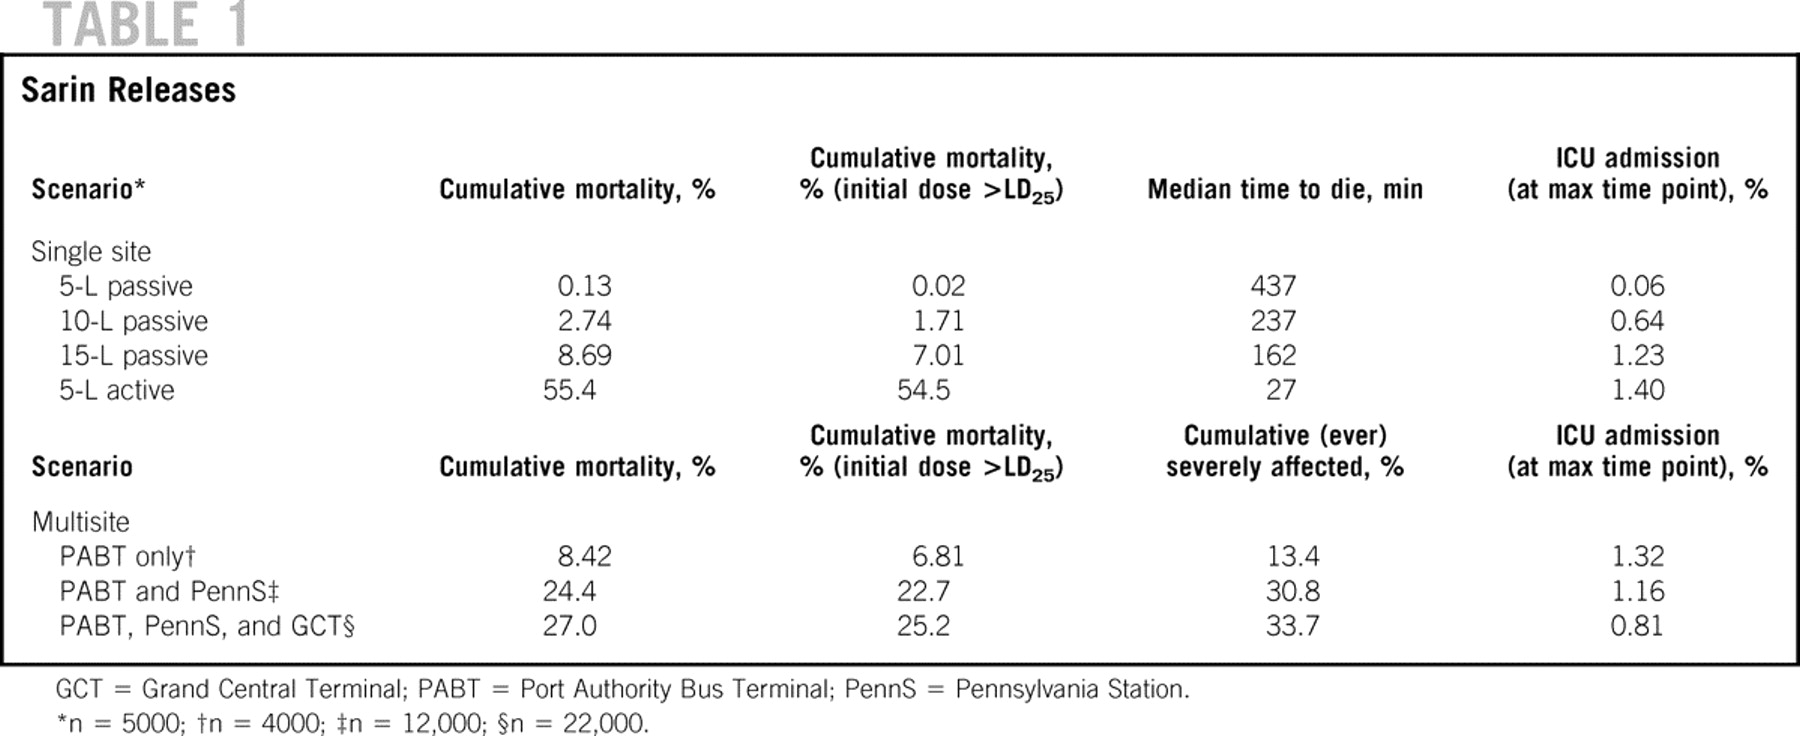
Figure 1 depicts the results of simulations with passive indoor dispersion of 5, 10, and 15 L of sarin and active dispersion of 5 L, with hospital-based disaster plans implemented. As such, these simulations would represent best-case scenarios. The figures illustrate time-dependent effects, with the caveat that patients may pass from one category to the next (eg, mild to moderate to severe, or vice versa); may die or improve with or without treatment; and may move through various hospital divisions (e.g., waiting to be seen, in the ED, admitted to the hospital, or discharged) during the evolution of the scenario. Static results (where appropriate) are presented in Table 1. Increases in passive sarin release produce a nonlinear mortality increase (Fig. 1A) from 0.13% to 8.69%.
Sarin release, single site. Simulations with passive indoor dispersion of 5 L (violet), 10 L (red), and 15 L (green) of sarin and active dispersion of 5 L of sarin (blue), with hospital-based disaster plans implemented in a 5000 exposed-person scenario. Effects are shown for cumulative total mortality (A); cumulative mortality in people receiving a dose >LD25 (B); median time to die (C); percentage of exposed population actively treated in all facilities (D); percentage of exposed population admitted to critical care (E); proportion of exposed population ever classified as severely (F), moderately (G), or mildly (H) injured; and the proportion of the exposed population returning to full health (I).

Sarin Releases
Dose Response of the Chemical Agent to the Health Care System
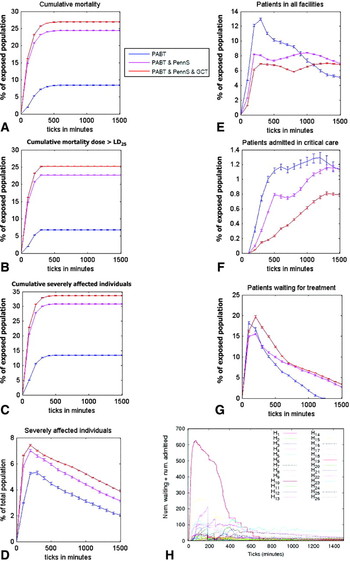
The effect of simultaneous 15-L releases of sarin at PABT, GCT, and PennS is depicted in Figure 2A–F. As a result of architectural differences and configuration, the air concentrations achieved are approximately 2.2 times greater in PennS than in the PABT, and 1.9 times greater in GCT than in the PABT. As the number of release sites increases, these concentration effects and stress on systemic capacity yield an absolute and relative percentage increase in overall mortality and mortality among people receiving high doses (>LD25). Specifically, the cumulative mortality rate is 8.42% for the PABT single scenario, 24.4% for the PABT and PennS scenario, and 27.0% for the 3-sites release scenario (Fig. 2A).
Sarin release, multisite. Effect of sarin release at 1 (PABT, blue), 2 (PABT and PennS, violet), or 3 (PABT, PennS, and GCT, red) sites: cumulative mortality (A), number of people receiving a dose >LD25 (B), cumulative number of severely affected patients (C), severely affected patients at any point in time (D), percentage of exposed population currently receiving care in all facilities (E), percentage of exposed population admitted to critical care (F), and percentage of exposed population waiting for treatment (G); and various hospital loads (total of presenting and admitted patients; H).

Hospital-based Disaster Plan Implementation
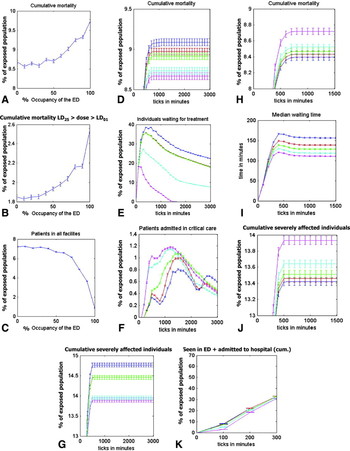
Figure 3 presents the effects of baseline ED capacity and response to disaster. Figures 3A–C demonstrate the worst-case results of crowding—that is, in the absence of implementation of an effective hospital disaster plan in a 15-L, single-site release. Initial ED contributions to cumulative mortality are demonstrated in Figure 3A. An increase in baseline occupancy limits effective care of casualties and increases cumulative mortality. Mortality increases remain most pronounced in the 80% to 100% ED occupancy range. This effect is most pronounced in the patients (LD25> initial sarin dose ≥LD1) who would benefit from early therapeutic attention before their health declines to an unsalvageable state (Fig. 3B). As ED occupancy increases, “exit block” is evident. The percentage of patients processed through admission to the hospital and moved out of the ED into hospital beds decreases as a result of the combined burden of increased waiting and treatment times (Fig. 3C). As initial occupancy of the ED increases, in the absence of an effective disaster plan, care capacity decreases for new incoming patients. Steep decreases are evident when the ED occupancy reaches more than 70%.
Health care facility crowding, surge response, and timing. The effects of initial ED and hospital capacity on overall mortality (A), mortality among patients receiving a potentially salvageable dose between LD1 and LD25 (B), and hospital admissions (C). Hospital surge response: none (dark blue), discharge of nonurgent ED patients and increasing “boarding” (phase 1, red), increased access to floor and critical care assets (phase 2, green), decreased ED throughput time by augmenting staff resources (phase 3, light blue), and establishing a separate MTA (phase 4, violet). The effects of implementation are shown for mortality (D), patients waiting for treatment (E), critical care resources (F), and patient achieving a severe status (G). The consequence of a delay in surge response by 0 (dark blue), 30 (red), 60 (green), 90 (light blue), or 120 (violet) minutes are depicted for mortality (H), waiting time (I), proportion of exposed population ever reaching severely affected status (J), and patients receiving care (K).

Execution of phase 1 through 4 hospital disaster plans decreases cumulative mortality from approximately 9.1% to 8.6% (Fig. 3D). The number of patients awaiting treatment similarly decreases (Fig. 3E). ICU admission occurs earlier and to a greater extent (Fig. 3F), with the overall result that the number of patients ever becoming severely ill or injured decreases from 14.7% to 13.9% (Fig. 3G).
Emergency Medical Services Response
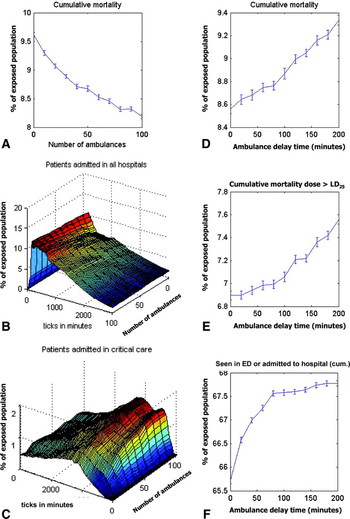
Figure 4 presents the results of an exploration of the parameter space (range of values) of a broad number of ambulance responding units and their delays to response. Overall mortality decreases as the number of responding ambulances increases from 0 to 100 (Fig. 4A). Hospital and ICU admissions occur earlier and at a higher rate as a consequence of more-rapid transport and patients arriving at the hospital in a more “salvageable” state (Fig. 4B, C). As response delay increases, cumulative mortality similarly increases (Fig. 4D). This escalating mortality results, in large part, from the severely affected patients dying before accessing definitive care (Fig. 4E).
EMS response. The effects of the number of responding ambulances are shown for cumulative mortality (A), hospital care (admitted patients) (B), and critical care utilization (C). The result of response delay (0–200 minutes) on overall mortality (D) and mortality in those receiving a high initial dose (> LD25) (E) and on cumulative hospital utilization (seen in ED or admitted) (F).

Patient Psychosocial Characteristics
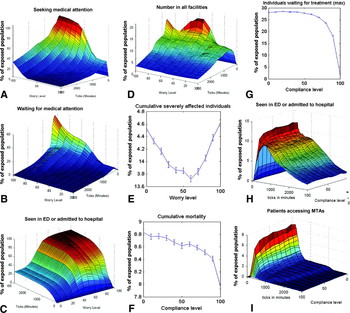
The effects of psychosocial responses are shown in Figure 5. As worry levels increase, the number of patients seeking assistance increases markedly (Fig. 3A), which contributes to the increased waiting time (Fig. 5B) and burden to the health care system (Fig. 5C). Extremely worried patients tire of waiting, seek alternative hospitals, and present as a second wave (Fig. 5D), delaying system recovery. The number of patients ever becoming severely affected increases as the worried population achieves a maximum level (Fig. 5E).
Psychosocial characteristics. The effects of increasing patient worry on those seeking medical attention (A), waiting for treatment (B), ever receiving care (C), currently receiving care (D), and injury severity (E). The effects of compliance on cumulative mortality (F), waiting for treatment (G), ever receiving care (H), and ever accessing a minor treatment area (I).

Additional Statistical Analysis
Sensitivity of the results to LCt50 and probit slope, population access to alternative means of transportation, and an image of the user interface are provided in the Appendix (online only). Demonstrations of GIS portability to Boston, Philadelphia, and San Francisco are available online only at http://links.lww.com/A1329 (video captions), http://links.lww.com/A1330, http://links.lww.com/A1331, http://links.lww.com/A1332, http://links.lww.com/A1333.
DISCUSSION
The use of ABM technology provides a powerful tool and adjunctive aid for medical and public health disaster planners to explore nonintuitive complex system dynamics in alternative geographic settings and for augmenting competency-based training to disaster planning and response.Reference Barnett, Everly and Parker60 ABMs permit both explicit tracing of individual behavior and macroscopic analysis of population trends. An additional advantage is that patient–hospital interactions are not constrained by imposed distribution assumptions. For example, ED arrival is stochastic according to individual psychosocial characteristics and systemic response. Multiple aspects of the sarin scenario could be assessed for disaster planning purposes, as outlined below.
Dose Response of the Chemical Agent to the Population
The rapid, significant mortality in the active dispersion scenario reflects the contribution of large numbers of patients receiving significant exposures (Fig. 1B). Median time to die is significantly shorter (27 minutes; Fig. 1C) in the active than in the passive release, reflecting the higher dose received. The first patient arrives in the ED in 10 minutes; severely affected patients do not arrive until 30 minutes later. The population proportion undergoing active treatment in facilities at any given time is less with active dispersion because of the high fatality rate (Fig. 1D). In the higher dose passive release scenarios, hospitals are occupied with affected patients for longer time periods, and ICU resources requirements are significantly increased (Fig. 1E); again, the significant early mortality with active dispersion tempers the effect on ICU resources. Figures 1F to 1H demonstrate the distributions of mild, moderate, and severely affected patients at any point in time. The health burden in the population is seen in Figure 1I. The percentage of the population returned to “full” health is significantly lower, and the return to full health takes significantly longer following exposure to higher doses of sarin.
Dose Response of the Chemical Agent to the Health Care System
The mortality rate among individuals receiving an LD25 increases by 6.81%, 22.7%, and 25.2% for the 1-, 2-, and 3-sites scenarios, respectively (Fig. 2B). The proportion of patients classified as severe at any given point in time and the number of patients who are ever severe (before either dying or recovering) are also significantly higher (Fig. 2C, D). For the PABT scenario, the percentage of patients who are ever severely affected is 13.4%, whereas in the 3-sites scenario, the percentage rises to 33.7%. The percentage of the total affected population that can be treated decreases (Fig. 2E), as does the percentage that can be admitted for ICU care (Fig. 2F), as the system reaches its maximum capacity. However, one must realize that the graphs provide a population percentage; in absolute numbers, the number of people admitted in all facilities and critical care does increase. For example, in the PABT scenario, at the maximum time point, 1.32% of the population was admitted in critical care (53 of 4000 people), compared with 0.81% (178 of 22,000 affected people) in the 3-sites scenario. Prolonged waiting times are also demonstrated (Fig. 2G). Patients also tend to overwhelm the closest hospitals (Fig. 2H).
Hospital-based Disaster Plan Implementation
Timely execution further improves mortality and access to care. Cumulative mortality decreases by 0.3% when disaster plans are implemented within 30 minutes, compared with 2 hours (Fig. 3H). The median waiting time for treatment (Fig. 3I) and the number of patients ever classified as severely injured at any point are similarly reduced (Fig. 3J). Earlier patient care (Fig. 3K) explains, in part, the gains. In summary, the incremental implementation of a disaster plan yielded decreased cumulative mortality, fewer severely affected patients, and lower ED waiting times and allowed for earlier usage of inpatient critical resources (Fig. 3D–G). Earlier implementation of hospital disaster plans diminished mortality and waiting times, reduced the number of patients who were ever severely affected, and improved access to care (Figure 3H–K). The data highlight the effects of surge response capacity, resource mobilization, and MTAs to address patient influx.Reference Halpern, Tsai and Arnold57, Reference Kelen and McCarthy61
Low-acuity patients commonly experienced long total ED times, although actual evaluation and treatment time was brief.Reference Saunders62 National data confirm this observation.Reference McCaig and Nawar54 Although many disaster patients will have limited injuries,6 they may impair evaluation and management of more severely affected patients. Significant numbers of critically ill patients also adversely affect care for other patients.Reference Ball, Kirkpatrick and Mulloy63 Although the ED is the gateway to definitive care during a disaster, a total health care facility approach must be taken to limit delays.Reference Hick, Hanfling and Burstein56 ED length of stay increases significantly once overall hospital occupancy reaches 90%.Reference Forster, Stiell and Wells64 Inadequate capacity of the hospital system to respond to increasing patient loads results in increased ambulance bypass and crowding under normal operations,Reference Fatovich and Hirsch65 causing concern that an emergency system already saturated with patients lacks effective response capacity in a disaster.6 Furthermore, critical care beds play a particularly important role in mass casualty events.Reference Avidan, Hersch and Spira66 Even under routine circumstances, without appropriate buffers, delay for critical care admissions increases exponentially at 80% to 85% capacity.Reference McManus, Long and Cooper53 Our exploration of ED occupancy parameters and surge response supports and reproduces these concerns.
An important consideration in disaster preparedness is the analysis of the response capacity of the system to determine tipping or failure points. This issue may be more significant in large or prolonged disaster scenarios when external aid is delayed. The evaluation in PLAN C of recovery points (ie, the stages when the fraction of patients awaiting or receiving care decreases, indicating discharges in excess of patient influx) is illustrated in Figures 1D, 2E to G, and 3E and F. When the system was further stressed with additional disaster sites, the number of causalities increased nonlinearly, and longer times to system recovery were evident. These results suggest that simulations could be used to estimate the duration of response network vulnerability.
Emergency Medical Services Response
The modeling results suggest that systems improvements should address early access to severely injured patients, for whom a narrow window of salvagability exists. Secondary exposure requiring treatment or removal of up to 10% to 15% of responders also should be anticipated.Reference Okumura, Suzuki and Fukuda28, Reference Yanagisawa, Morita and Nakajima67 Cumulative hospital utilization increased as patients became sicker by the time they received medical attention (Fig. 4F). Extra-borough areas were not modeled; therefore, the model did not address the concern that self-dispatch or overdispatch of EMS units from other jurisdictions may result in inadequate coverage at assigned stations.Reference Auf der Heide5
The arrival of patients with minor injuries before formal hospital notification may quickly overwhelm a health care system.6 Casualties may arrive at the closest hospitals within 5 to 30 minutes untriaged, prompting the recommendation that ambulances should avoid the hospital(s) closest to the disaster site. Reference Feeney, Goldberg and Blumenthal5,68,69 PLAN C replicated this emergent behavior because the closest hospitals treated the most patients, with well patients arriving early after the event and severely affected patients arriving later. The ability to model and observe casualty “loads” and the distribution at each hospital permits assessment and optimization of diversion of EMS patients to alternative hospitals before mass disaster. This is of particular importance because the ongoing closure of New York City hospitals has anecdotally increased ED crowding at remaining hospitals within their proximity.
Patient Psychosocial Characteristics
At artificially low worry levels, patients delay seeking care despite progressive illness, and at high worry levels, the burden imposed by additional patients impairs appropriate treatment for the whole population. As compliance increases (ie, patients who are not sick comply with instructions not to go to the hospital), cumulative mortality decreases (Fig. 5F). Appropriate self-triage decreases both the number of patients waiting for treatment (Fig. 5G) and the number seen in the ED or hospital (Fig. 5H). This effect is particularly pronounced in decreasing the number of well patients seen in the MTAs (Fig. 5I).
In planning documents, mildly affected patients or unaffected “worried well” individuals may represent 5 to 15 times the number of actually injured patients.31 Compliance varies by disaster scenario. Academic experts and emergency management coordinators envisage compliance rates of 70% to 80% for an evacuation order and 60% to 70% for a sheltering in place order.Reference Dombroski, Fischhoff and Fischbeck70 Concerns that public compliance with emergency directives may be compromised by individual perceptions of riskReference Williams and Magsumbol71 prompted the present authors to explore the effects of psychological factors in our behavioral analysis scenarios. Worry and poor compliance both produce adverse effects. Decreased levels of worry or increased compliance with the health message to access emergency care only when seriously injured improved cumulative mortality, waiting times, and system recovery times. Although interventions to increase public competency in health responses are difficult to effect,Reference Asplin, Flottemesch and Gordon46 they still may yield systemwide benefits.
PLAN C
The intent of PLAN C was to improve upon existing models and provide the integration of an appropriate amount of complexity, factual data, timeliness, and functionality for disaster planning and response.Reference Lewis72 Constructing the model with GIS data established appropriate topographical and transportation constraints. Use of a dose-response concept avoided a priori assumptions of injury severity. The integrated dose-response concept permits the substitution of dose-response curves for other hazards, such as trauma,Reference Gruss73 radiological sources,74 and biologicals (eg, anthrax).Reference Wilkening75 Linking output data from various dispersion models permits the creation of additional diverse scenarios. Although numerical (0.00–1.00) health scores may appear unfamiliar, they are well correlated and appropriately capture health status when applied to the US population and ED patients.Reference Luo, Johnson and Shaw76, Reference Stiell, Nesbitt and Nichol77 For example, the EuroQol-5D is incorporated into the Medical Expenditure Panel Survey of the Agency for Healthcare Research and Quality to support descriptive and behavioral analyses of the US health care system and international comparisons of health status.Reference Cohen78 Selection of the Environmental Protection Agency’s SPILL program contamination model was based on ease of application and availability. Alternative indoor contamination models with more complex flow analyses and architecture may also be substituted.79 Certain defaults (eg, sarin LCt50, hospital capacities, and assets responding) are provided on the basis of the best available information. The low-dose, passive 5-L release scenario results mirrors the Tokyo event, in which 4.75 L of passively released sarin produced 5500 “affected” patients, only 12 deaths, and minimal ICU admissions. Reference Pangi29,41,80 Parameters may be updated by the user according to local empirical data, definitive intelligence, database networks (eg, HAvBED),45 or advances in scientific knowledge. Parameter space exploration permits evaluation of these variables without knowledge of actual values. PLAN C’s ABM platform permits expansion to additional agents of interest.
Nevertheless, in simulation, absolute results of any model (including PLAN C) must be interpreted cautiously.Reference Lewis72, Reference Jones81 Models, no matter how intricate, simplify factors at many levels. Although the level of detail must be appropriately descriptive, the introduction of extraneous parameters may compound errors. Superseding judgment is not the goal; however, models are useful when they can suggest behavior or the effects of alterations in complex systems.Reference Lewis72, Reference Wiinamaki and Dronzek82
Although the model was initially applied to Manhattan (Supplementary Video 1, http://links.lww.com/A1330 [video captions available at http://links.lww.com/A1329]), subsequent assessments used public GIS data sets and demonstrated model portability to San Francisco, Boston, and Philadelphia (Supplementary Videos 2–4, http://links.lww.com/A1331, http://links.lww.com/A1332, http://links.lww.com/A1333).
CONCLUSIONS
The combined insights of a multidisciplinary team can produce an ABM to assist in the analysis of complex individual and systemwide disaster effects and responses in sarin release scenarios. This type of simulation permits a flexible platform for the exploration of multiple variables associated with relatively rare events. Further work will address theoretical and computational limitations, refinement and the integration of additional parameters of interest, other participants in disaster response, alternative hazard scenarios, and consequences of model overfitting.
Authors' Disclosures
The authors report no conflicts of interest. The authors' employer, New York University, intends to prepare a patent application on its own behalf.
Acknowledgments
The authors thank Venkatesh Mysore, PhD, Raoul-Sam Daruwala, PhD, Ofer Gill, PhD, Jeewoong Byeon, MS(c), and Rae Zimmerman, PhD, for contributions to the model and software development, and Robert Norman, PhD, for statistical advice and support.
This project was supported by a US Department of Homeland Security grant (2004-GT-TX-0001) to L.R.G. Funding for ongoing research and work in progress is provided by US Department of Defense grant 2007-NYU-001 to L.R.G.