I. INTRODUCTION
Materials that are capable of converting thermal energy into electricity and vice versa are known as thermoelectric materials. These materials can harvest thermal energy generated from natural heat sources (solar, geothermal, and human body) and from waste heat suppliers (industrial sector and motor vehicles). However, the relatively low efficiency of most of these materials has limited their widespread applications. Efficiency of the thermoelectric materials in general depends on the dimensionless figure-of-merit, ZT, which is defined as ZT = α 2σ/κ, where T is the absolute temperature, α is the Seebeck coefficient or thermal power, σ is the electrical conductivity, and κ is the thermal conductivity (κ = κ e + κ ph) which is the sum of the contributions from the electronic component and the phonon component (Rowe, Reference Rowe1995). Therefore, a high Seebeck coefficient and high electrical conductivity combined with low thermal conductivity are necessary to achieve high ZT. However, due to the interdependence of these parameters, optimizing ZT is a formidable challenge. For example, since both electrons and phonons contribute to the thermal conductivity of a material, lowering the electrical contribution, κ e, will reduce σ as well.
One of the most popular approaches to search for compounds with high ZT values is to search for semiconducting multi-component chalcogenides, followed by incorporating metal ions into the infinite metal-chalcogen frameworks (Kanatzidis et al., Reference Kanatzidis, McCarthy, Tanzer, Chen and Iordanidis1996; Chung et al., Reference Chung, Hogan, Brazis, Rocci-Lane, Kannewurf, Bastea, Uher and Kanatzidis2000; Choi et al., Reference Choi, Chung, Mrotzek, Brazis, Kannewurf, Uher, Che, Hogan and Kanatzidis2001; Hsu et al., Reference Hsu, Loo, Guo, Chen, Dyck, Uher, Hogan, Polychroniadis and Kanatzidis2004; Wang et al., Reference Wang, Huang and Lee2009). These ions act as rattlers in their local cavities, which create low-frequency vibration modes that scatter acoustic phonons and reduce the thermal conductivity. The most studied heavy-element materials include ternary and higher antimony chalcogenides (Takeuchi et al., Reference Takeuchi, Takagi and Yamanaka1974; Nuffield, Reference Nuffield1975; Matzat, Reference Matzat1979; Edenharter, Reference Edenharter1980; Berlepsch et al., Reference Berlepsch, Armbruster, Makovicky, Hejny, Topa and Graeser2001; Olsen et al., Reference Olsen, Balic-Zunic, Makovicky, Ullrich and Miletich2007). For example, Pb4Sb6S13 exhibits a complicated structure with large unit cells and a band gap that is expected to appear between fully occupied S p-states and the empty Pb and Sb p-states (Derakhshan et al., Reference Derakhshan, Asson, Taylor and Kleinke2006; Wang et al., Reference Wang, Huang and Lee2009). According to these authors, replacing S atoms by Se atoms would shrink the band gap by elevating the occupied p-states. At the same time, the ZT value benefits from lowered phonon contribution to the thermal conductivity caused by the heavier chalcogen Se as compared to S.
In this report, we will discuss the synthesis, crystal structure, as well as temperature-dependent Seebeck coefficient, electrical conductivity, and thermal conductivity of the substituted ternary selenide Pb4Sb6Se13 in which the Sb site is substituted by the mixed Bi/In site, resulting in a formula of Pb4(InxBi6-x)Se13. The Seebeck coefficient and electrical conductivity of two members of Pb4(InxBi6-x)Se13 (x = 2.1 and 2.8) have been studied at a relatively low temperature (up to 300 K) (Wang et al., Reference Wang, Huang and Lee2009). Furthermore, no thermal conductivity data and hence ZT values were available. In our work, the Seebeck coefficient and electrical conductivity measurements were performed for Pb4In2.6Bi3.4Se13 (x = 2.6 member) up to 700 °C. We also measured the temperature-dependent thermal conductivity so we were able to estimate the ZT value. The ICDD PDF database (Gates-Rector and Blanton, Reference Gates-Rector and Blanton2019) has the powder diffraction patterns for only the solid solution members Pb4In2.1Bi3.9Se13 and Pb4In2.8Bi3.2Se13. The powder X-ray diffraction (XRD) pattern for Pb4In2.6Bi3.4Se13 was, therefore, prepared and described in this report.
II. EXPERIMENTAL SECTION
A. Synthesis
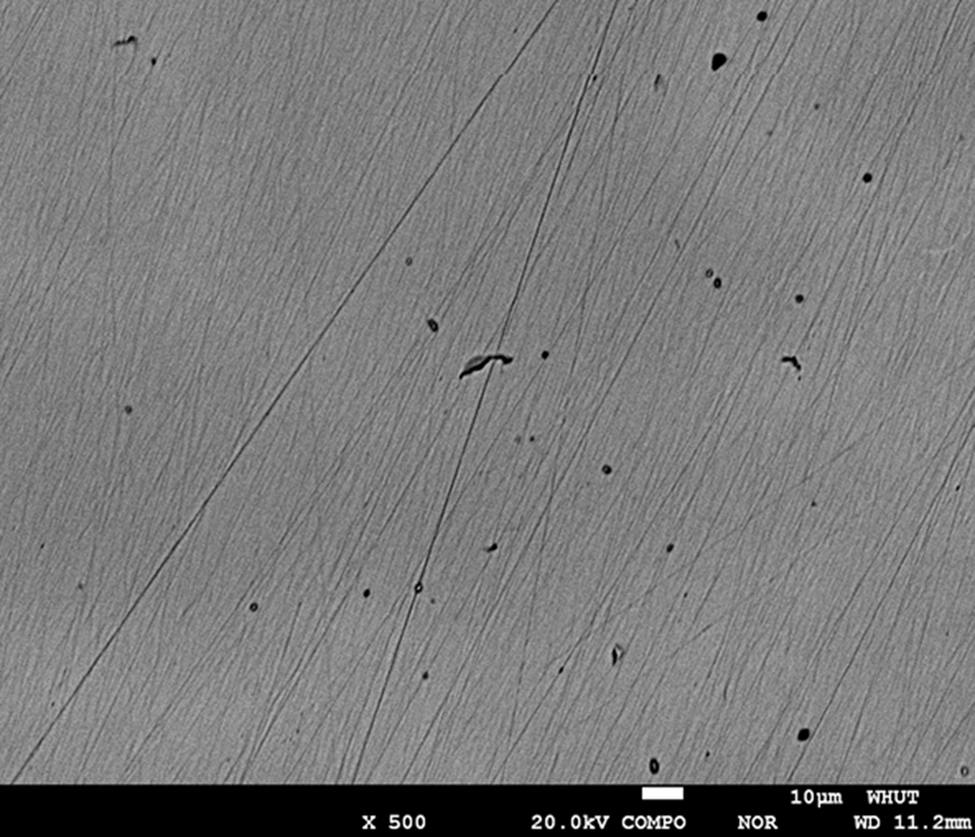
To prepare Pb4In2.6Bi3.4Se13, stoichiometric quantities of high-purity elements (Pb/In/Bi/Se = 4:2.6:3.4:13) were first loaded into evacuated fused-silica tubes, followed by heat treatment from 300 to 1023 K; the latter temperature was maintained for 10 h before natural cooling to about 300 K. After subsequent melting, annealing (773 K, 48 h) and plasma activated sintering (PAS) treatments (763 K, 8 kN), we obtained the final dense ingot. The resulting ingot was ground into fine powders and examined on a PANalytical X'PERT PRO diffractometer (40 kV, 40 mA, 5–80° 2θ with a scanning rate of 10° min−1) equipped with an X'celeator line detector and Cu radiation with λ of 1.54056 Å. (The purpose of identifying the equipment in this article is to specify the experimental procedure. Such an identification does not imply recommendation or endorsement by the National Institute of Standards and Technology.) A backscattered electron (BSE) image of the resulting sample is shown in Figure 1, indicating a homogeneous sample.
Backscattered electron image of a sample cut from Pb4In2.6Bi3.4Se13 showing the homogeneity of the sample.

B. X-ray Rietveld refinements and reference patterns
The Pb4In2.6Bi3.4Se13 phase was mounted as ethanol slurries on a zero-background cell. The XRD powder patterns of the former samples were measured on a Bruker D2 Phaser diffractometer (30 kV, 10 mA, 5–130° 2θ in 0.024° steps, 1 s step−1) equipped with a LynxEye position-sensitive detector. Cu radiation with λ of 1.54056 Å.
The Rietveld refinement technique (Rietveld, Reference Rietveld1969) with software suite GSAS II (Finger et al., Reference Finger, Cox and Jephcoat1994; Toby and von Dreele, Reference Toby and Von Dreele2013) was used to determine the structure of the Pb4In2.6Bi3.4Se13 phase. A reference pattern was obtained with a Rietveld pattern decomposition technique. Using this technique, the reported peak positions were derived from the extracted integrated intensities, and positions calculated from the lattice parameters. When peaks are not resolved at the resolution function, the intensities are summed, and an intensity-weighted d-spacing is reported.
C. Thermoelectric property measurements
The temperature-dependent electrical conductivity and Seebeck coefficient of samples were measured simultaneously using a commercial equipment (ZEM-3, UlvacRiko, Inc.) under 0.5 atm He atmosphere in the temperature range of 300–550 K. The thermal conductivity (κ) of the samples was calculated from the relationship κ = DC pd e, where D is the thermal diffusivity obtained by the laser flash method (LFA-457, Netzch, German), C p is the specific heat measured by a differential scanning calorimeter (DSC Q20, TA Instrument, USA), and d e is the density measured by the Archimedes method.
III. RESULTS AND DISCUSSION
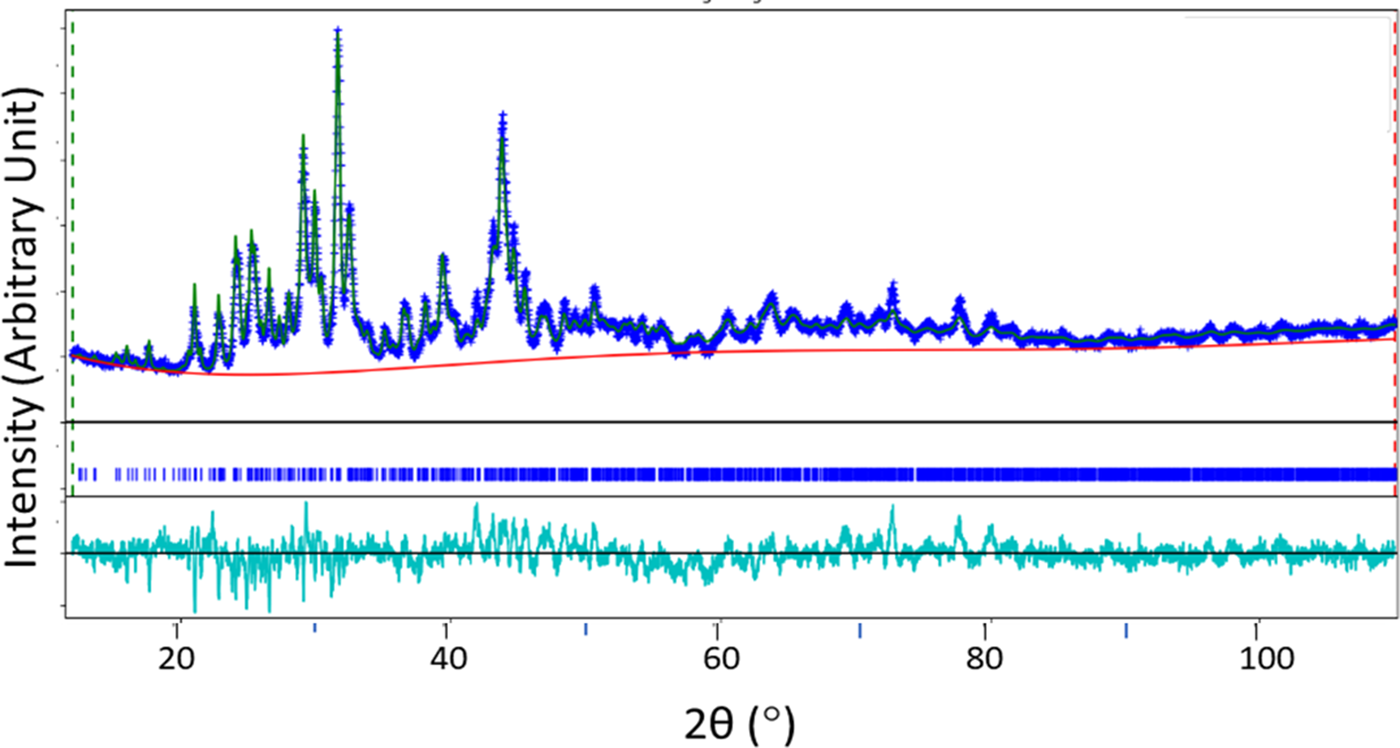
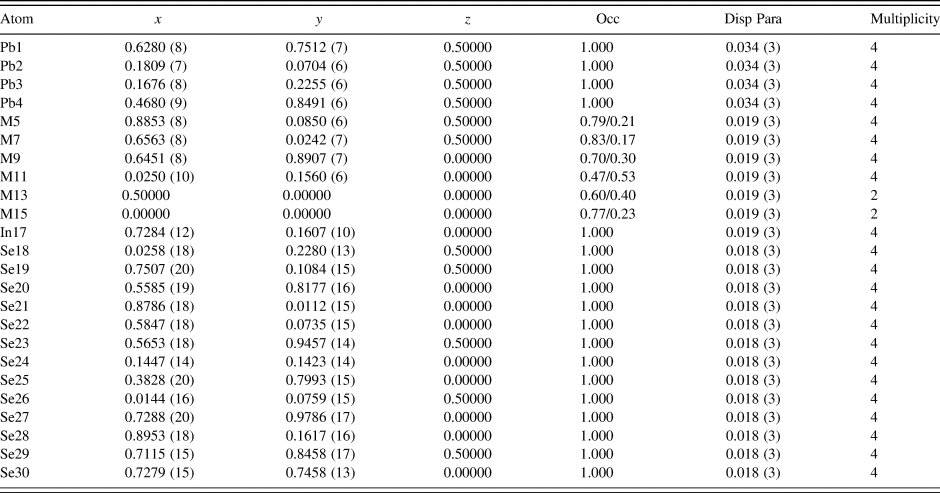
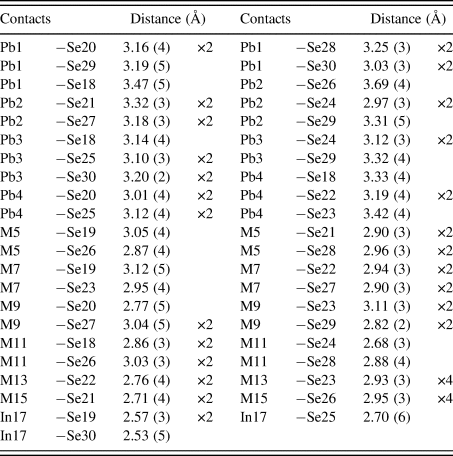
Figure 2 shows the plots of Rietveld refinements for Pb4In2.6Bi3.4Se13, where observed (crosses), calculated (solid line), and difference XRD patterns (bottom) are shown. The tick marks indicate the calculated peak positions, and the difference pattern is plotted on the same scale as other patterns. Table I gives various refinement R values and the goodness-of-fit value. The atomic coordinates and displacement parameters of Pb4In2.6Bi3.4Se13 are given in Table II (a total of 24 crystallographic inequivalent sites, 11 for cations and 13 for anions). Table III summarizes the selected bond distances concerning the mixed (Bi/In)Se6 and InSe6 distorted octahedra, InSe4 tetrahedra, and PbSe8 bicapped trigonal prisms.
Rietveld refinement pattern for Pb4In2.6Bi3.4Se13, where observed (crosses, blue), calculated (solid line, Green), background (red), and difference XRD patterns (bottom) are shown. The tick marks indicate the calculated peak positions, and the difference pattern is plotted on the same scale as other patterns.

Refinement parameters for Pb4In2.6Bi3.4Se13.

Atomic coordinates for Pb4In2.6Bi3.4Se13.

“Disp Para” represents displacement parameter and "Occ" stands for occupancy. M5 stands for mixed site of (Bi5/In6); M7 stands for (Bi7/In8); M9 stands for (Bi9/In10); M11 stands for (Bi11/In12); M13 stands for (In13/Bi14); and M15 stands for (In15/Bi16).
Interatomic distances for Pb4In2.6Bi3.4Se13.

M5 stands for the mixed site of (Bi5/In6); M7 stands for (Bi7/In8); M9 stands for (Bi9/In10); M11 stands for (Bi11/In12); M13 stands for (In13/Bi14); M15 stands for (In15/Bi16).
A. Structure of Pb4In2.6Bi2.4Se13
Pb4In2.6Bi3.4Se13 (black color) crystallizes in the space group Pbam (No. 189), Z = 4. Lattice parameters and calculated density Dx are: a = 22.152(5) Å, b = 27.454(5) Å, and c = 4.1354(6) Å, V = 2515.0(11) Å3, and Dx = 7.490 g cm−3.
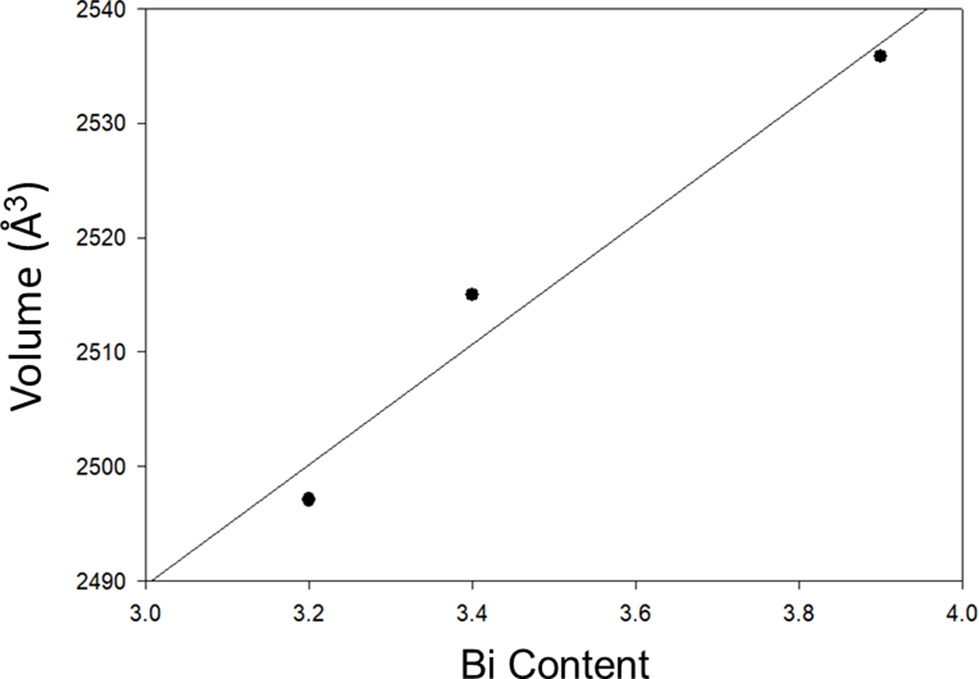
Since the atomic radius for Bi (1.60 Å) is greater than that of In (1.55 Å) (Slater, Reference Slater1964; Shannon, Reference Shannon1976), one expects the unit cell volume of the members in the Pb4(InxBi6-xSe13) solid solution series to follow a trend as a function of x. The unit cell volume of Pb4In2.6Bi3.4Se13 (2515.0(11) Å3) was found to be between that of Pb4In2.1Bi3.9Se13 (2535.8(9) Å3) and that of Pb4In2.8Bi3.2Se13 (2497.1(9) Å3) (Figure 3).
Volume of Pb4(InxBi6-xSe13) solid solution vs. a function of (6-x) (or the Bi content).

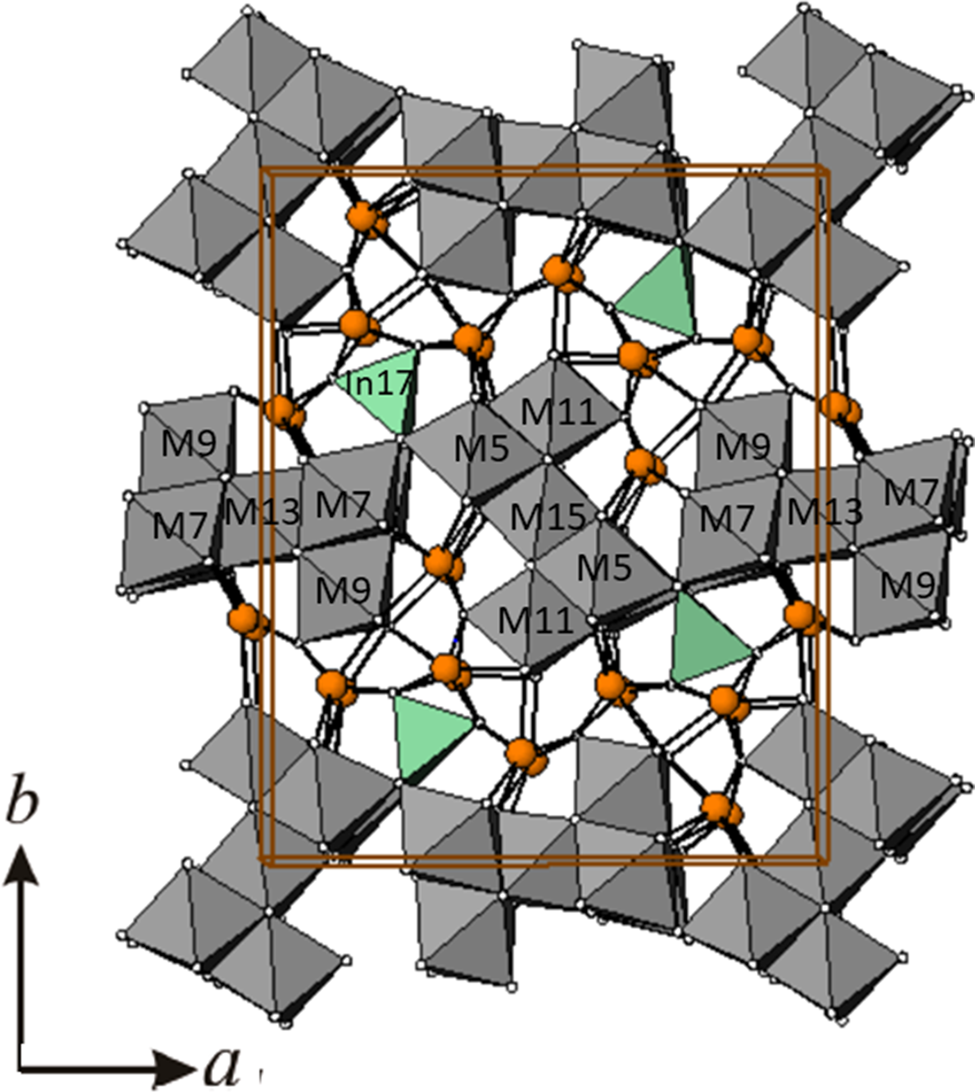
Figure 4 provides the crystal structure for Pb4In2.6Bi3.4Se13. The detailed crystal structure and electronic structure have been described by Wang et al. (Reference Wang, Huang and Lee2009). In summary, the complex structure features infinite chains of Z-shaped ribbon units (dark gray color) and tetrahedrons [InSe4] (green color) that share two vertices along the c-axis. The tetrahedral angles Se–In–Se in [InSe4] were found to be somewhat distorted from the ideal tetrahedral angles, namely: Se19–In17–Se19 of 107.4(16)°, In17–Se19–In17 of 107.4(16)°, and Se19–In17–Se30 of 116.3(13)°. The In–Se distances in these tetrahedra range from 2.53(5) to 2.70(6) Å, which are statistically in agreement with those found in compounds Pb4(InxBi1-xSe13) with x = 2.0, 2.1, and 2.8 (2.56–2.61 Å).
Crystal structure of Pb4In2.6Bi3.4Se13 showing Z-shaped ribbons (M5 stands for Bi5/In6, M7 stands for Bi7/In8, M9 stands for Bi9/In10, M11 stands for Bi11/In12, M13 stands for Bi13/In14, and M15 stands for Bi15/In16). Pb atoms are shown as orange spheres and the [InSe4]∞ tetrahedral chains (green).

The Bi/In mixed sites (M) form both corner-shared and edged-sharing octahedra (Table III and Figure 4, M5, M7, M9, M11, M13, and M15). These octahedra form two groups of symmetry independent Z-shaped ribbons which run along the c-axis. One group consists of M5, M11, and M15, and the other one consists of M7, M9, and M13. Similar to Pb4In2.1Bi3.9Se13 and Pb4In2.8Bi3.2Se13, those distorted octahedra (with Bi much greater than 50% occupancy in the Bi/In sites) were found to have three longer M–Se bonds vs. three shorter M–Se bonds, likely due to the presence of the 6s 2 lone-pair electrons of the Bi3+ cations.
The four Pb sites (orange color in Figure 4) all have the bicapped trigonal prism coordination environment and they connect the InSe4 tetrahedral units and the (Bi/In)Se6 octahedral units to form a three-dimensional network. These Pb–Se distances have a wide range of values from 2.97(3) to 3.69(3) Å.
B. Thermoelectric properties
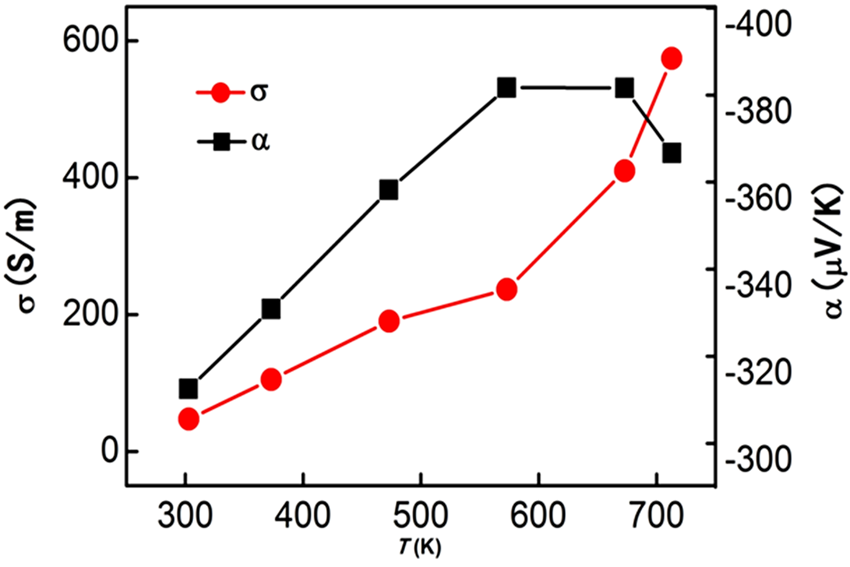
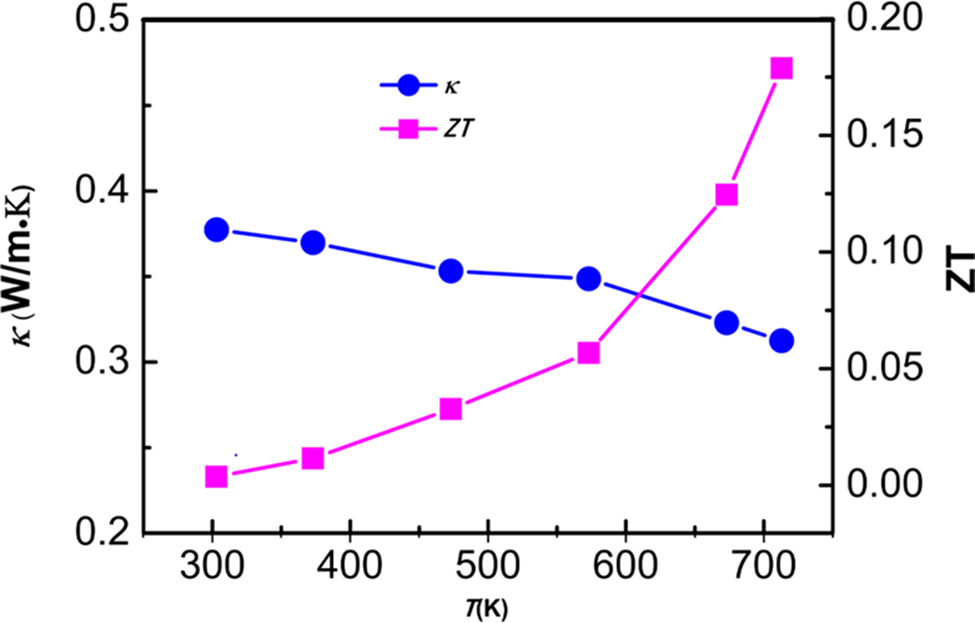
Figure 5 gives the electrical conductivity and Seebeck coefficient for Pb4In2.6Bi3.4Se13 as a function of temperature (f(T)), and Figure 6 shows the thermal conductivity and ZT for Pb4In2.6Bi3.4Se13 as f(T). The negative value of α implies the materials to be n-type semiconductors. It is seen that as temperature increases, so are the Seebeck coefficients and electrical conductivity, further confirming the compound to be a semiconductor. There is a maximum of the Seebeck coefficient value at around 600 K, at the same time, the conductivity rapidly increases above 600 K, probably a result of the bipolar conduction effect (caused by the low carrier concentration). The bipolar effect (the band gap for Pb4In3Bi3Se13 was reported to be 0.6 eV (Wang et al., Reference Wang, Huang and Lee2009)) is a negative process deteriorating the thermoelectric properties, particularly at high temperatures.
Electrical conductivity and Seebeck coefficient for Pb4In2.6Bi3.4Se13 as f(T).

Thermal conductivity and ZT for Pb4In2.6Bi3.4Se13 as f(T).

The structural and compositional complexity, the rattling effect of alkali metal and Pb2+ ions in the cavities, the alloy-type occupancy disorder among the In and Bi atoms in Pb4In2.6Bi3.4Se13 all combine to produce a low lattice thermal conductivity value. In Figure 6, one notes the κ values decrease as the temperature increases, ranging from 0.38 W m−1 K−1 down to 0.30 W m−1 K−1, which is a relatively low value in the series of multinary chalcogenides.
The figure of merit (ZT) for the Pb4In2.6Bi2.4Se13 phase was estimated to be 0.175 at about 700 K. For comparison, ZT of pure Bi2Te3 is 0.5 and the optimized Bi2Te3 alloy is about 0.9 (an industrially used material). Although the Seebeck coefficient of Pb4In2.6Bi3.4Se13 is near that of Bi2Te3, the electrical conductivity is too small for practical thermoelectric applications. Therefore, a ZT of 0.175, while a respectable value, is rather low as compared to the 0.5–0.9 value of that of Bi2Te3, and Pb4In2.6Bi3.4Se13 is not likely a viable candidate for further optimization efforts.
C. Reference XRD pattern
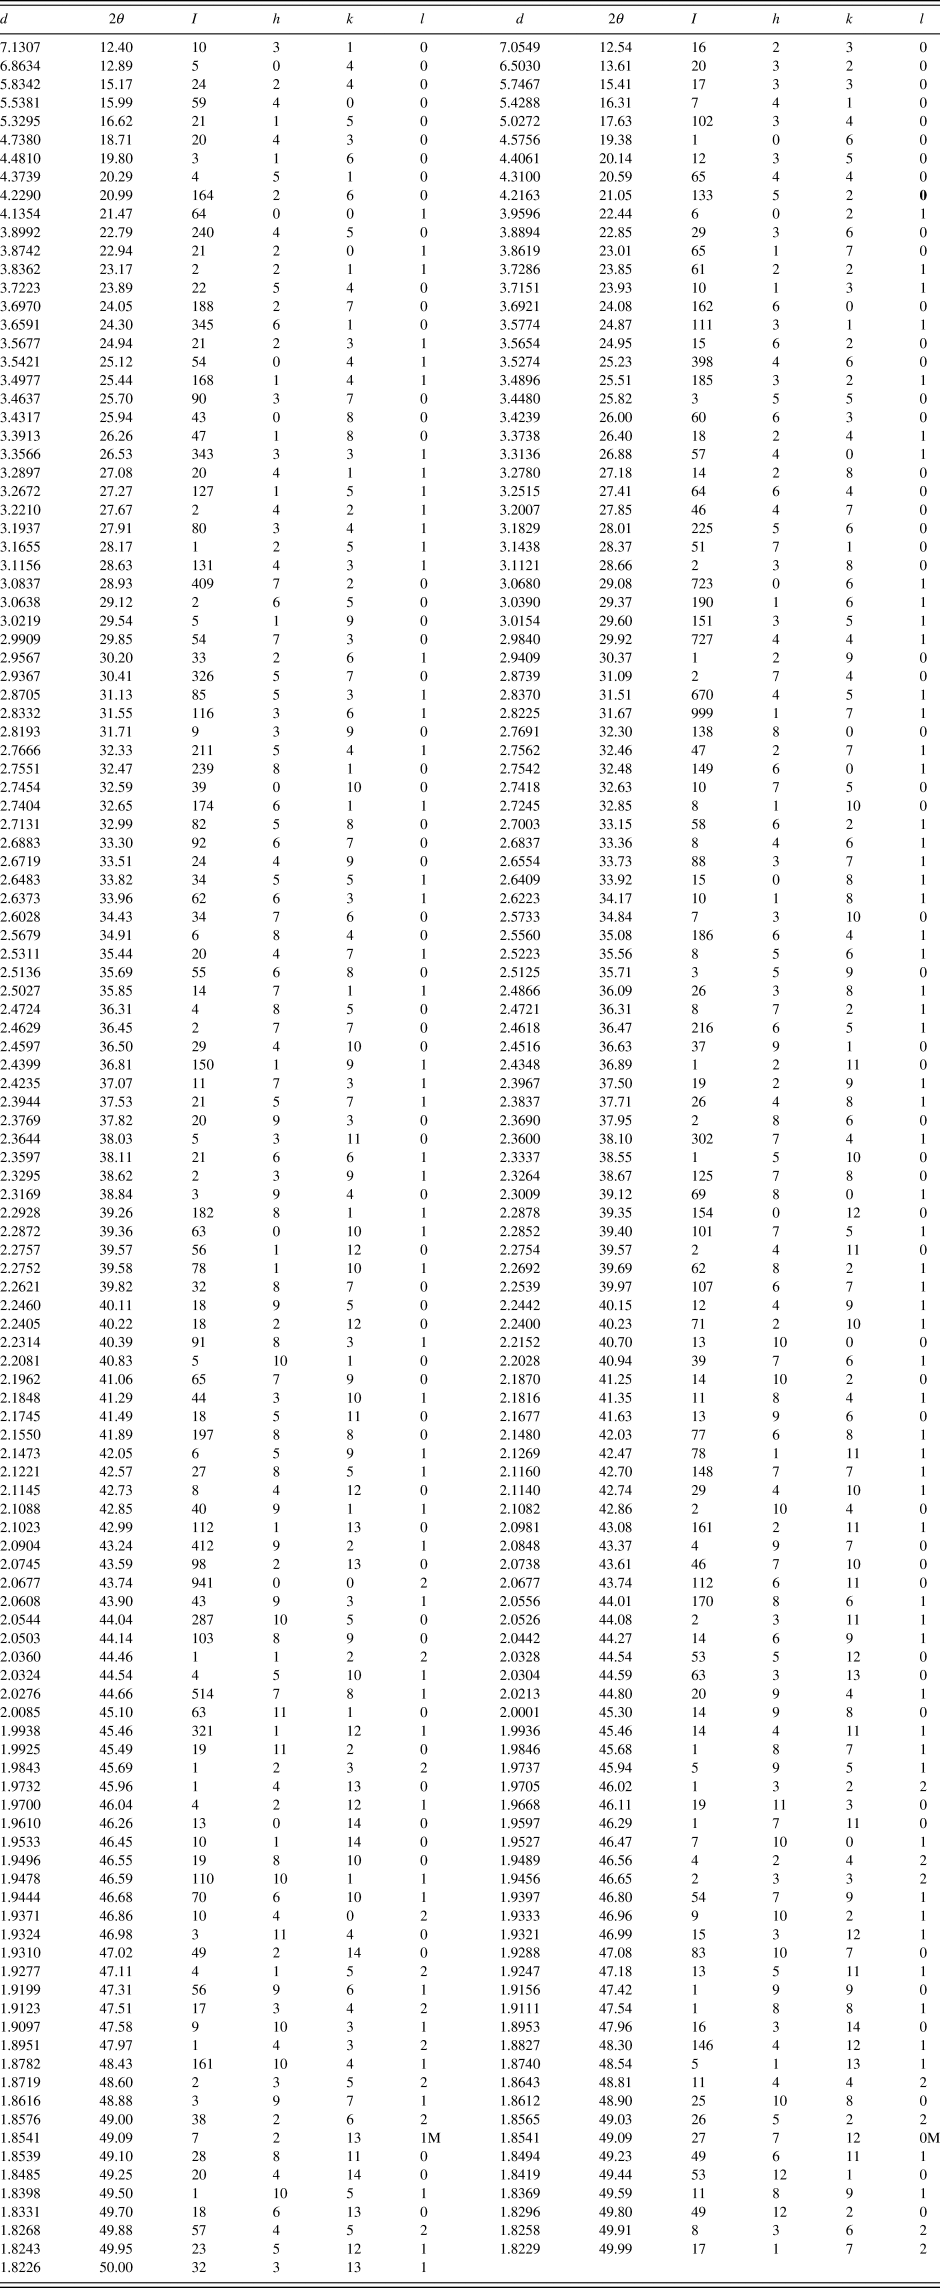
The reference pattern of Pb4In2.6Bi3.4Se13 is provided in Table IV. As the compound has a large unit cell, one expects a great number of peaks in the XRD pattern. Therefore, we report the pattern to a limit of 2θ <50°. In this pattern, the symbol “M” refers to peaks containing contributions from two reflections. The particular peak that has the strongest intensity in the entire pattern is assigned an intensity of 999 and other lines are scaled relative to this value. In general, the d-spacing values are calculated values from refined lattice parameters. The intensity values reported are integrated intensities (rather than peak heights) based on the corresponding profile parameters as reported in Table I. For resolved overlapped peaks, intensity-weighted calculated d-spacing, along with the observed integrated intensity and the hkl indices of both peaks (for “M”) are used. For peaks that are not resolved at the instrumental resolution, the intensity-weighted average d-spacing and the summed integrated intensity value are used. In the case of a cluster, unconstrained profile fits often reveal the presence of multiple peaks, even when they are closer than the instrumental resolution. In this situation, both d-spacing and intensity values are reported independently.
X-ray powder pattern for Pb4In2.6Bi3.4Se13, Pbam (No. 189), a = 22.152(5) Å, b = 27.454(5) Å, and c = 4.1354(6) Å, V = 2515.0(11) Å3, Dx = 7.49 g cm−3.

The particular peak that has the strongest intensity in the entire pattern is assigned an intensity of 999 and other lines are scaled relative to this value. The symbols “M” refers to peaks containing contributions from two reflections. The d-spacing values are calculated values from refined lattice parameters, and “I” represents integrated intensity values.
IV. SUMMARY
Quaternary selenides, Pb4InxM 6-xSe13 (M = Bi, x = 2.6), or Pb4In2.6Bi3.4Se13, was synthesized and characterized. The crystal structure, isostructural with that of Pb4In2Bi4S13, features a three-dimensional framework consisting of Z-shaped ribbon motifs and corner-sharing infinite one-dimensional [InSe4] chains running parallel to the c-axis, and connected with Pb atoms to form a three-dimensional network. For Pb4InxM 6-xSe13, In and Bi atoms are distributed over sites M5–M15 with a varied ratio to form a solid solution. Measurements of electrical conductivity show increasing values with increasing temperature for Pb4InxM 6-xSe13. The Seebeck coefficient of Pb4In2.6Bi3.4Se13 was found to be approximately −385 μV K−1 between 550 and 650 K, indicating the compound to be an n-type semiconductor. However, the conductivity increases with increasing temperature (Figure 5), indicating that In is not an effective dopant in this system. Although the Seebeck coefficient of Pb4In2.6Bi3.4Se13 is near that of Bi2Te3, the electrical conductivity is too small (ZT of 0.175) for industrial thermoelectric applications. The results of transport data with a better dopant in future work may provide a clearer insight into the potential of this material system.
V. DEPOSITED DATA
The supplementary material for this article, which includes the Crystallographic Information Framework (CIF) file containing the results of the Rietveld refinement (including the raw data), was deposited with the ICDD. The data can be requested at info@icdd.com.
FUNDING
This work was performed at the Advanced Photon Source, an Office of Science User Facility operated for the U.S. Department of Energy (DOE) Office of Science by Argonne National Laboratory, and was supported by the U.S. DOE under Contract No. DE-AC02-06CH11357.
CONFLICTS OF INTEREST
The authors have no conflicts of interest to declare.